¶ 1LV - Orbital Launch Vehicles
¶ 1. Roadmap Overview
Orbital launch vehicles (LV) systems are used to carry payloads from Earth’s surface to Earth orbit or beyond. Orbital Launch Vehicles, in all modern instances, are powered by rocket engines that generate large amounts of thrust even in a vacuum by means of expelling propellant through a nozzle. This is accomplished by converting stored chemical energy within fuels to kinetic energy through means of combustion or chemical reaction. There are several different styles of rocket engines that are used today (all of which meet the primary functional requirements); however, they perform those functions in slightly different ways with slightly different architectures. Examples of this include liquid rockets, which utilize fuel and oxidizer, and solid rockets which utilize solid rocket fuel. The architecture of the rocket is primarily determined by their fuel type and their fuel consumption method. A common rocket engine used on launch vehicles is the full-flow staged-combustion closed-cycle liquid fueled engine. This roadmap focuses on launch vehicles as a system to include different engine types. For more information on specific rocket engines the related 2RE rocket engine roadmap is recommended.

Reference: NASA SMAP
Other components of the rocket include propellant tanks, the launch vehicle aerodynamic body, and the payload adapters and fairings used to protect whatever is being launched. Within the launch vehicle there are additional subsystems such as guidance navigation and control, and communications. For the purpose of this roadmap, these components and subsystems are part of the larger orbital launch vehicle system.
This roadmap is a Level-1 point of view of the launch vehicles as a technology that enables the Human race to transport cargo from the surface of the Earth to outer space as well as a Level-2 roadmap of liquid-fuel rocket engines which are one of the most used technologies of rocket engines.
The long term vision of this roadmap is to articulate the R&D goals to bring key Launch Vehicle FOMs into an ideal range, and detail reasonable timelines to accomplish these goals while remaining competitive with other industry leaders in the LV space.
There are additional dependencies of this roadmap among the following MIT roadmaps:
- [1SLV] - Small Launch Vehicles
- [2RE] - Rocket Engines
- [2CFTS] - Cryogenic Fuel Tanks in Space
- [3OORR] - On Orbit Refueling and Repositioning
¶ 2. Design Structure Matrix (DSM) Allocation
The following plots show the DSM allocation for the orbital launch vehicles roadmap, including dependencies.
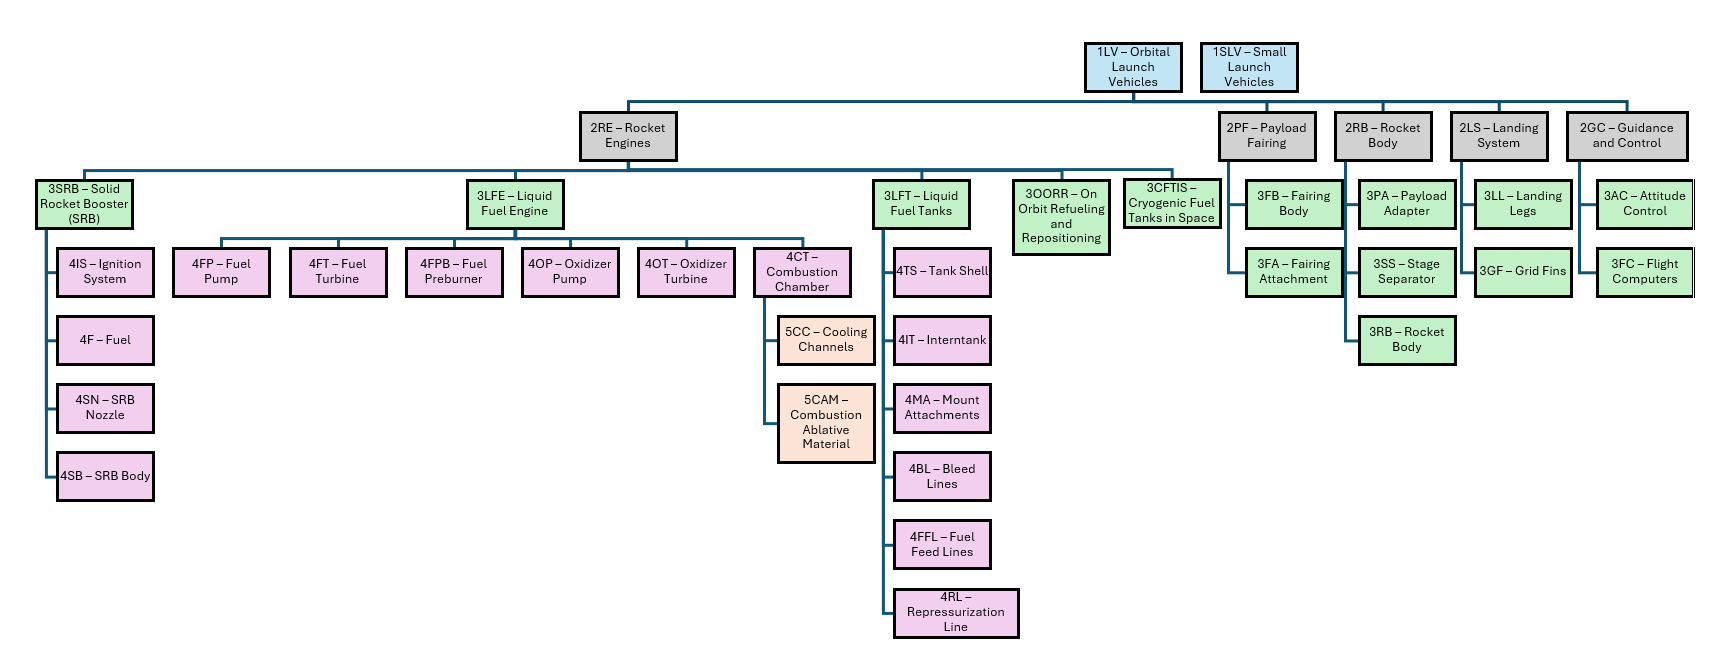
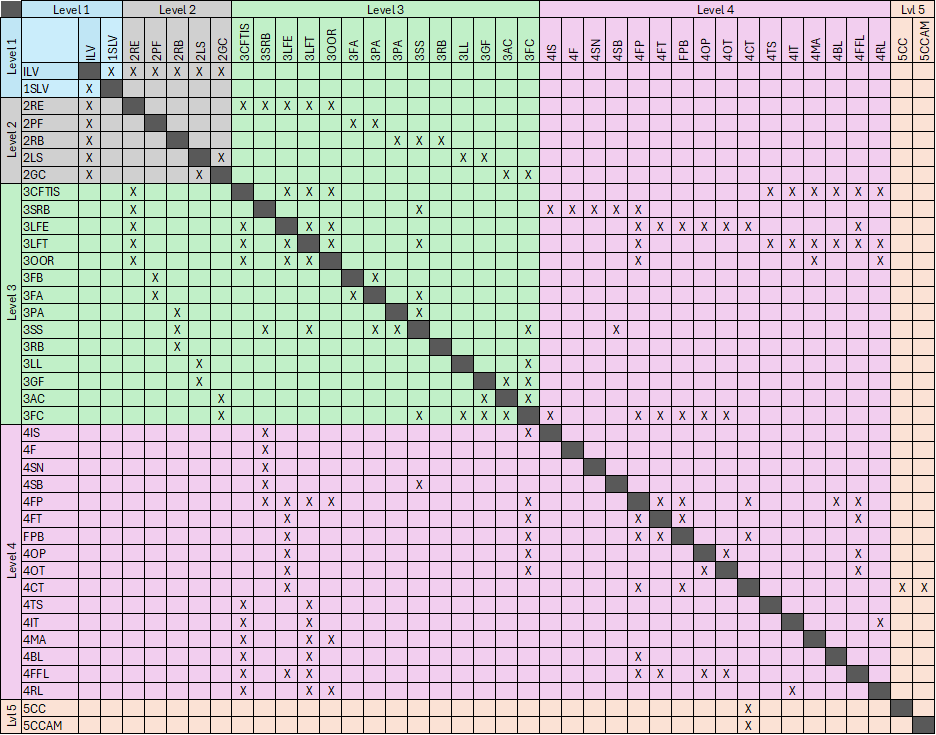
This can be hierarchically decomposed into the following sections. Links to other relevant roadmaps are provided. Note that several of the interdependencies have additional elements that are omitted.
- 1LV – Orbital Launch Vehicles
- 2RE – Rocket Engines
- 3SRB – Solid Rocket Booster (SRB)
- 4IS – Ignition System
- 4F – Fuel
- 4SN – SRB Nozzle
- 4SB – SRB Body
- 3LFE – Liquid Fuel Engine
- 4FP – Fuel Pump
- 4FT – Fuel Turbine
- 4FPB – Fuel Preburner
- 4OP – Oxidizer Pump
- 4OT – Oxidizer Turbine
- 4CT – Combustion Chamber
- 5CC – Cooling Channels
- 5CAM – Combustion Ablative Material
- 3LFT – Liquid Fuel Tanks
- 4TS – Tank Shell
- 4IT – Interntank
- 4MA – Mount Attachments
- 4BL – Bleed Lines
- 4FFL – Fuel Feed Lines
- 4RL – Repressurization Line
- 3CFTIS – Cryogenic Fuel Tanks in Space
- 3OORR – On Orbit Refueling and Repositioning
- 3SRB – Solid Rocket Booster (SRB)
- 2PF – Payload Fairing
- 3FB – Fairing Body
- 3FA – Fairing Attachment
- 2RB – Rocket Body
- 3PA – Payload Adapter
- 3SS – Stage Separator
- 3RB – Rocket Body
- 2LS – Landing System
- 3LL – Landing Legs
- 3GF – Grid Fins
- 2GC – Guidance and Control
- 3AC – Attitude Control
- 3FC – Flight Computers
- 2RE – Rocket Engines
- 1SLV – Small Launch Vehicles
¶ 3. Roadmap Model using OPM
This Objective Process Diagram shows the high-level operation of Orbital Launch Vehicles. The fundamental operation mapped here is transporting the launch vehicle system from its ground to airborne state.
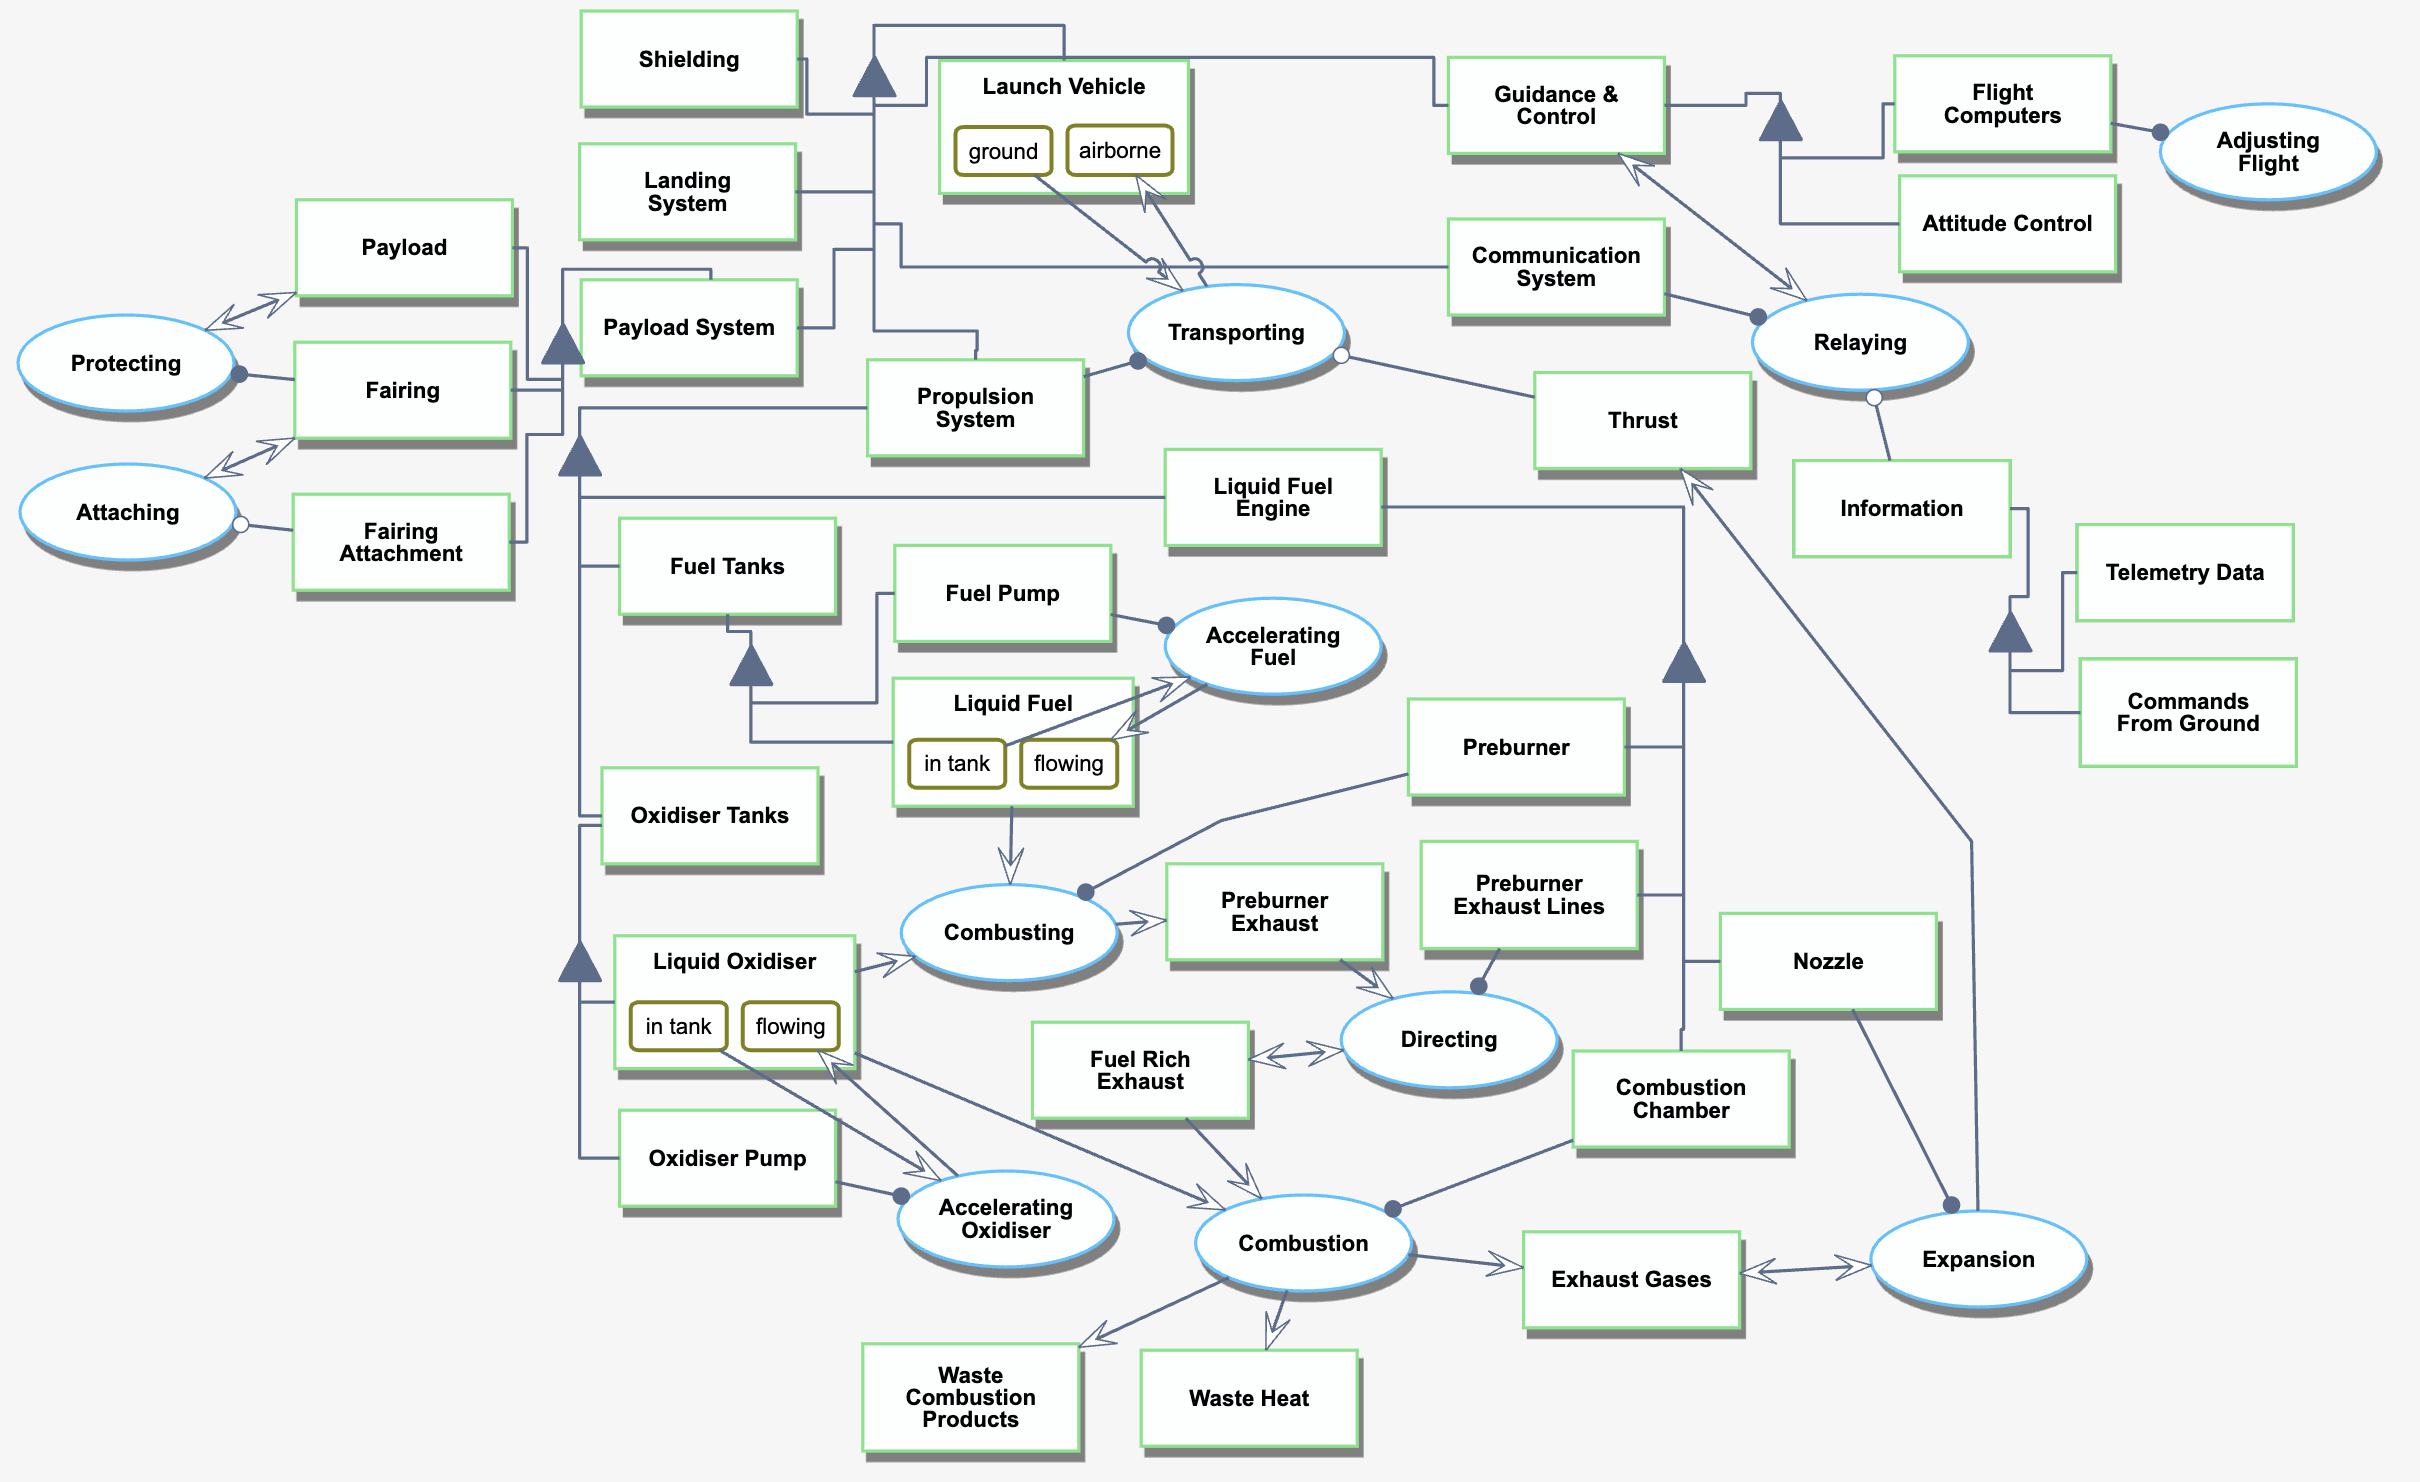
Each of the component systems which comprise the launch vehicle itself (shielding, landing system, payload, guidance & control, communication system) can be decomposed further into its own objective-process diagram; the specifics underlying how many of the subsystem objects can be interrelated is described by the DSM above. Many subsystem processes can themselves be further decomposed.
By decomposing several representative systems (propulsion, communication, guidance) into their first-level subsystems, we articulate both the flow of matter through the launch vehicle object, but also the level of complexity underlying the launch vehicle system. This complexity is helpful to keep in mind for the R&D segment of this roadmap, as we describe how advancements in modularization and streamlining of production processes has potential to significantly reduce costs. The scale of improvement possible for these goals is best considered in parallel to the scale and number of complex, interrelated, and frequently non-reusable subsystem objects.
¶ 4. Figures of Merit (FOM)
We define several FOMs for launch vehicles, taking into account the interests of multiple different stakeholders across the OLV ecosystem.
| FOM | Units | Description |
| Cost per kg to LEO | [$/kg] | Total cost of the launch divided by total kg of payload delivered to LEO (low earth orbit). |
| Payload to mass ratio | [kg/kg] | Total mass of payload in a LEO configuration divided by the total mass of the launch vehicle, providing a measure of efficiency for the launch system as a whole. |
| Reliability | Non dimensional | Number of successful launches divided by total launches. Has implications for overall cost for developers as well as satisfaction for customers. |
| Payload to LEO | [kg/year] | Payload mass that can be put into a 500km circular low earth orbit for a given launch vehicle per year for a single launch vehicle. 500km specifies a particular altitude within the LEO range for specificity. Has implications for production rate and reusability of vehicles. |
| Reusability | [%] | Percentage of vehicle dry mass (excluding fuel and payload) which can be reused from launch to launch. |
| Lifecycles | [total uses] | Number of designed uses for a launch vehicle over its service lifetime. This captures reusability from another angle, looking at the relative durability of launch systems, and has implications for long term costs to manufacturers and launch providers. |
These FOMs encapsulate the full scope of our notional launch vehicle company's priorities. They cover the technical goals (payload-mass ratio and lifecycles), customer interests (cost/kg LEO and reliability), and underlying financial margins (reusability, cost/kg LEO, lifecycles) essential to describing a fully-realized company that can compete and innovate in the OLV space.
FOM trends
In literature there are several studies on the improvement of launch cost over time. In general, across the history of launch vehicles, the cost to launch is decreasing exponentially when adjusted for inflation. This is seen in the figure below:
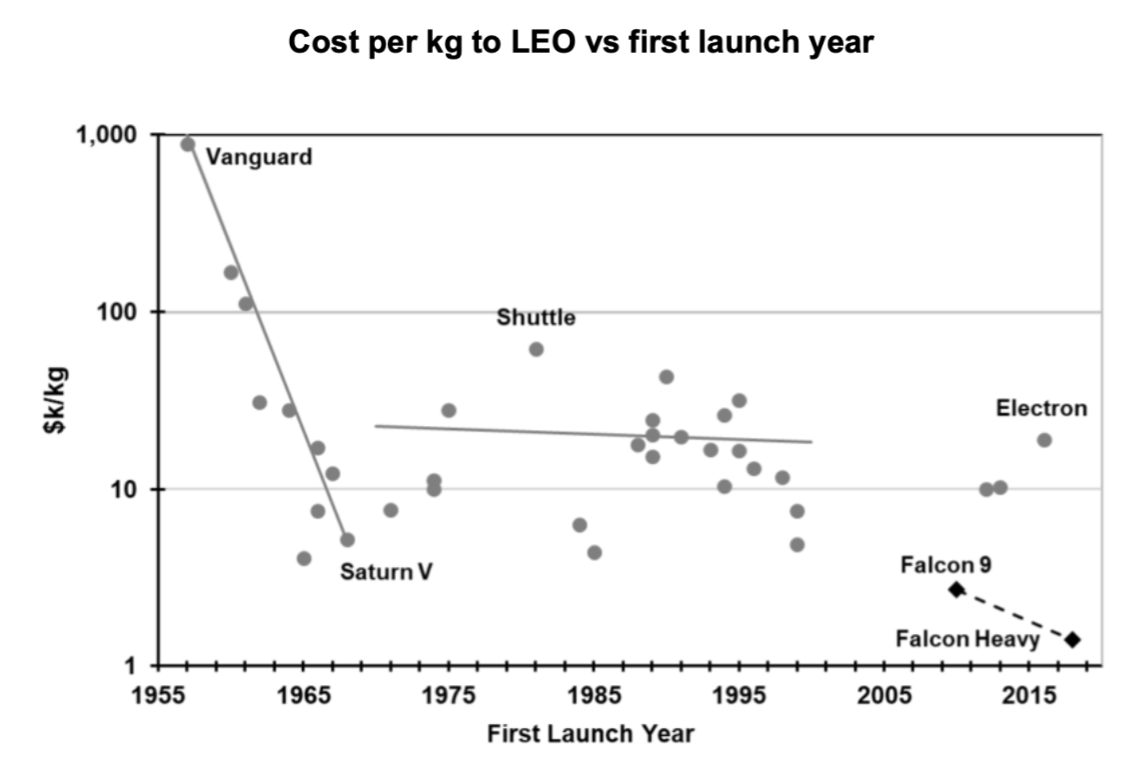
This figure illustrates several interesting trends. For one, the early space race lowered the cost to orbit dramatically with the Saturn V program. However, after the Apollo program ended there was a period of relative cost stagnation and even increase with the Space shuttle. Most recently, trends with reusable rockets such as Falcon 9 and others in development at Blue Origin have sparked new cost savings. However, only limited data is available on the latest generation of reusable launch vehicles. Attempting to calculate the average improvement can be modelled fairly easily, and is shown below:
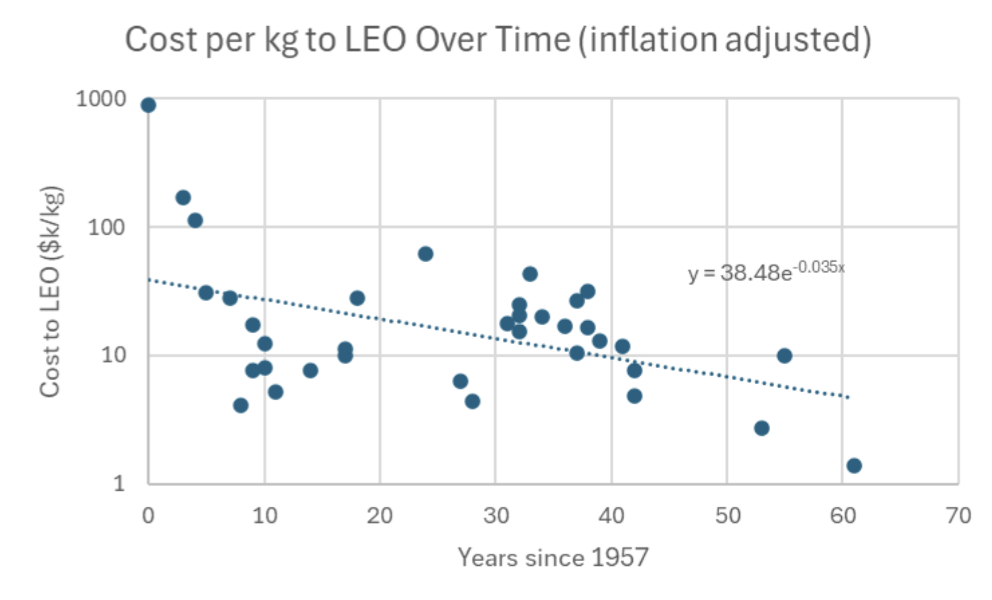
Despite the initial appearance, there is a clear trend and the cost does exponentially decrease. Given this data set, the data trend can be modelled by exponential decay, and the cost roughly halves every 19.8 years. However, given that reusable rockets are so disruptive, another way to view this data is to only look at launch vehicles developed since 1990. This is an arbitrary time picked during an era where shuttle missions were beginning to ramp down and new launch vehicles were being introduced. However, it is still arbitrary and this data curation should be viewed cautiously.
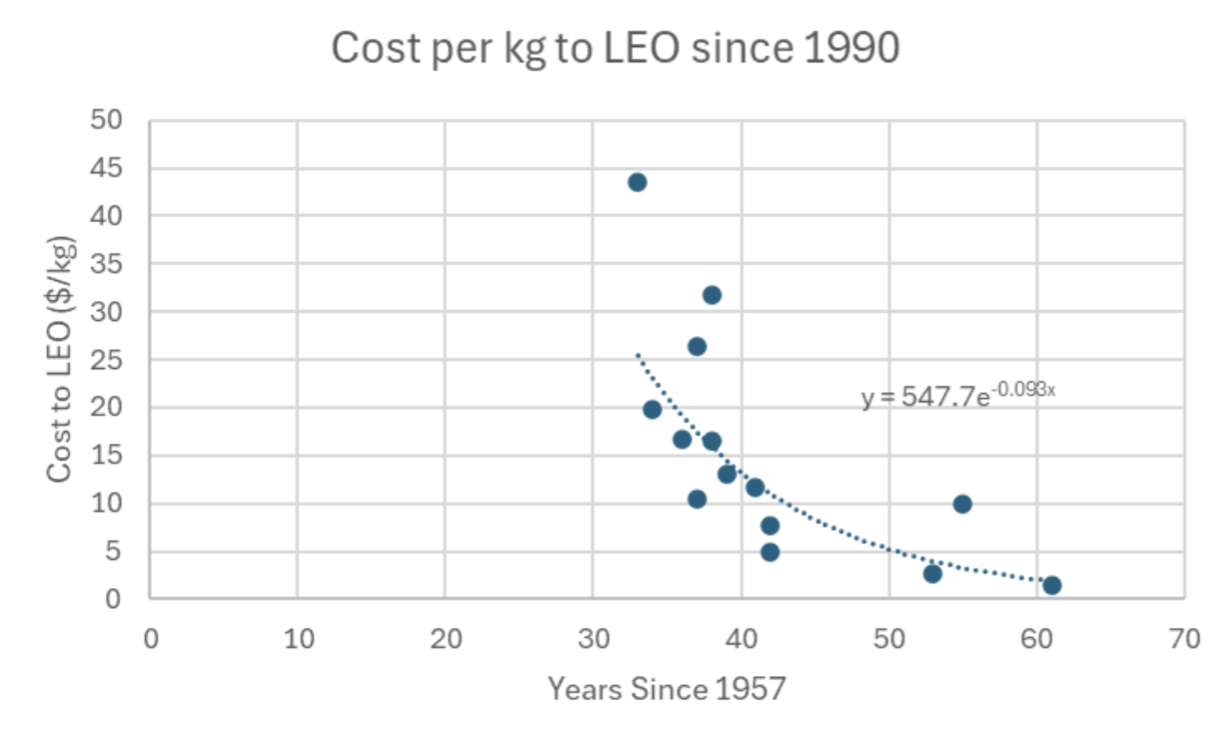
In this case “modern” launch vehicles halve the cost every 7.45 years. It is apparent the rate has increased.
A theoretical limit to launch costs exists, and while debated consists of the cost to initially build the rocket divided by number of launches, plus cost to refurbish per launch, and the cost of fuel per launch. There is also a corporate profit margin that must be included since companies like SpaceX and Blue Origin are for profit. This reasoning can be represented by Equation 1 below:
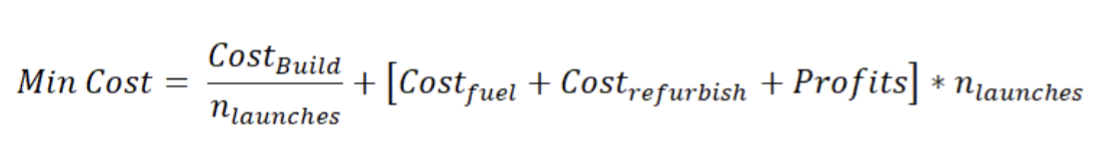
Given high reusability, the build costs theoretically go to zero, leaving the minimum cost the sum of fuel, refurbishment, and profits. However, the cost to build is likely substantial, thereby the term would likely still carry some value even if a vehicle can be re-used over 100 times. To realize the minimum cost, the technology of launch vehicles will need to prioritize maximizing reusability, while minimizing fuel and refurbishment expenses.
Referencing Figure 1 and Figure 4, it can be estimated that launch vehicles cost per kg to LEO is in a period of rapid growth (a reduction of expenses). Figure 1 clearly shows three “S-Curves” during the Apollo, Shuttle, and post-Shuttle eras. Figure 4 shows the clear exponential decay in cost, with estimates that are consistent with Moore’s law. While Equation 1 describes a highly theoretical limit, it appears that it has not yet been reached.
¶ 5. Alignment of Strategic Drivers: FOM Targets
We describe here the FOM targets that will allow our notional company to align itself with the current industry standard of business and position itself to be competitive in both the short and long term. These strategic drivers also serve to inform the R&D timeline later in this roadmap.
| ID | Strategic driver | Alignment with targets |
| 1 | Create a low-cost launch system to generate complete with industry leaders as a fast follower. | Development of a launch system that can deliver 1kg of payload to LEO for less than $1000 will deliver a capability to directly compete with industry leaders. Closely coupled to this driver is the ability to have a payload to mass ratio greater than 4%. Further innovations in rocket engine technology, reliability, and net lifecycles can help attain this goal, and this driver is also closely linked with strategic drivers 2 and 3. |
| 2 | Provide high reusability to maximize profits and further reduce costs. | High lifecycles of over 100 launches per vehicle paired with reusability of over 95% of original dry mass allow wider profit margins in alignment with the cost equation outlined above. To attain high lifecycles the reliability of the system will also need to be exceptionally high and see less than 1 failure per 100 launches. These will create a fast follower advantage and challenge current industry leaders. |
| 3 | Attain a high launch cadence to win launch contracts, and further increase profits. | Attaining a high launch cadence greater than 100,000 kg/month or 1,200,000 kg/year to LEO will enable direct competition with industry leaders, give availability to win launch contracts, and increase profit margins. |
The notional company’s technology roadmap is positioned to be a fast follower of the current industry standard. While present industry leaders claim even more ideal numbers than the FOM targets presented, they continue to face challenges innovating and developing new capabilities as a first-mover. By focusing on the FOMs laid above, the notional company can quickly become profitable and competitive, surpassing other launch providers that remain in the defensive technological strategy. All targets listed are within current FOM trends and follow governing equations, and therefore are technically feasible.
¶ 6. Positioning of Organization vs. Competition: FOM charts
The following section compares a known database of current launch vehicles with known FOM values with the notional company described above. While not all launch FOMs could be located for all launch vehicles, this represents the best publicly available dataset. From this table several charts were produced which showcases the pareto front of the various figures of merit. A future expansion of this work could develop a value function based on the figure of merit listed to better compare all FOMs in a single plot.
| Launch Vehicle | Cost Per Kg to LEO (2025 $USD) | Payload/Wet Mass Ratio (kg/kg) | Reliability | Payload to LEO (2024-2025) | Reusability | Design Lifecycles |
| Notional Company | $1000 | 4% | 99% | 1,200,000 kg | 90% | 100 |
| Falcon 9 | $2700 | 4.1% | 99.4% | 1,497,000 kg | >90% | >20 |
| Long March 5 | $4700 | 2.94% | 93% | 22,000 kg (estimated) | 0% | 1 |
| Ariane 5 | $8476 | 2.5% | 100% | N/A | 0% | 1 |
| Falcon Heavy | $1400 | 4.5% | 100% | 63,800 kg | >90% | >20 |
| Electron | $18000 | 2.3% | 94.5% | N/A | N/A | >1 |
| Starship | $300 (estimated) | 3.0% (estimated) | TBD | 0 kg | TBD | >70 (estimated) |
| New Glenn | $2400 (estimated) | 2.5% | TBD | 0 kg | TBD | >25 (estimated) |
| Vulcan Centaur | $4000 (estimated) | 4.98% | TBD | 0 kg | TBD | 1 |
Due to the sparseness and uncertainty of data, we visualize those with the most robust available datasets: cost per kg to LEO, payload to mass ratio, and reliability. To better display the data all values were normalized. Note that in this case estimated FOM values for Starship, New Glenn, and Vulcan Centaur were used.
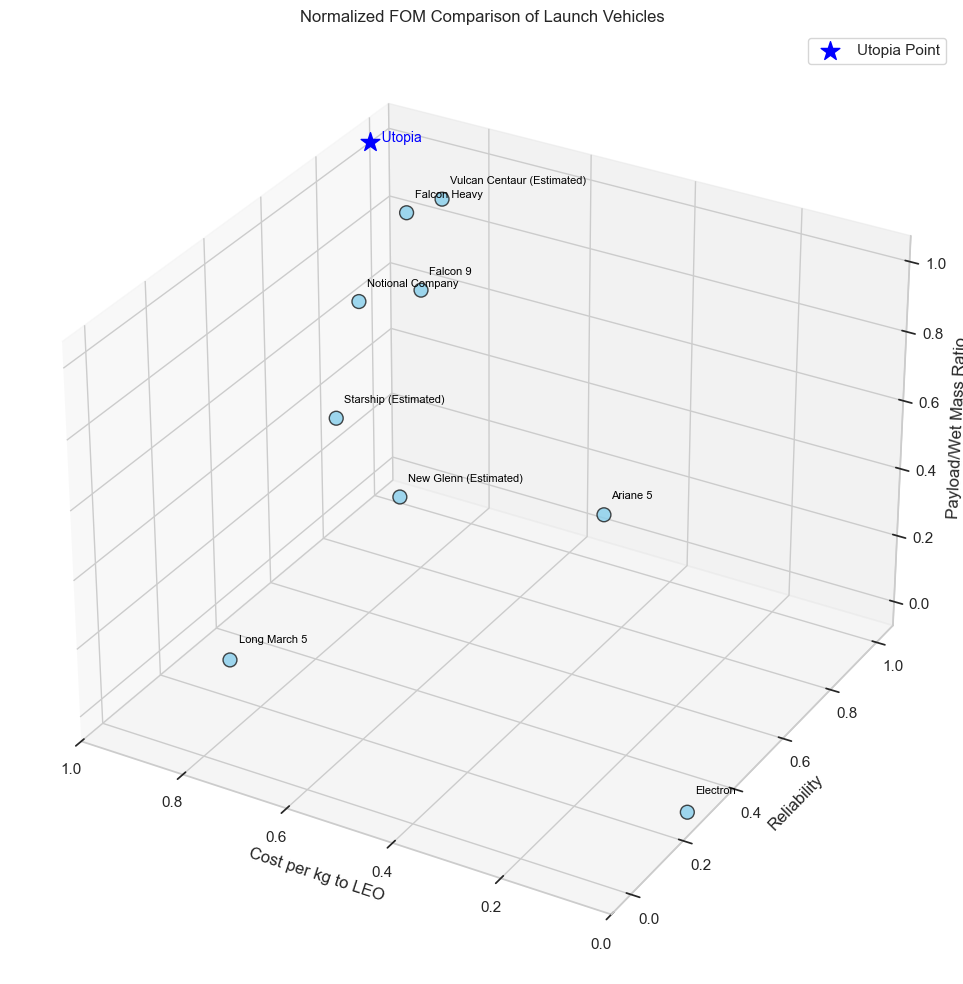
While the dataset is still relatively sparse, the notional company appears well positioned to be a fast follower of the industry standard.
When considering normalized values, it appears that the FOM with the greatest disparity between systems (thereby the one most positioned for improvement) is payload to mass ratio. We use this information to inform the R&D goals and timelines later in this roadmap.
¶ 7. Technical Model: Morphological Matrix and Tradespace
Note: This section is meant to be added as an addition to the content on the existing 1LV roadmap.
7.1 Technical Model
The first principle equation for all launch vehicles is Tsiolkovsky’s rocket equation, which contains structural and wet mass. Ve is the exhaust velocity, and mo and mf are the initial and final masses of the object as shown in Equation 2. This can be rewritten to include Isp since exhaust velocity is equivalent to Isp multiplied by go as shown in Equation 3. This is shown in equation 3 below.


This can then be rewritten in terms of the payload mass fraction by breaking the final mass fraction into the payload (mp) and structure (ms) mass. This shows the payload to mass Figure of Merit directly in Equation 4.

This can be written as the payload to mass ratio as P and the structure to mass ratio as S, shown in Equation 5.

Using these equations the sensitivity can be modelled by taking the partial derivative of each of the payload to mass ratio with respect to Isp, structure to mass ratio, and delta v. These are shown in equations 6, 7, and 8.


In this analysis, parameters were selected for Isp, Delta-V, and structural mass fraction for LEO and GEO launch cases where:
- ISP = 340 seconds (comparable to BE4 engine)
- Delta-V = 9.4km/s (LEO case) and 13.2 km/s (GEO case)
- Mass Fraction = 5% (approximately comparable to Falcon 9)

For this figure of merit, payload fraction is most sensitive to Isp and Delta-V, and slightly less sensitive to structural mass. However, in practice 1% increases in Isp can be quite difficult to achieve, and a 1% decrease in structure mass can yield a ~7% increase in payload mass for a system like the Falcon 9. Isp and Delta V both have equal impact, which is represented mathematically in the gradients above. In addition, it was evident that for a GEO case, the figure of merit is overall less sensitive to changes compared to launches in the LEO regime. This can be mathematically explained since the amount of fuel required to launch into a GEO orbit is significantly more than a LEO case, which results in the sensitivities being far less. Still, there is certainly merit in targeting these figures of merit, but it certainly makes more of an impact in the LEO orbit regime.
The percent reusability was also considered for this analysis.
While a more comprehensive mathematical model might include probability of survival for certain components, we will keep the representation more abstract for purposes of this course. The reusability of the system is simply the ratio of the dry mass and the reused mass.

To account for the efficiency of refurbishment, since elements like structural tiling, paint, and others must be rebuilt regardless if recovered, the mass that is reused can be written in terms of efficiency, epsilon, and structural fraction S.

This allows the reusability to be written in terms of refurbishment efficiency and structural mass fraction.

The partial derivatives for this example for number of cycles, efficiency, and structural mass fraction are:


With a nominal efficiency of 90% and structure mass fraction of 5%, a normalized tornado chart can be computed.

Here it can be seen that increases in structure mass fraction results in slightly more sensitivity compared to recovery efficiency.
7.2 Morphological Matrix
The below morphological matrix provides potential configuration options based on the technical model presented above. Of note, compared to previous generations, there has been a marked shift to methane/LOX engines, several new launch site locations, and an increase in reusability. These represent broad trends in design choices and helps supplement the FOM charts presented above.
| Attribute / LV |
Option 1 |
Option 2 |
Option 3 |
Option 4 |
Option 5 |
Option 6 |
| Stage 1 Propellant |
KEROLOX |
LOX/LH2 |
LOX/CH4 |
UDMH/N2O4 |
Solid |
|
| State 2 Propellant |
KEROLOX |
LOX/LH2 |
LOX/CH4 |
UDMH/N2O4 |
Solid |
None |
| Stage 3 Propellant |
KEROLOX |
LOX/LH2 |
LOX/CH4 |
UDMH/N2O4 |
Solid |
None |
| Stage 4 Propellant |
KEROLOX |
LOX/LH2 |
LOX/CH4 |
UDMH/N2O4 |
Solid |
None |
| Launch Type |
Surface launch |
Air Launch |
||||
| Launch Site |
KSC |
Korou |
Baikonour |
Launch Complex 1 |
Starbase |
Air Launch |
| Reusability |
Yes |
No |
Partial |
| Attribute / LV | Falcon Heavy | Electron | Vulcan Centaur | New Glenn | Starship |
| Stage 1 Propellant | KEROLOX | KEROLOX | LOX/CH4 + Solid | LOX/CH4 | LOX/CH4 |
| State 2 Propellant | KEROLOX | KEROLOX | LOX/LH2 | LOX/LH4 | LOX/CH4 |
| Stage 3 Propellant | KEROLOX | None | None | None | None |
| Stage 4 Propellant | None | None | None | None | None |
| Launch Type | Surface Launch | Surface Launch | Surface Launch | Surface Launch | Surface Launch |
| Launch Site | KSC | Launch Complex 1 | KSC | KSC | Starbase |
| Reusability | Yes | Partial | No | Yes | Yes |
¶ 8. Financial Model: Technology Value (𝛥NPV)
The following section describes a financial model for reusable launch vehicles and cost-realistic NPV analysis for the Starship super-heavy launch vehicle. As previously described in section 4, the cost per launch of a reusable launch system over the vehicle's lifetime is:

For this exercise, the following cost assumptions were made. These were developed from limited publicly available data in addition to cost estimation models available at NASA and ESA. For the purpose of this investigation the most conservative numbers were used.
|
Cost Assumption |
|
| Development Costs | $10000 M |
| Engine Costs | $30 M |
| Construction Costs | $35 M |
| Raw Material Costs | $5 M |
| Fuel Tank Costs | $20 M |
| Fuel Costs | $1.25 M |
| Avionics Costs | $5 M |
| Refurbishment Costs | $10 M |
| Refurbishment Time | 3 Months |
| Discount Rate | 15% |
Additional performance assumptions were made for the number of reuses and the expense charged to the customer. These represent cost per kg to LEO of $1333/kg. Initially, a figure found online for a cost of $50M per launch was used, however given the cost assumptions above this was not seen as reasonable. Instead, a $200M initial cost per launch followed by a 5% cost reduction per year was modelled along with a growth rate of 5 launches per year, with launches spaced evenly by month.
|
Performance Assumptions |
|
| Payload to LEO | 150000 kg |
| Design Lifecycle (Worst Case) | 10 launches |
| Design Lifecycle (Best Case) | 75 launches |
| Charged Cost Per Launch (Initial) | $200 M |
| Cost Per Year Discount | 5% |
| Launches Per Year (Initial) | 5 |
| Launch Per Year Growth | 5 per year |
To compute NPV cases were made for 10 and 75 launches per vehicle using the revenue cases described above. These scenarios were computed over a 10 year time horizon with 8 years of development starting in 2020 and a linear growth of 2 launches per year. For simplicity, the expense of a new vehicle was only incurred when the vehicle extended past its design lifecycle. No failure rate was assumed or predicted.
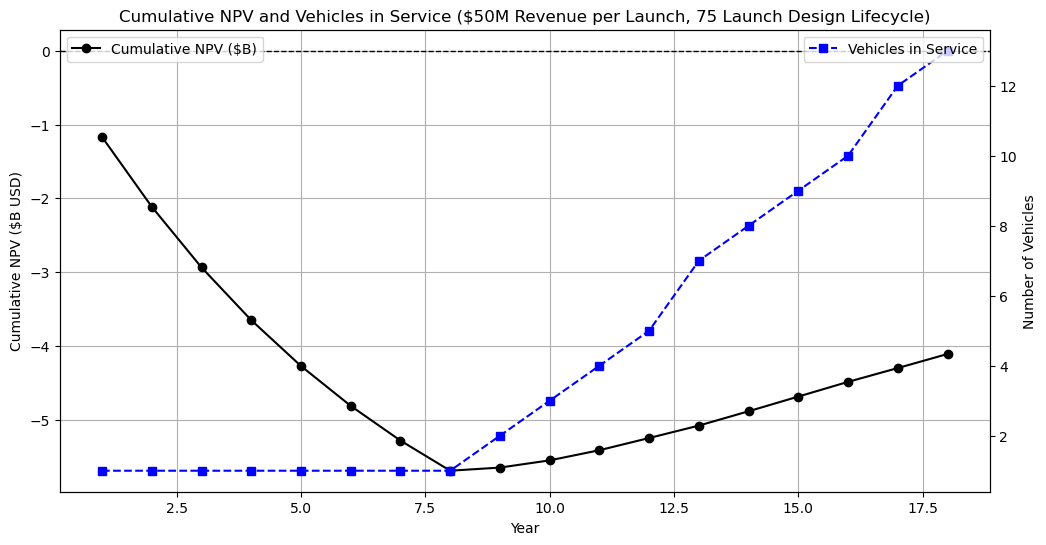
An initial example using $50M per launch with 75 reuses per vehicle is shown below.
The results of a $250M initial cost followed by a 5% year-over-year reduction in cost are shown below.
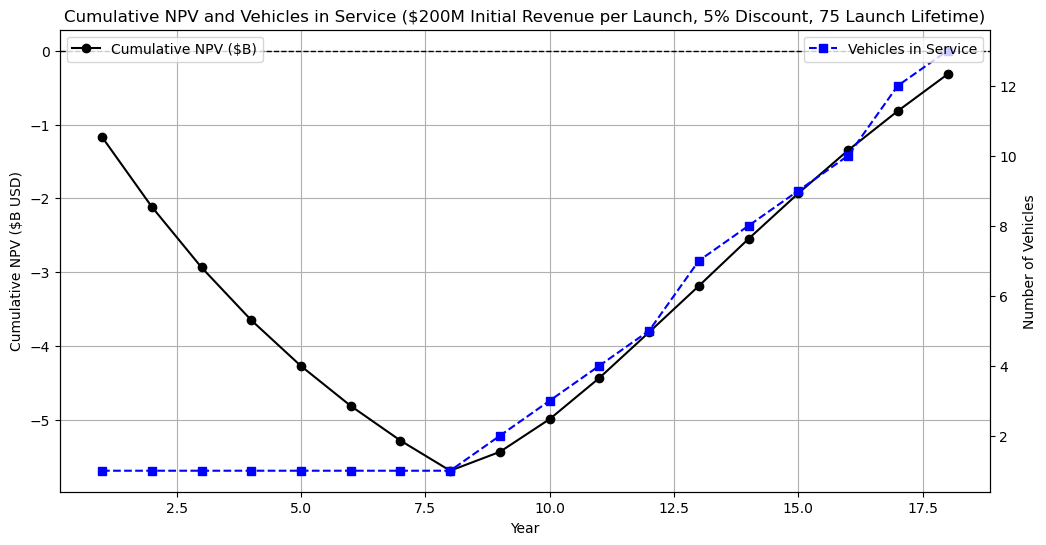
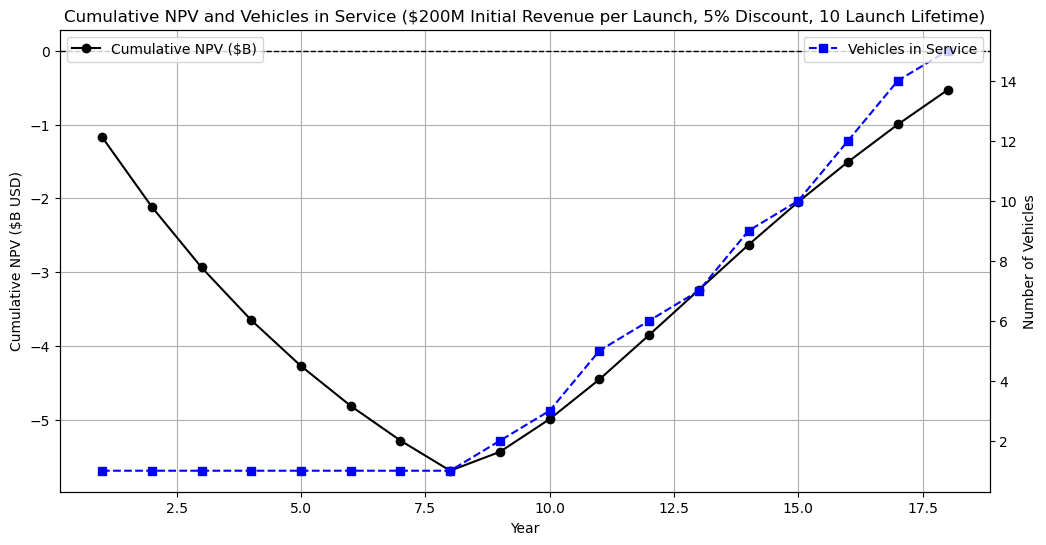
The model shows interesting results. Firstly, given the initial assumptions, charging 100x the idealized Starship launch cost of $2M, the system does not obtain a positive cumulative NPV until over a decade after initial commercial use.
Having a design lifecycle of 75 or 10 launches makes little difference when only launching a handful of rockets each year (given the growth rate used) and a nominal 3 month refurbishment time. This result leads us to put less focus on the lifecycles FOM when creating our R&D projects list and timeline, as the marginal utility is lower than for other identified areas for improvement in this roadmap. We recommend instead the prioritization of refurbishment time to increase the number of annual launches without excessively increasing initial costs.
In addition to financials, this gives interesting insight into the sensitivity of other parameters. To increase profitability, a faster refurbishment time and reduced construction costs are needed across the board if a goal of under $1000/kg/LEO is desired.
¶ 9. List of R&D Projects and Prototypes
We identify two key priorities for improvement based on the above analysis. Per our tornado chart, engine Isp has significant impact on the payload to mass ratio and deliverable payload to LEO. We thus select an R&D project to improve engine efficiency and thus payload to mass ratio.
In our financial analysis, we determine that reaching the stated goal of less than $1000/kg to LEO will be difficult to attain without reducing costs. Accordingly, we highlight two R&D projects to reduce costs of launches by introducing modular components and reducing costs incurred in manufacturing.
| R&D Topic | FOM Target(s) | Description | Target DSM Component(s) |
| 1A - Modular Engine Design | Cost to LEO/kg | A modularized engine design will enable faster and cheaper replacement, enabling less cost per launch. | 3LFE, 4FP, 4FT, 4FPB, 4OP, 4OT, 4CT, 5CC, 5CAM |
| 1B - Increased Engine ISP | Payload to Mass Ratio, Payload to LEO | A small increase in Isp will yield a large payload increase for the same orbit, enabling more payload to LEO and a more favorable payload to mass ratio. | 3LFE, 4FP, 4FT, 4FPB, 4OP, 4OT, 4CT, 5CC, 5CAM |
| 1C - Non-reusable Manufacturing | Cost to LEO/kg | Taking all practical steps to reduce costs to manufacture non reusable components will further reduce launch costs. | 3LFE, 3SS, 3PA, 4MA |
These projects are targeted to two of our key FOMs (cost/kg to LEO, and payload to mass ratio). Encouragingly, these specific projects mimic the development trajectories of other participants in the LV market space. The Falcon-9 launch vehicle's first engine, the Merlin 1C, had a vacuum Isp of 304s, while its immediate successor in the Merlin 1D had a vacuum Isp of 310s. This is a positive indicator that early-stage LV providers - such as our notional company - can see gains through Isp improvements.
The modular engine design is a key priority for cost reduction by reducing the time and labor costs associated with refurbishment after launch. This will enable a faster rate of launches, increasing the revenue from launches without incurring additional upfront costs associated with the development of an additional launch vehicle. Replacement costs themselves will also be lowered, contributing further towards the goal of lowered cost/kg LEO.
Project budget, schedules, and TRL objectives are shown below:
| R&D Topic | Total Budget | Execution Years | TRL at Start | TRL at End |
| 1A - Modular Engine Design | $500M+ | 2025-2030 | 6 | 8 |
| 1B - Increased Engine ISP | $300M | 2025-2035 | 4 | 6 |
| 1C - Non-reusable Manufacturing | $200M | 2025-2030 | 5 | 7 |
A Gannt chart is shown below to represent the proposed schedule:
| Project | 2025 | 2026 | 2027 | 2028 | 2029 | 2030 | 2031 | 2032 | 2033 | 2034 | 2035 |
|---|---|---|---|---|---|---|---|---|---|---|---|
| 1A - Modular Engine Design | |||||||||||
| 1B - Increased Engine ISP | |||||||||||
| 1C - Non-reusable Manufacturing |
The engine ISP timeline is validated again by the SpaceX Merlin engine improvement process. Merlin 1C was first flown on a mission in 2008, and first powered a Falcon 9 in 2010. Merlin 1D (with its notably improved Isp) first flew in 2013. Between 2016 and 2018, significant work was done on the Merlin engine with the specific goal of improving engine thrust. SpaceX reported an increased payload capacity of up to 22 tons as a result of this development. Our 1B project timeline of 10 years for increased engine ISP can thus be considered reasonable, particularly as we are not aiming to develop an engine from scratch but rather improve an existing one.
We might also anticipate some overlap and thus diminishing returns between projects 1A and 1C - as the engine components are improved and modularized, we can anticipate some improvement in their associated manufacturing costs. This motivates an assumed shorter timeline for these two projects; we would expect to cultivate knowledge sharing between the two project groups and thus improve their overall efficacy and efficiency.
¶ 10. Key Publications, Presentations and Patents
Note: The below publications and patents are intended to be combined with those listed on the current 1LV roadmap.
¶ 10.1 Publications & Presentations
There are many publications in literature which discuss launch vehicle optimization. We describe here a non-exhaustive subset which help to validate our FOM selections, streamline the prioritization process, and guide our R&D project goals.
“Collaborative Approach to Launch Vehicle Design” was published in 2012 by authors from Stanford University and NASA Langley and is a very well cited example of launch vehicle design optimization. In this paper, a collaborative optimization approach was used with 95 parameters and 16 constraints, and useful insights were provided about optimal launch vehicle design. For a more comprehensive overview of potential design optimization methods for launch vehicles, “A survey of multidisciplinary design optimization methods in launch vehicle design” gives a useful overview of optimization methods specific to launch vehicles. While not exhaustive, these papers give a good introduction to launch vehicle design optimization and were useful for us in the R&D project selection process.
There are also several papers that discuss autonomous landing operations for reusable launch vehicles. While many of these are targeted towards the autonomous landing of spaceplanes such as the Space Shuttle, the same principles apply to reusable first-stage vehicles like the Falcon 9. “On-line robust trajectory generation on approach and landing for reusable launch vehicles” was published in 2009 and discusses control methods for the landing of reusable launch vehicles. Again this is not an exhaustive listing of literature on the topic, however this is a standout paper that has numerous citations and it potentially used on modern launch systems. This study also highlights the significance of reusability as a cost-reducing measure and key priority for launch providers, validating its selection as one of our key FOMs.
Another key publication which is slightly more recent is “Comprehensive study of the international space launch industry: Programmatic analysis and technical failures” published in 2025. This study comprehensively evaluates programmatic causes for reliability issues (launch vehicle failures) and places these failures contextually within the system as a whole. They identify the key drivers of launch vehicle failures to date (propulsion system failures being the leading cause, with single-engine upper-stage being the most common failure configuration). This analysis identifies individual subsystem technologies (the feed system and turbopump) where improvements are likely to have the most substantial impact on long-term reliability for the launch vehicle industry as a whole. This study is useful in identifying key components of the launch vehicle system which can be improved through design and manufacturing gains, providing focal points for our selected R&D projects.
¶ 10.2 Patents
Patents relevant to launch vehicles generally fall under cooperative patent classification (CPC) label B64G – Cosmonautic Systems. They are considered part of B64G 1/002 – launch systems that has subcategories for air launch, reusable launch rockets and boosters, and arrangement of launch rockets or boosters. At time of writing, there are approximately 6700 patents, however that number may miss certain historical patents that have not been converted electronically.
The first patent we selected was filing US7832687B1 for “On-orbit storage, plane change, and injection to final orbit of space vehicles”. This patent was filed by Lockheed Martin Corporation and relates to the payload connecter system and describes a method to “stack” multiple space vehicles on top of each other to allow for spacecraft to be deployed from the same rocket in different orbits. While this is not an accomplishment today, in 2009 this was a novel thought and this patent, amongst others that describe deployment mechanisms, allows greater flexibility for launch vehicles to deploy spacecraft. Especially given the large size of emerging reusable vehicles like Starship and New Glenn, the ability to deploy to multiple orbits in the same launch is important. This patent, while active at one point, has since expired and has not been renewed.
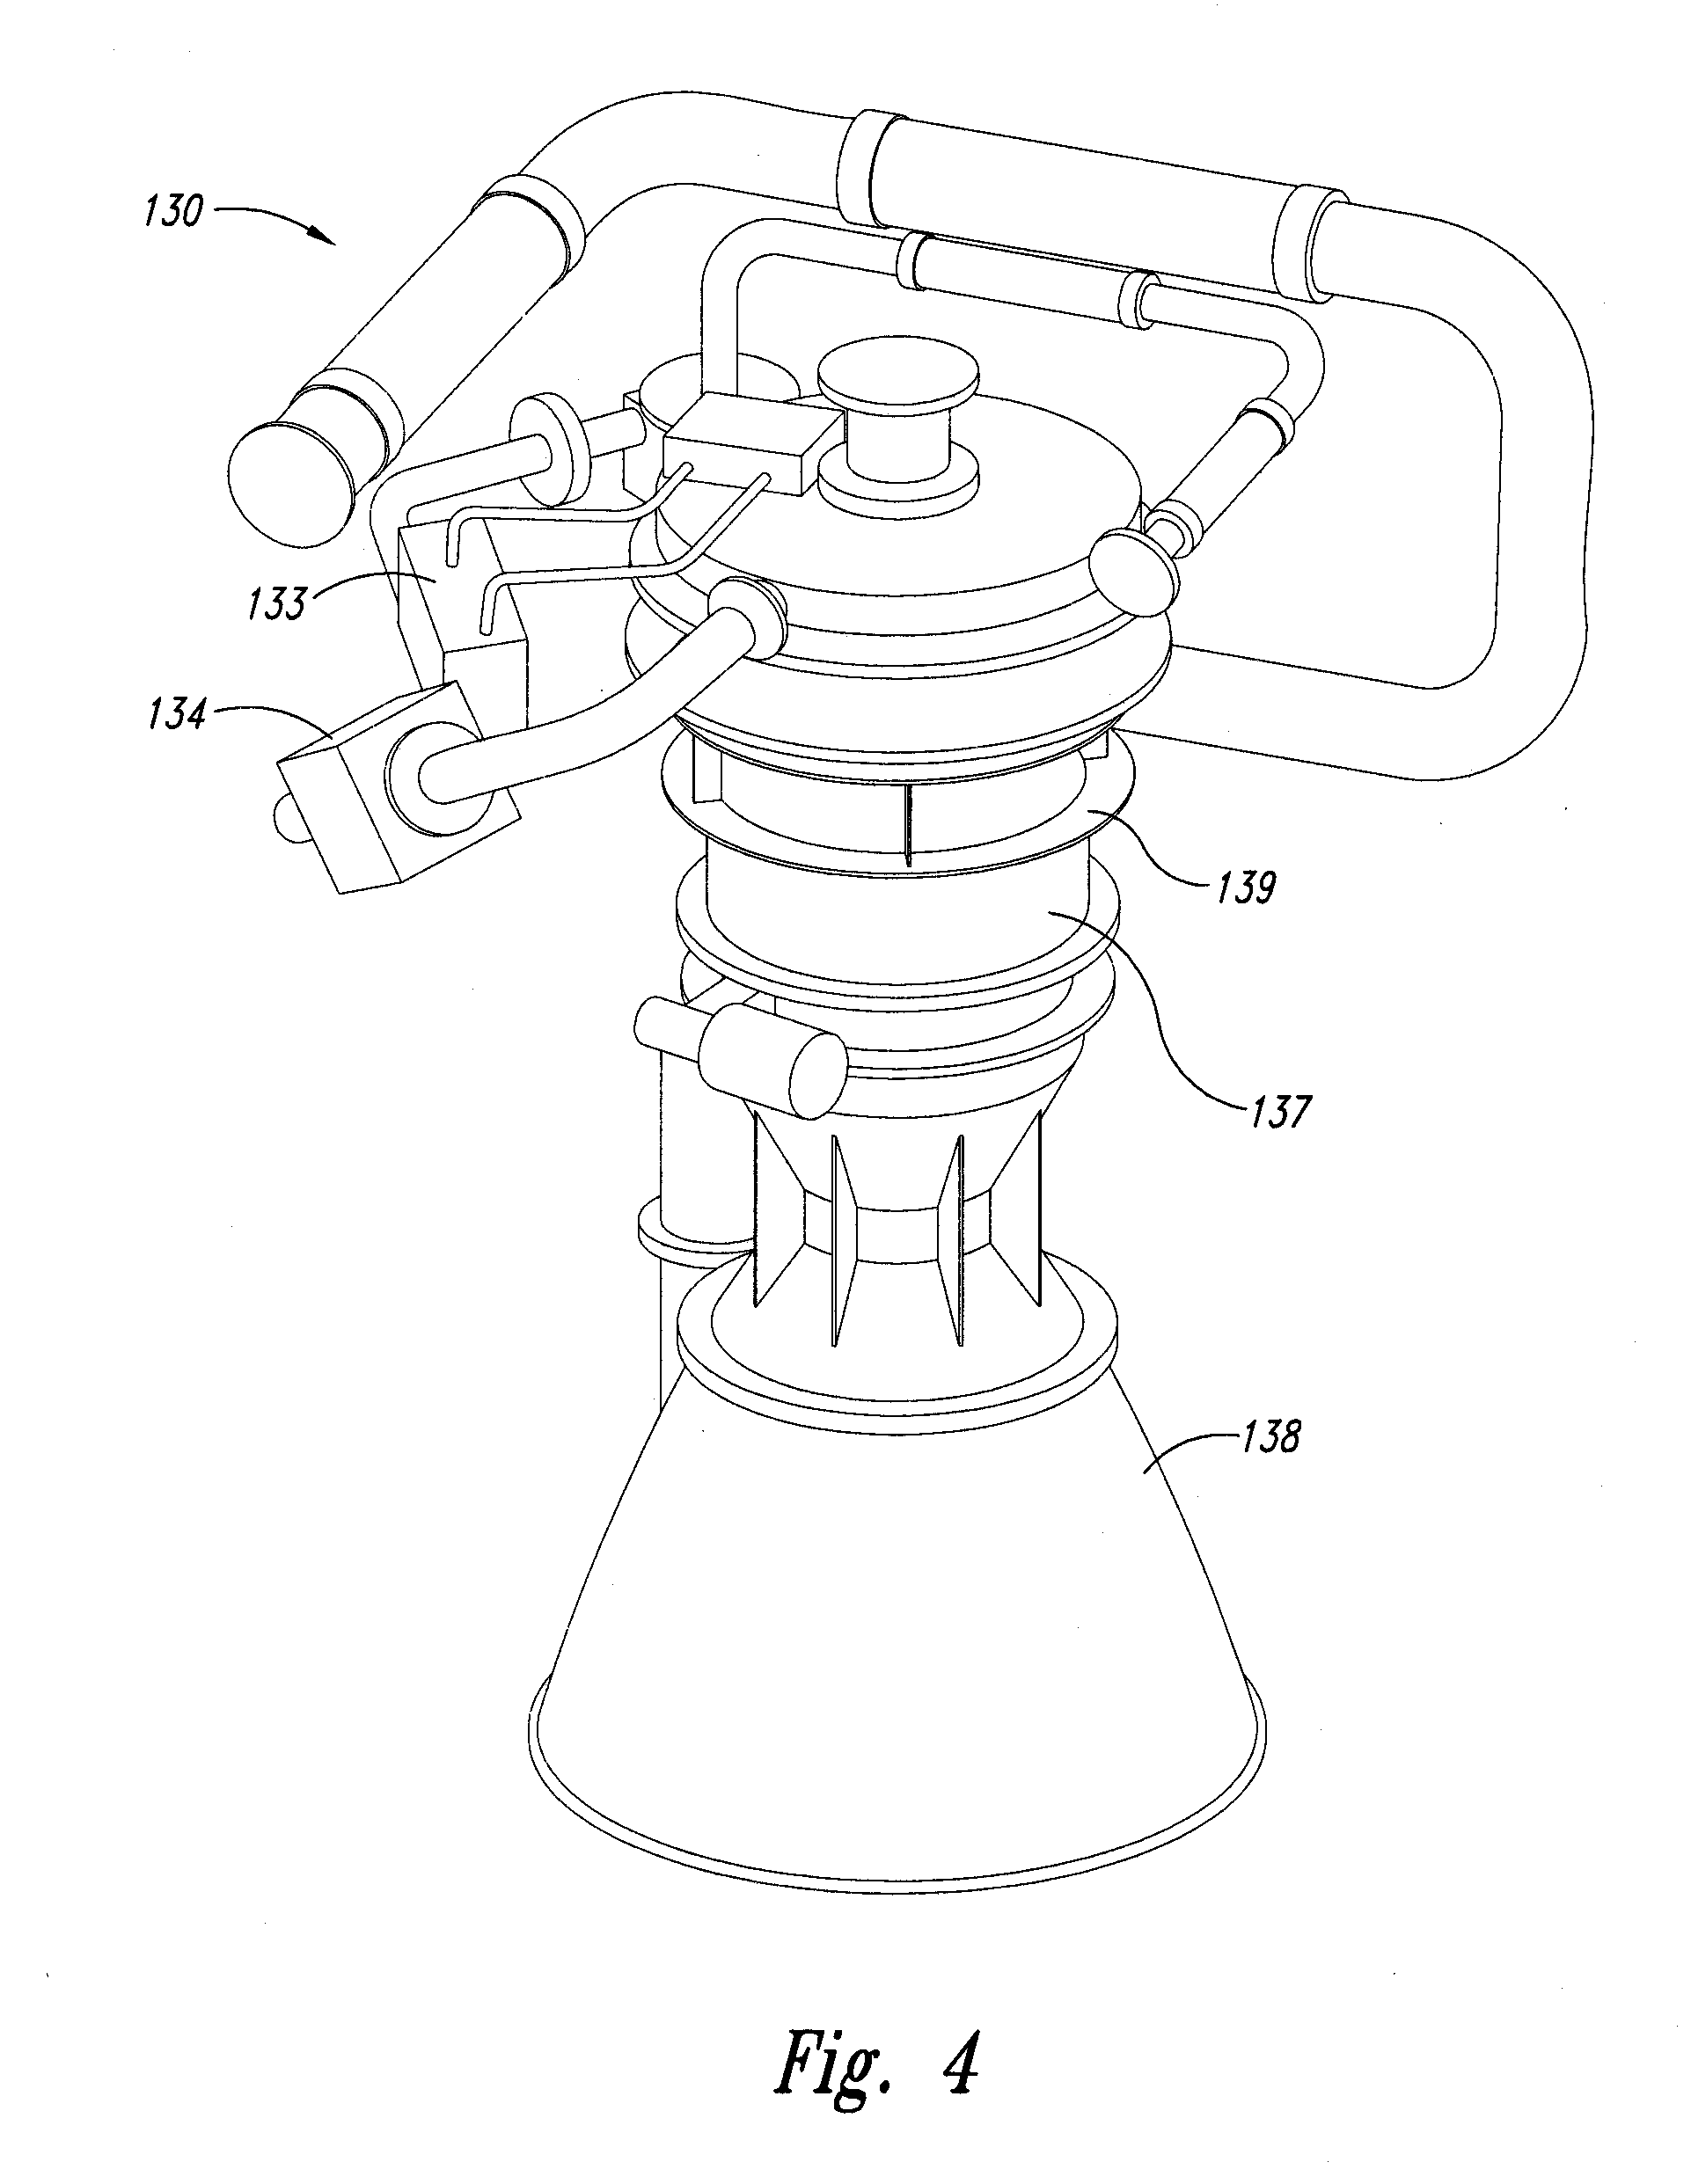
Another highly relevant patent is US20100326045A1 for “Multiple-use rocket engines and associated systems and methods”. This patent was filed in 2010 from Blue Origin. At the time of filing modern reusable rockets were beginning to gain major traction, and Blue Origin was at their initial phases of developing rocket engines such as the BE-4. This patent describes how modularity can be used to reduce refurbishment time and improve reliability of rocket engines that are intended to be reused. This relates to several figures of merit, and shows how the technology of reusable launch vehicles has progressed. The noted improvements relating to engine modularity and refurbishment time directly correlate to our final selected R&D goals. This patent, while filed, was eventually abandoned by Blue Origin after conflict with SpaceX.
Another patent of interest is US11305895B1 “Self-preserved amphibious landing of space hardware”. This patent was filed in 2020 by United Launch Alliance LLC and describes a way to recover first stage launch hardware. We found this patent interesting because United Launch Alliance has typically only pursued expendable vehicles, but this filing potentially gives the ability to reuse components of expendable launch vehicles, again improving the figure of merit of reusability. The patent is currently active and the expiration date was recently extended.
¶ 11. Technology Strategy Statement
The target technology to build a reusable launch system capable of delivering 150,000 kg to LEO at a cost of $300/kg by 2030 will be a challenge. Without significant R&T investment, the cumulative net present value will not be profitable within 10 years of first commercial use unless the cost per kg to LEO is significantly greater than first advertised. To address this, several R&D efforts can be underway to attempt to reach this goal. Due to the long development times and existing launch vehicle infrastructure, these efforts will run in parallel. Firstly, engine modularization will be developed to reduce engine refurbishment and replacement costs, thereby reducing a key recurring expense that must be lowered to meet the $300/kg/LEO goal. Next, the efficiency of the engine will be improved by increasing Isp to attain a better payload to mass ratio, requiring less fuel to launch the same payload, thereby enabling the ambitious 150,000kg per launch. Lastly, manufacturing efficiency improvements will be prioritized to further reduce refurbishment and production costs to reach the $300/kg/LEO goal.
¶ 12. Roadmap Maturity Assessment (optional)
¶ 13. References
[1] Ansar, A., & Flyvbjerg, B. (2022). How to solve big Problems: Bespoke versus platform Strategies. arXiv (Cornell University). https://doi.org/10.48550/arxiv.2206.08754
[2] Balesdent, M., Bérend, N., Dépincé, P., & Chriette, A. (2011). A survey of multidisciplinary design optimization methods in launch vehicle design. Structural and Multidisciplinary Optimization, 45(5), 619–642. https://doi.org/10.1007/s00158-011-0701-4
[3] Braun, R. D., Moore, A. A., & Kroo, I. M. (1997). Collaborative approach to launch vehicle design. Journal of Spacecraft and Rockets, 34(4), 478–486. https://doi.org/10.2514/2.3237
[4] Das, A., Vichnin, H. H., Achee, B. B., & Corp, L. M. (2004, August 24). US7832687B1 - On-orbit storage, plane change, and injection to final orbit of space vehicles - Google Patents. https://patents.google.com/patent/US7832687B1/en?q=(B64G1%2f002)&oq=B64G1%2f002&peid=64132e32fb608%3Ab6%3A173fbc71
[5] Jiang, Z., & Ordóñez, R. (2009). On-line robust trajectory generation on approach and landing for reusable launch vehicles. Automatica, 45(7), 1668–1678. https://doi.org/10.1016/j.automatica.2009.03.017
[6] Mennatallah M. Hussein, Daiki Terakado, Olivier L. de Weck, Comprehensive study of the international space launch industry: Programmatic analysis and technical failures, Acta Astronautica, Volume 234, 2025, Pages 676-689, ISSN 0094-5765, https://doi.org/10.1016/j.actaastro.2025.03.015.
[7] Lai, G., & Llc, B. O. (2009, February 13). US20100326045A1 - Multiple-use rocket engines and associated systems and methods - Google Patents. https://patents.google.com/patent/US20100326045A1/en?q=(B64G1%2f002)&oq=B64G1%2f002&page=4
[8] Coyne, B. M., Lampariello, J., & Wehrwein, D. A. (2018, February 21). US11305895B1 - Self-preserved amphibious landing of space hardware - Google Patents. https://patents.google.com/patent/US11305895B1/en?q=(B64G1%2f002)&page=24
[9] Berger, Eric [@SciGuySpace] (May 10, 2018). "Musk: Merlin rocket engine thrust increased by 8 percent, to 190,000 lbf" (Tweet) – via Twitter.
‘Falcon User’s Guide'. SpaceX. Retrieved Nov. 18. 2025.
[10] Jones, H. (2018, July 8). The recent large reduction in space launch cost. https://ttu-ir.tdl.org/items/bc37e942-bf12-479c-8fc6-4711c0e270d4
[11] American Enterprise Institute - AEI. (2024, April 9). Moore’s law meet Musk’s law: The underappreciated story of SpaceX and the stunning decline in launch costs | AEI. https://www.aei.org/articles/moores-law-meet-musks-law-the-underappreciated-story-of-spacex-and-the-stunning-decline-in-launch-costs/
"Merlin section of Falcon 9 page". SpaceX. Archived from the original on July 15, 2013. Retrieved October 16, 2012.
[12] Swayne, M. (2025, May 9). Comparing Falcon Heavy vs. Vulcan Centaur. Retrieved from https://spaceinsider.tech/2025/01/20/comparing-falcon-heavy-vs-vulcan-centaur/#:~:text=ULA's%20Vulcan%20Centaur%20is%20expected,national%20security%20and%20scientific%20missions.
[13] Wang, B. (2025, January 20). SpaceX Starship roadmap lower launch costs by 100 times | NextBigFuture.com. NextBigFuture.com. Retrieved from https://www.nextbigfuture.com
[14] Wikipedia contributors. (2025f, November 30). Long March 5. Retrieved from https://en.wikipedia.org/wiki/Long_March_5
[15] Wikipedia contributors. (2025a, November 12). Vulcan Centaur. Retrieved from https://en.wikipedia.org/wiki/Vulcan_Centaur
[16] Wikipedia contributors. (2025b, November 18). Ariane 5. Retrieved from https://en.wikipedia.org/wiki/Ariane_5
[17] Wikipedia contributors. (2025c, November 26). Falcon Heavy. Retrieved from https://en.wikipedia.org/wiki/Falcon_Heavy
[18] Wikipedia contributors. (2025d, November 27). Rocket Lab Electron. Retrieved from https://en.wikipedia.org/wiki/Rocket_Lab_Electron
[19] Wikipedia contributors. (2025e, November 29). New Glenn. Retrieved from https://en.wikipedia.org/wiki/New_Glenn
[20] Wikipedia contributors. (2025g, December 2). Falcon 9. Retrieved from https://en.wikipedia.org/wiki/Falcon_9
[21] Wikipedia contributors. (2025h, December 2). SpaceX Starship. Retrieved from https://en.wikipedia.org/wiki/SpaceX_Starship