¶ Proton Exchange Membrane Hydrogen Fuel Cells
Technology Roadmap Identifier: 2HFC
¶ 1. Roadmap Overview
Proton Exchange Membrane (PEM) hydrogen fuel cells (FCs) – also sometimes referred to as polymer electrolyte membrane after their key component – output power by managing the hydrogen oxidation and oxygen reduction reactions of hydrogen (supplied as a fuel) and oxygen (from the ambient air). Hydrogen (H2) PEMFC's have a variety of potential applications, from ground vehicles (cars, trucks) to aircraft and spacecraft to stationary power. A key benefit of H2 PEMFCs is that they do not emit CO2, and thus are advantageous in terms of climate iimpact compared to some other power generators. Additionally, they maintain their efficiency at small scales.
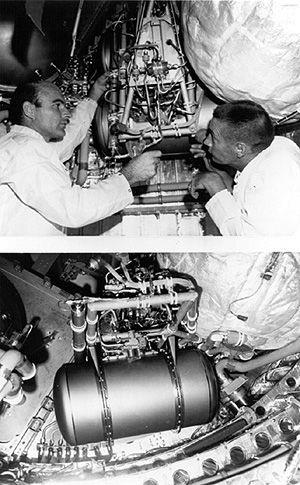
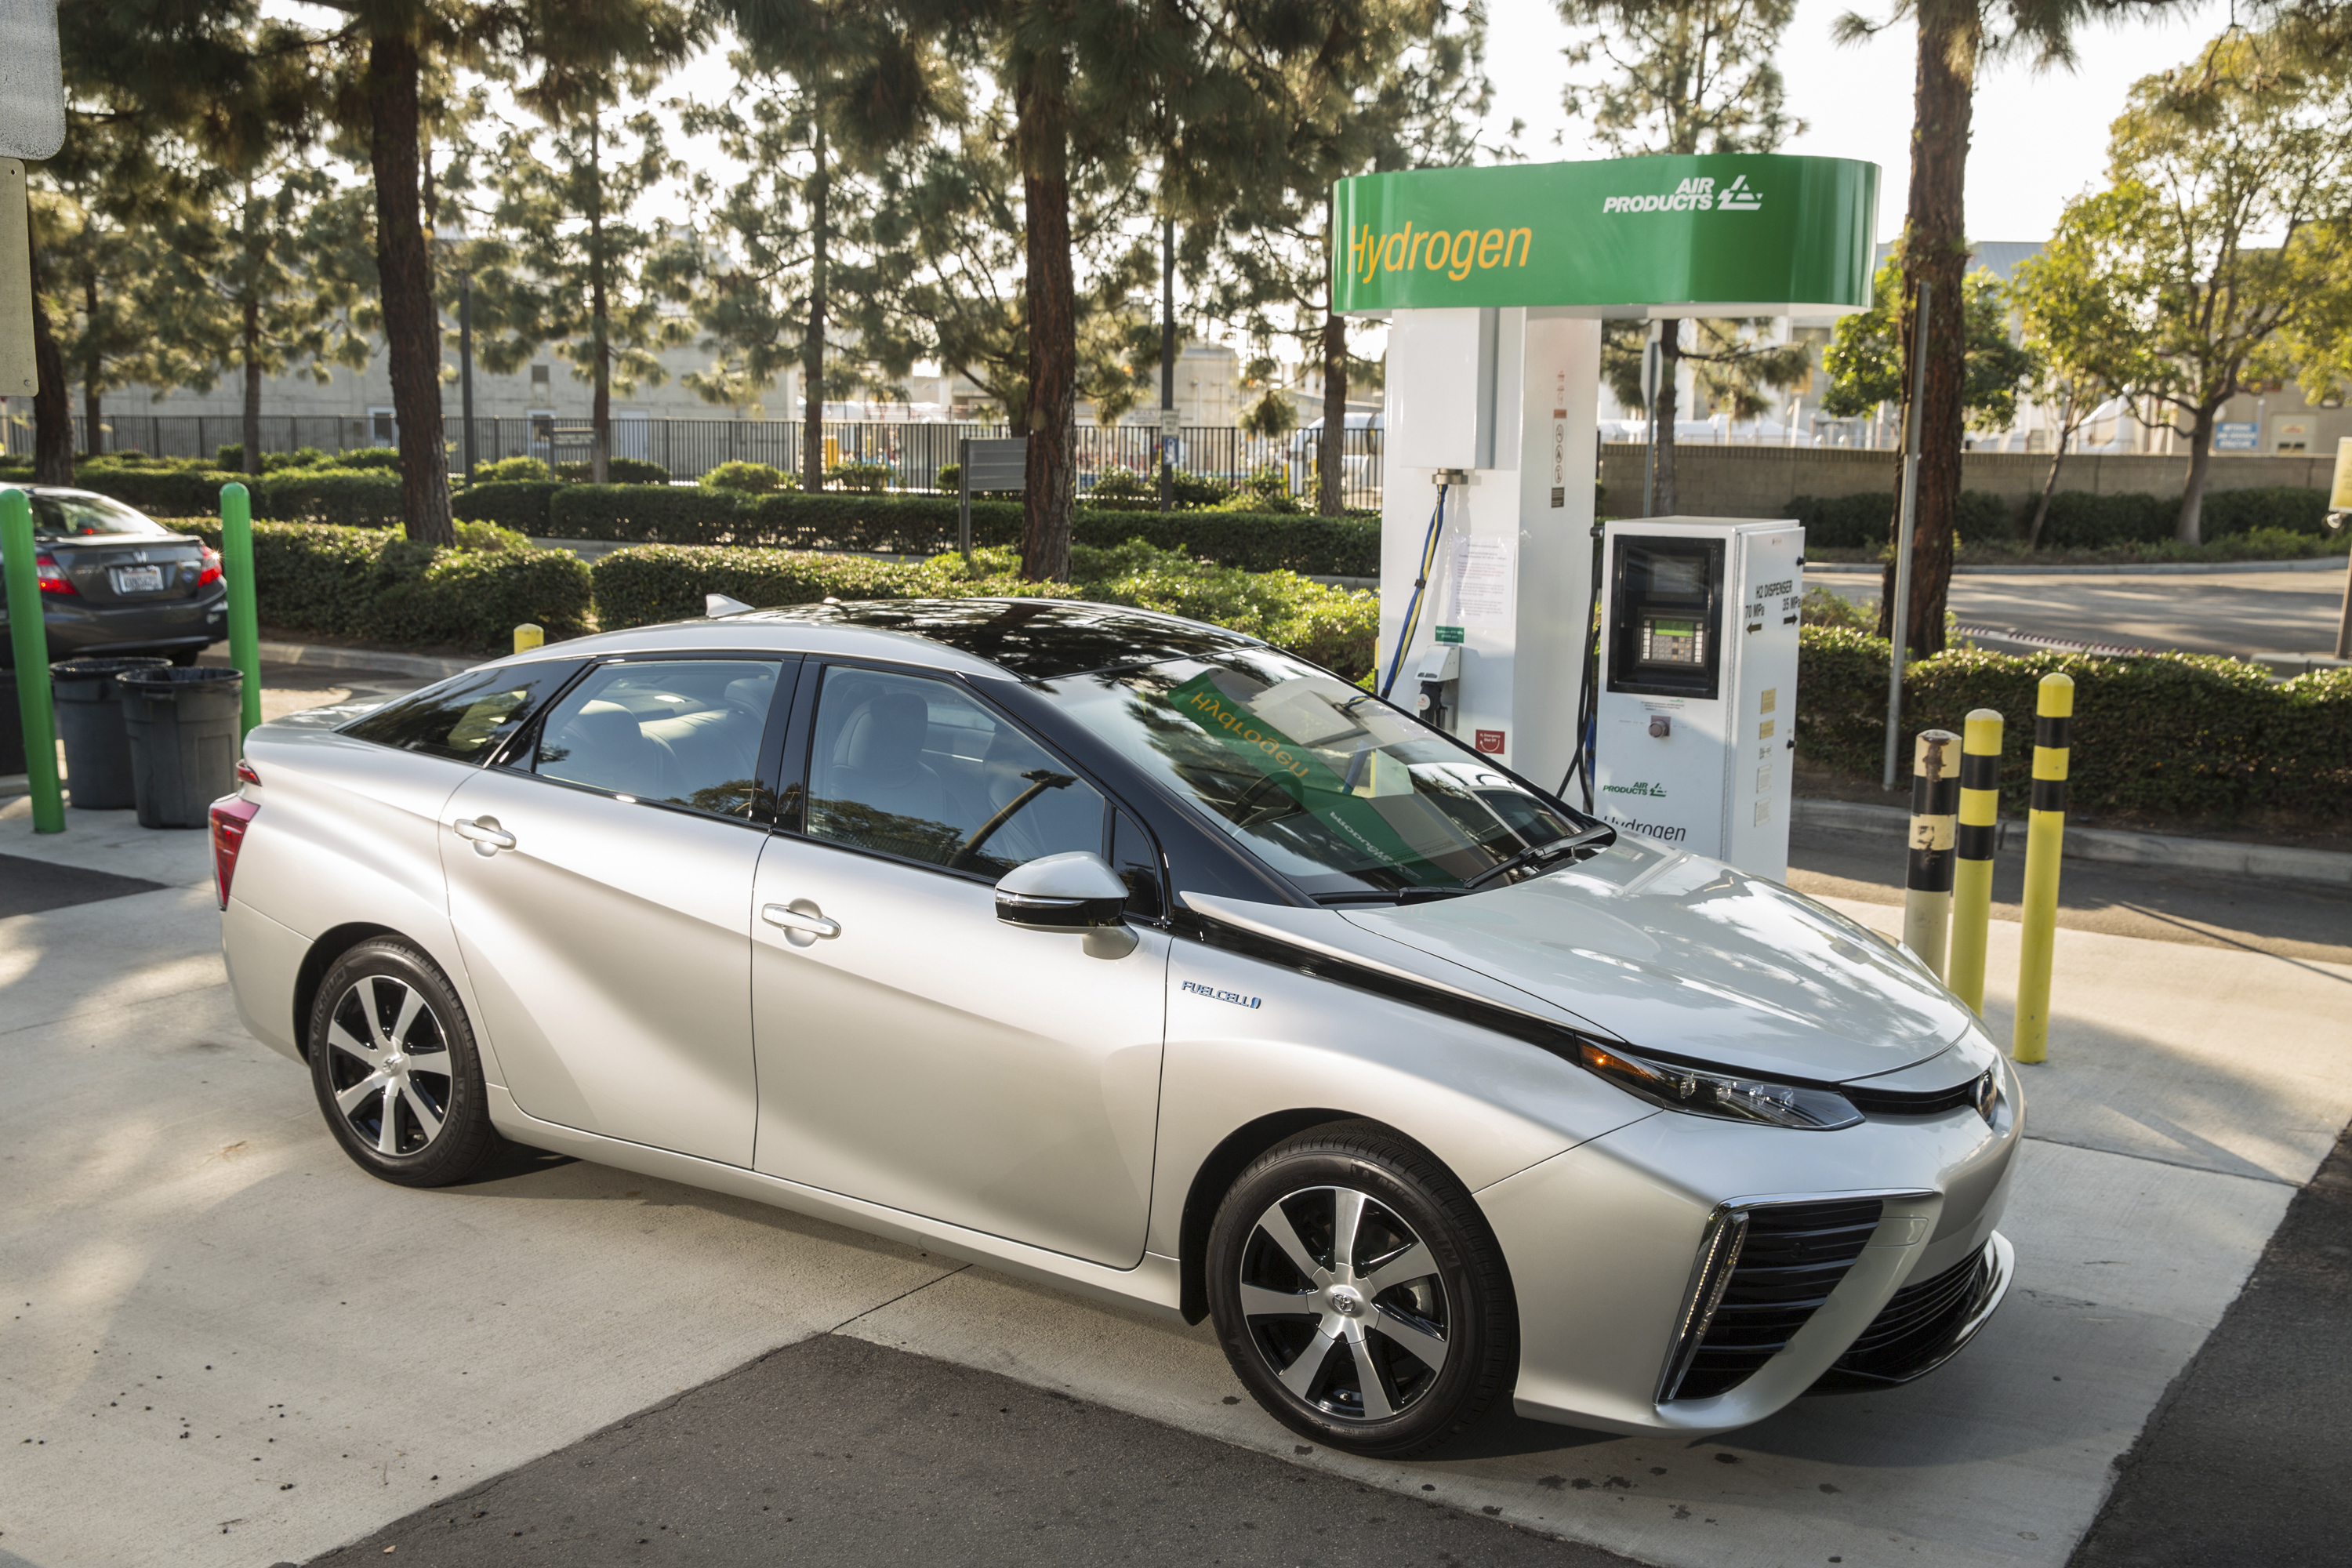
Past and present applications include auxiliary power and water generation on the Gemini spacecraft, the Honda Clarity, and the Toyota Mirai.
H2 PEMFCs are classified as Transforming Energy (E(1)) as they convert chemical energy contained in H2 and O2 to electrical energy.
In this roadmap, we take the perspective of a company developing H2 PEM fuel cell systems with integrated balance-of-plant. Our primary focus is advancing in-house H2 PEM stack technology while partnering with other companies to source balance-of-plant components such as compressors. We assume responsibility for balance-of-plant integration and packaging.
¶ 2. Design Structure Matrix (DSM) Allocation
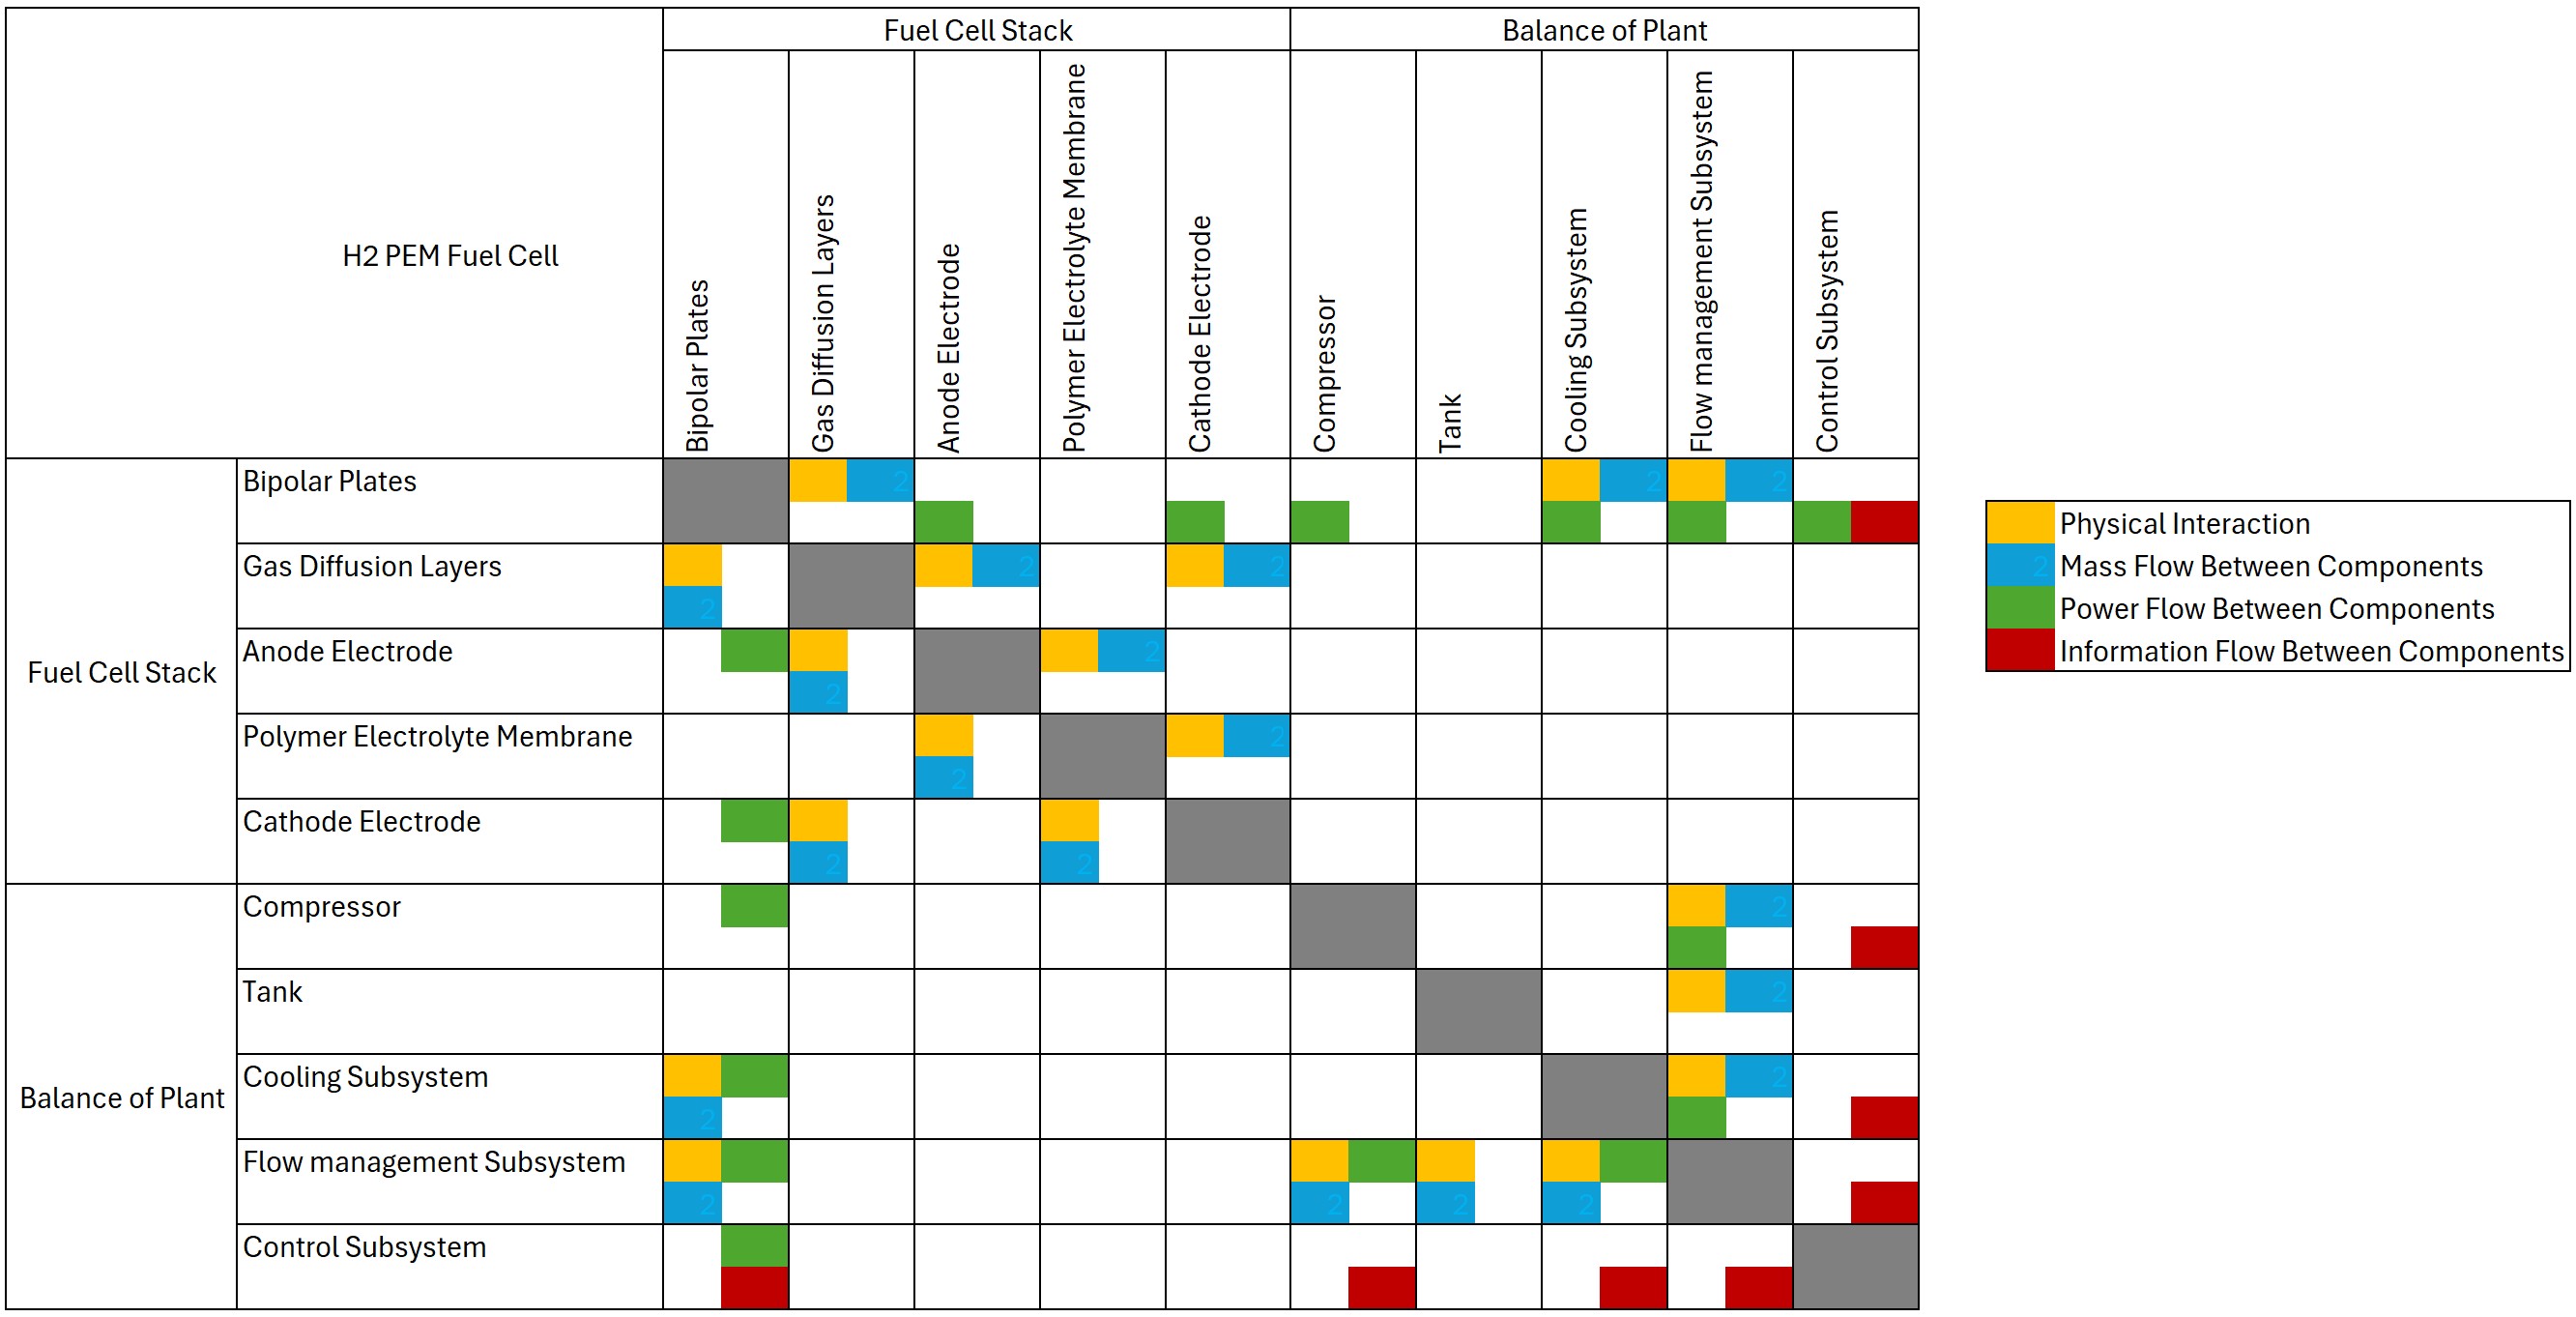
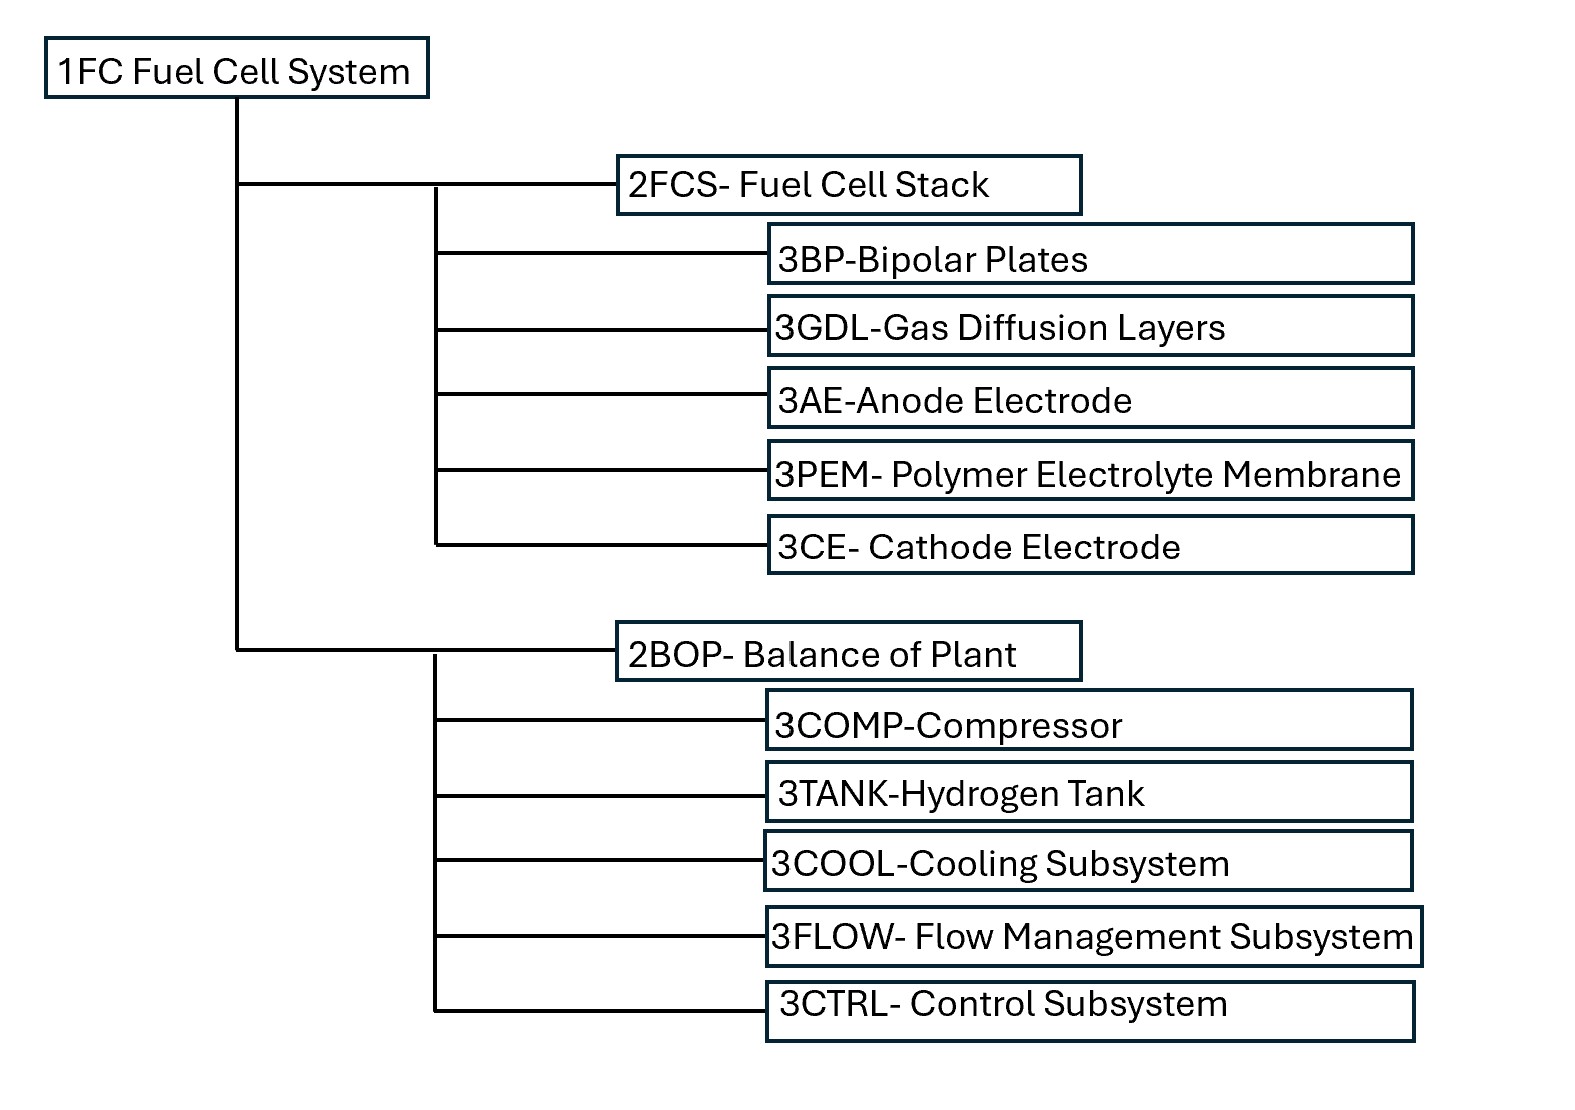
The DSM below shows how the main parts of a hydrogen proton exchange membrane (H₂ PEM) fuel cell system work together. The fuel cell stack forms the core of the system, while the balance of plant manages air supply, hydrogen delivery, cooling, and control. The matrix highlights how these components are connected through physical, mass, power, and information flows.
¶ 3. Roadmap Model using OPM
(ISO 19450)
.jpeg)
¶ 4. Figures of Merit (FOM)
| Figure of Merit | Unit | Description |
|---|---|---|
| Stack specific-power | kW/kg | Power output per unit mass of the fuel cell stack. |
| Stack power density | kW/L | Power output per unit volume of the fuel cell stack. |
| Stack Overall Efficiency | Unitless | Ratio of electrical energy output of stack to enthalpy of cell reaction. At NTP, maximum thermodynamic efficiency is 83%, which places an upper bound on overall efficiency. |
| Lifetime | hours | How long the fuel cell can operate before materials degrade or fail. |
| Cost | $/kW | How much the fuel cell costs normalized by the power output |
| System specific-power | kW/kg | Power output per unit mass of entire fuel cell system, including balance-of-plant (compressor, cooling system, etc., but excluding hydrogen tank). |
| System power density | kW/L | Power output per unit volume of entire fuel cell system, including balance-of-plant (compressor, cooling system, etc., but excluding hydrogen tank). |
| Hydrogen fuel tank mass fraction | % | Tank mass required to contain a given mass of hydrogen. |
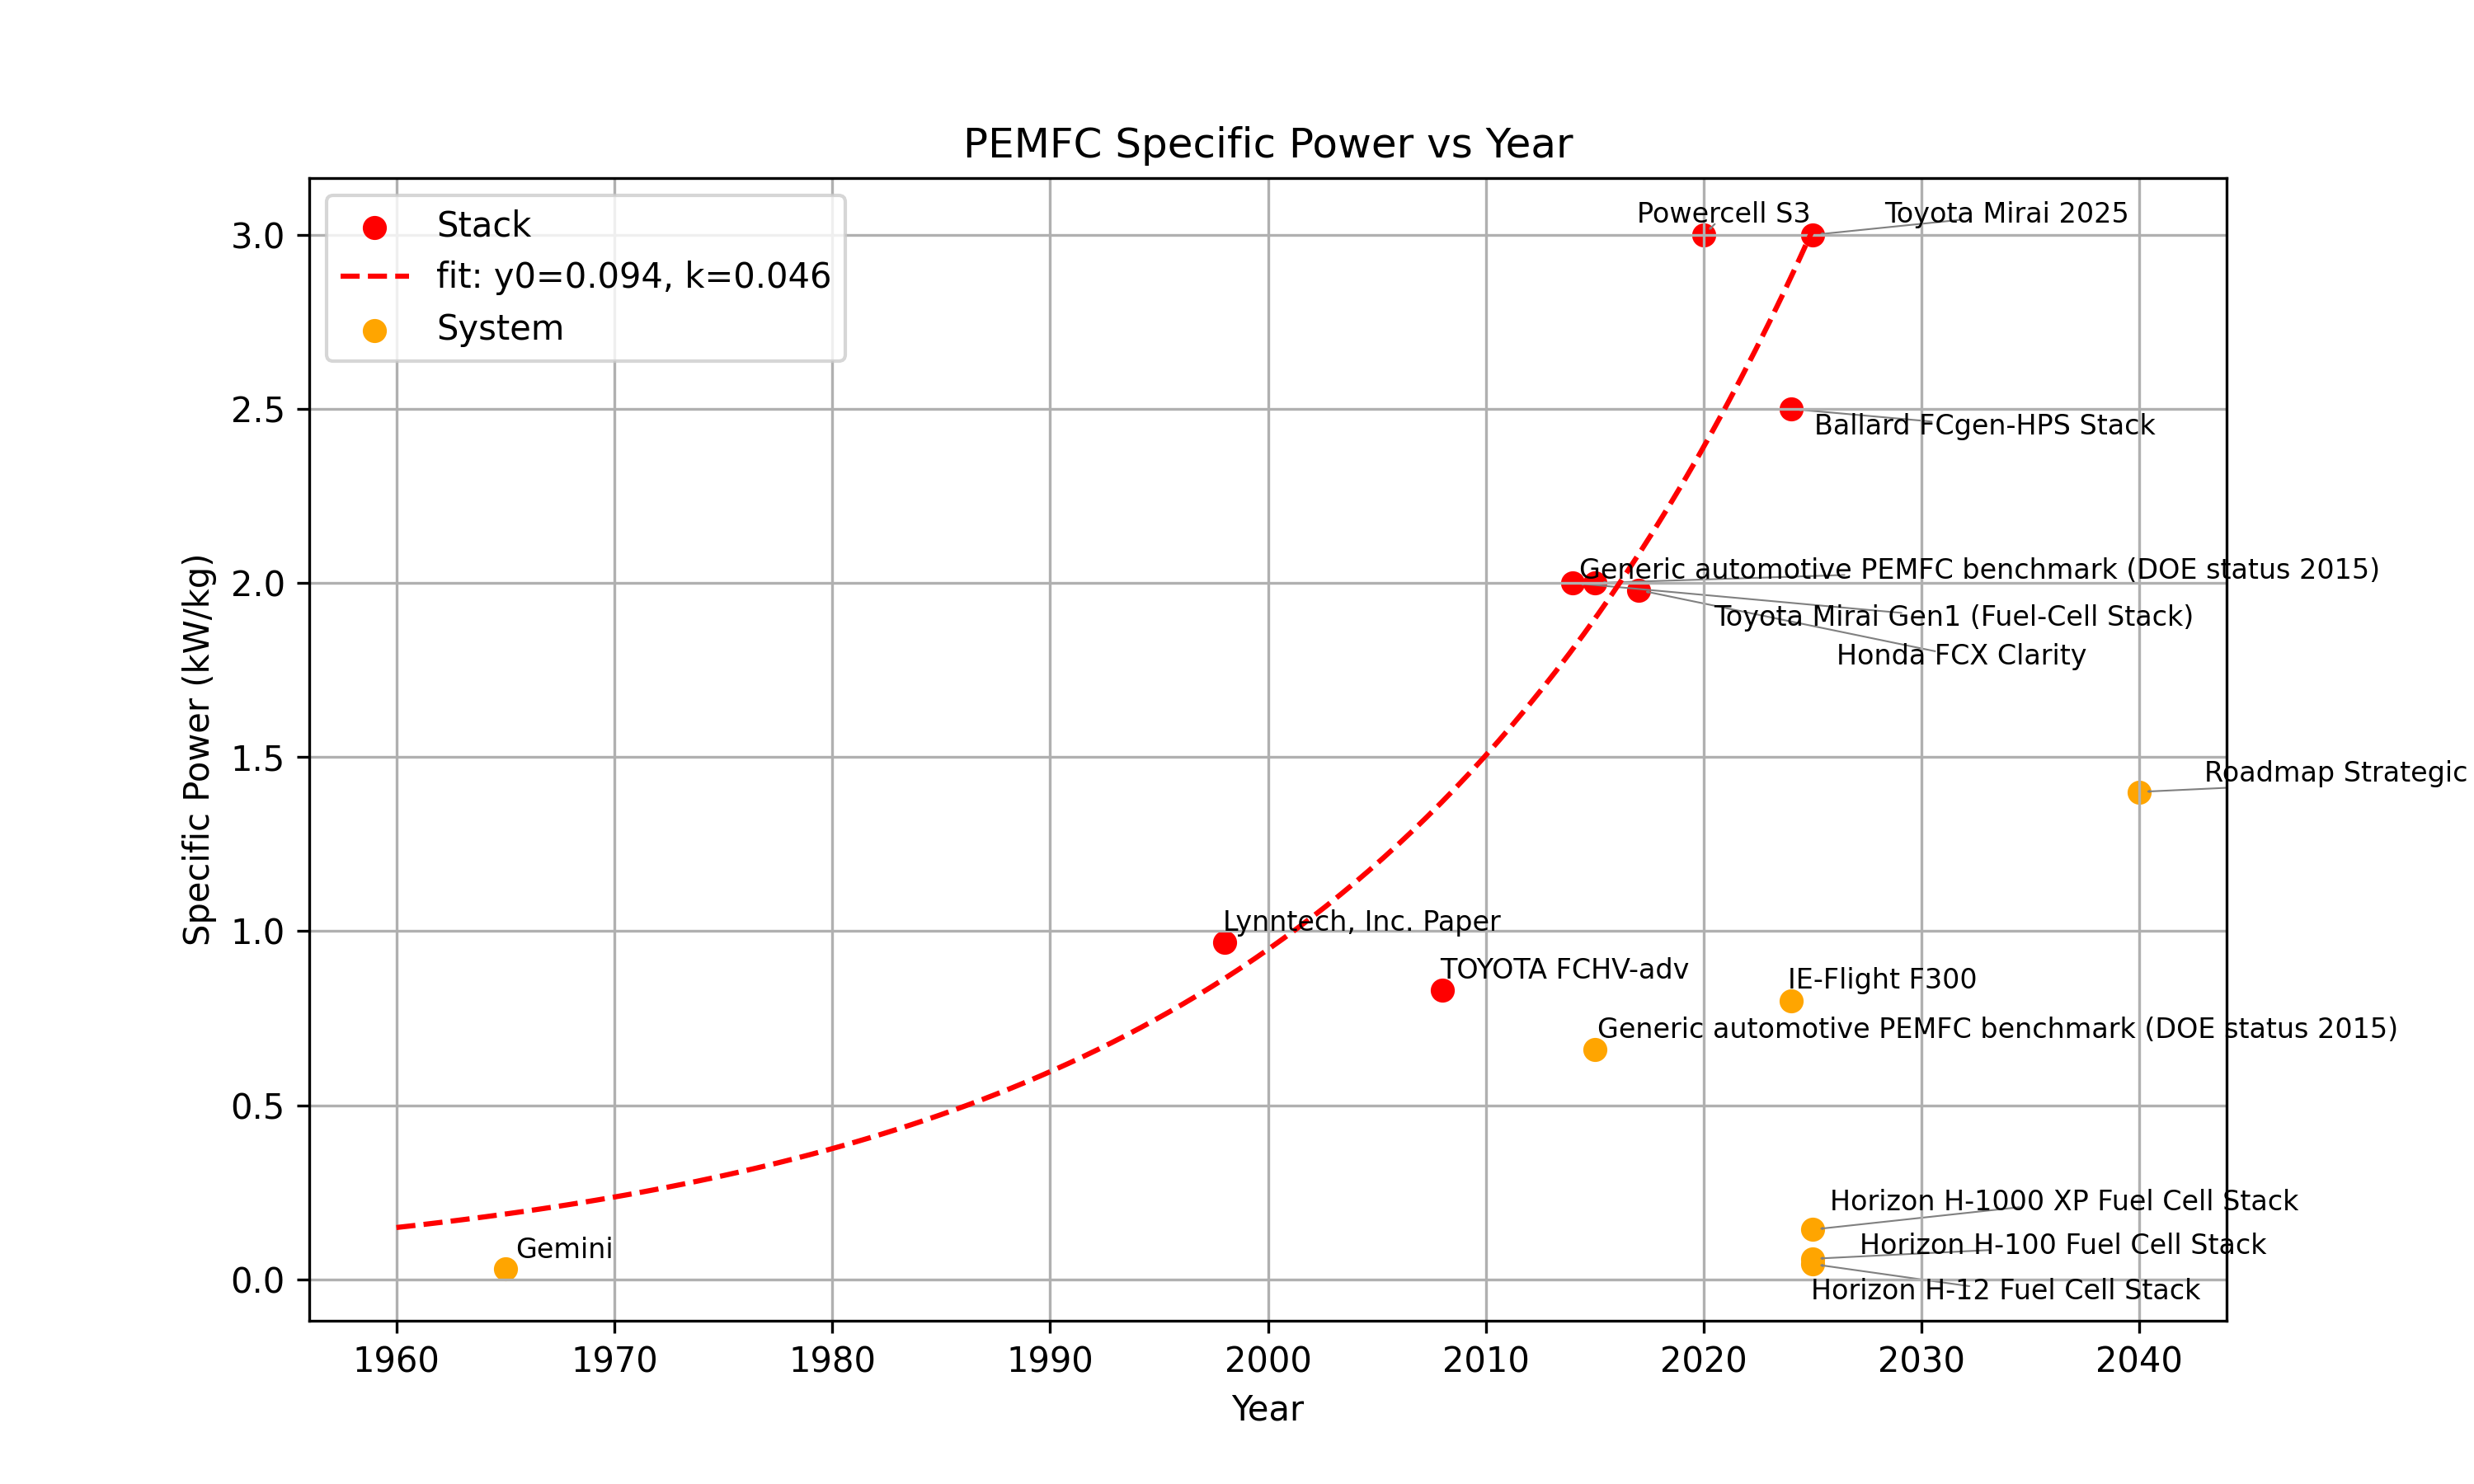
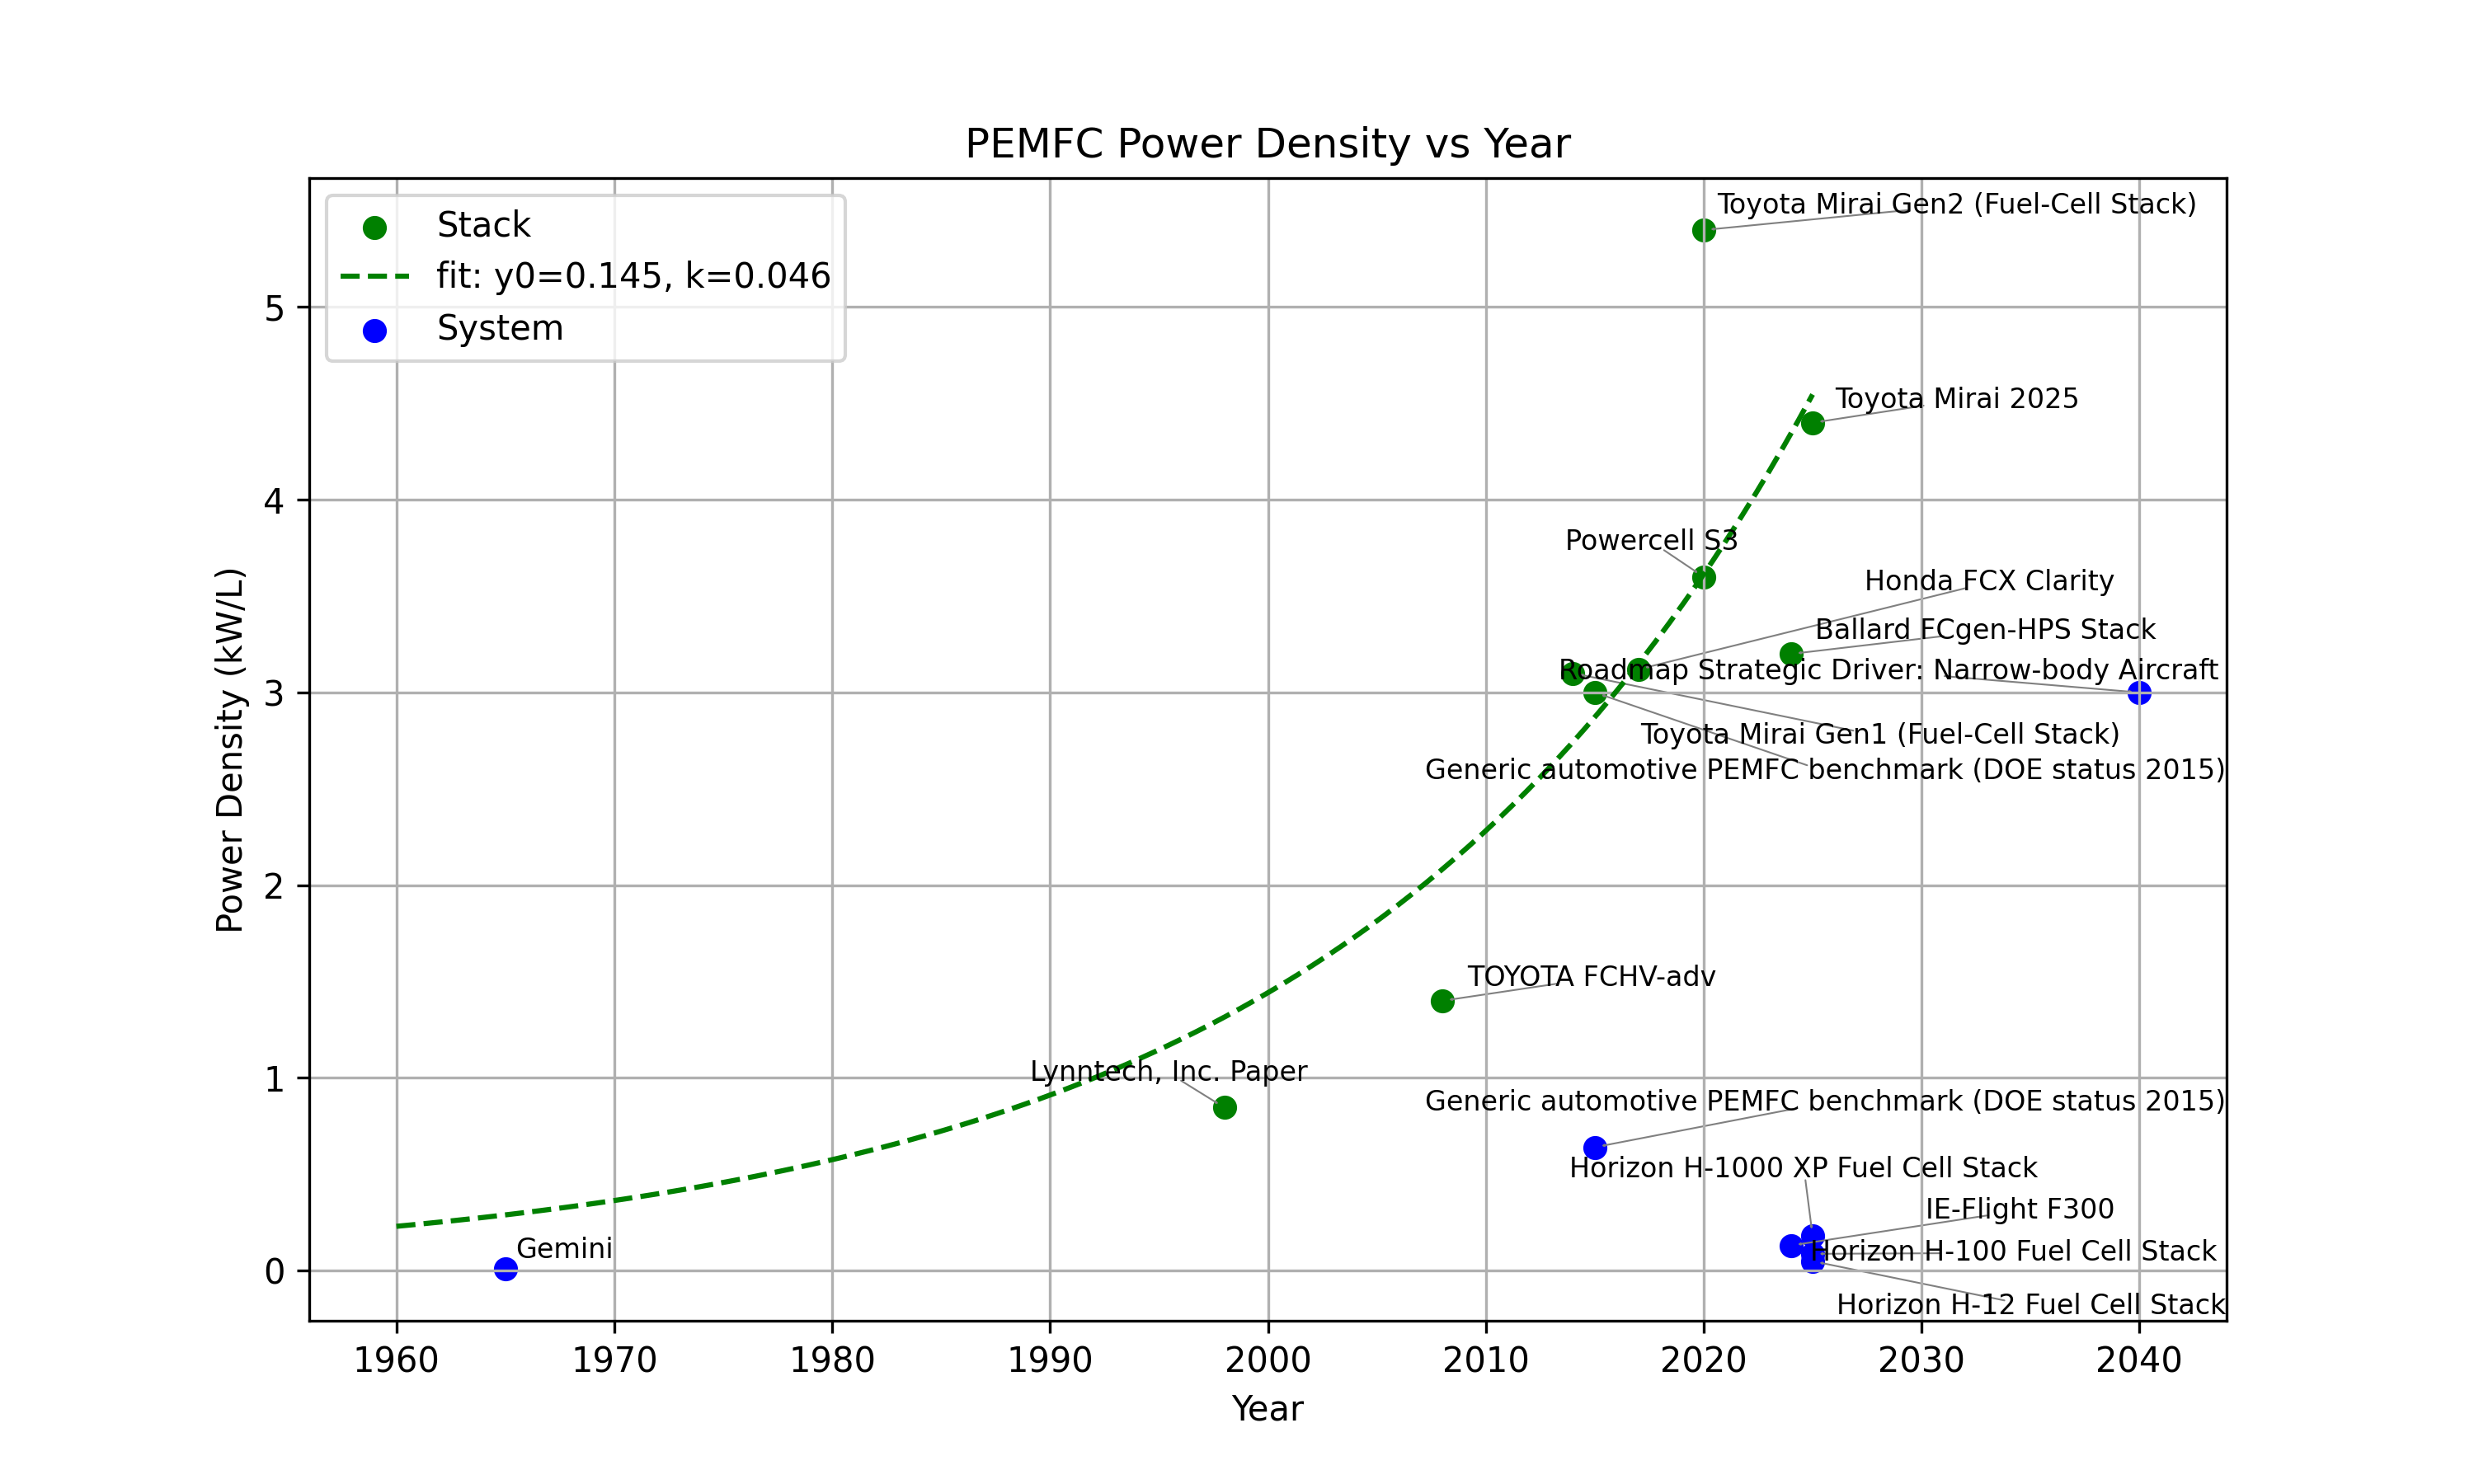
Two key figures of merit for hydrogen PEM fuel-cells are stack power density (kW/L) and specific power (kW/kg). These FOMs are especially important for fuel cells used in transportation applications such as aviation where minimizing structural mass and volume while delivering required power is a central design challenge. Higher power densities and specific powers enable farther ranges and higher payload mass.
Improvements in specific power and power density can be made by decreasing stack components' mass and volume or by increasing the power output. Mass and volume reduction can be achieved through engineering lighter weight materials and making stack components as thin as possible. Thinning and other weight reduction of stack components often comes with reduced durability and lifetime of the fuel cell, which are also important FOMs. To increase the power, the reactant flow rate can be increased by operating at a higher pressure. There is then a trade-off with compressor weight, which is part of the balance-of-plant. Employing either strategy causes more complicated effects such as impacts to cooling architecture and (in the aircraft case) increased drag. Since 1950, fuel cell power density and specific power have been increasing by ~5.8% and ~5.6% per year respectively.
¶ 5. Alignment of Strategic Drivers: FOM Targets
| Label | Strategic Driver | Alignment and Targets |
|
1 |
To develop a hydrogen PEMFC system competitive for narrow-body short- to medium-haul aircraft (e.g. A320neo) power generation. | Using the A320neo as a baseline to estimate cruise power demand and the PW1100G as a baseline engine to benchmark powerplant weight and size, the PEMFC system would need to have a system level specific power ~1.4 kW/kg and system level power density ~3 kW/L to be competitive at cruise. For takeoff, the targets would be even higher. In the aircraft context, installing a cowled radiator is the typical method of heat rejection, which incurs a drag penalty. Increasing efficiency reduces the waste heat that must be rejected, thus decreasing the drag penalty. Additionally, aircraft have durability and safety requirements that must be met. Increasing efficiency, system specific power, system power density, and durability are all aligned with the roadmap. |
|
2 |
To develop a hydrogen PEMFC competitive for long-haul trucking. | To compete with diesel engine for long-haul trucking, the PEMFC must see a cost reduction to ~215 $/kW and durability of ~20000 hrs at the operating conditions of the truck. Lowering cost and increasing durability are aligned with the roadmap. |
Strategic Driver 1 Notes: Power requirement is being estimated using A320neo specs (https://en.wikipedia.org/wiki/Airbus_A320neo_family). Assuming the aircraft has a mass of 65000 kg and L/D ~ 18, the thrust needed for cruise is 65000*9.81/18 = 35425 N. Flying at Mach 0.78 at 11km altitude, this corresponds to a power demand of ~8 MW. PW1100G engines have a volume of ~13 m3 and mass ~2900 kg (https://en.wikipedia.org/wiki/Pratt_%26_Whitney_PW1000G). Assuming 2 engines, to be competitive for cruise the fuel cell system specific power is 1.4 kW/kg and power density is 3 kW/L. This requirement can be thought of as a minimum as it doesn't take into account take-off and climb, which demand even more power (although, hybrid and/or boost systems may be employed to supplement power for short durations) or efficiency between electrical output from the fuel cell to shaft power to aerodynamic power T*V.
Strategic Driver 2 Notes: A Cummins X15 Efficiency Series Heavy-Duty Truck Engine provides 350 kW with a 2 year / 250,000 miles warranty and costs ~$75,000 new (https://www.cummins.com/engines/x15-efficiency-series-2024).
¶ 6. Positioning of Organization vs. Competition: FOM charts
The table below provides specifications for various PEMFCs we have found. Note that many FOMs are not published, and thus were left blank. The top 2 rows show our technology goals based on the strategic drivers above. Where possible, we have plotted FOMs vs. time or other relevant parameters. Note: ChatGPT was used to help identify fuel cells and compile specifications.
|
Name |
Company | Efficiency (%) | Stack Power Density (kW/L) | Stack Specific Power (kW/kg) | System Power Density (kW/L) | System Specific Power (kW/kg) | Year | Power Output (kW) | Cost ($/kW) | Lifetime (h) | Type |
| This roadmap's targets | 3 | 1.4 | Aircraft (strategic driver 1) | ||||||||
| This roadmap's targets | 215 | 20000 | Ground vehicles (strategic driver 2) | ||||||||
| Gemini | GE | - | - | - | 0.008935 | 0.03 | 1965 | 1 | - | - | Spacecraft |
| Lynntech, Inc. Paper | Lynntech, Inc. | - | 0.846 | 0.967 | - | - | 1998 | - | - | - | Research |
| TOYOTA FCHV-adv | Toyota Motor Corporation | - | 1.4 | 0.83 | - | - | 2008 | - | - | - | Ground vehicles |
| Toyota Mirai Gen1 (Fuel-Cell Stack) | Toyota Motor Corporation | - | 3.1 | 2 | - | - | 2014 | 114 | - | 3000 | Ground vehicles |
| Generic automotive PEMFC benchmark (DOE status 2015) | U.S. DOE / Automotive Fuel Cell Targets & Status | 60 | 3 | 2 | 0.64 | 0.659 | 2015 | - | - | - | Technology target |
| Honda FCX Clarity | Honda | - | 3.12 | 1.98 | - | - | 2017 | - | - | - | Ground vehicles |
| Toyota Mirai Gen2 (Fuel-Cell Stack) | Toyota Motor Corporation | - | 5.4 | - | - | - | 2020 | 128 | - | - | Ground vehicles |
| Powercell S3 | Powercell | - | 3.6 | 3 | - | - | 2020 | 159 | - | 20000 | Ground vehicles, Stationary power |
| Ballard FCgen-HPS Stack | Ballard Power Systems | - | 3.2 | 2.5 | - | - | 2024 | 160 | - | 25000 | Stationary power, Ground vehicles |
| IE-Flight F300 | IE-Flight | 57 | - | - | 0.13 | 0.8 | 2024 | 300 | - | - | Aircraft |
| ZeroAvia Modular High-Temperature PEM Fuel Cell Stack | ZeroAvia | - | - | - | 0.970992 | 2 | 2025 | 20 | - | - | Air vehicles |
| Toyota Mirai 2025 | Toyota Motor Corporation | - | 4.4 | 3 | - | - | 2025 | - | - | - | Ground vehicles |
| DOE Advanced Truck Technologies 2030 Goals | US DOE | 68 | - | - | - | - | 2030 | - | - | 25000 | Technology target |
| DOE Advanced Truck Technologies Ultimate Goals | US DOE | 72 | - | - | - | - | 2050 | - | 60 | 30000 | Technology target |
| EKPO NM12-single Stack Module | EKPO Fuel Cell Technologies | - | 4.2 | 1.64 | - | - | - | 123 | - | - | Stationary power, Ground vehicles |
¶ 7. Technical Model: Morphological Matrix and Tradespace
For brevity, only key parts of the technical model are shown here. More detail can be found in the accompanying document: /2025_team_7/pemfc_model_for_roadmaps_site.pdf.
The hydrogen fuel cell chemical reaction is:
Eq.1 : H2 + ½ O2 → H2Oliquid
The cell voltage (vcell) is the true reversible cell voltage minus activation loss (due to reaction kinetics), ohmic loss (from ionic and electronic resistance), and concentration loss (due to mass transport).
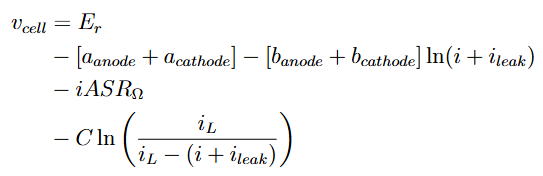
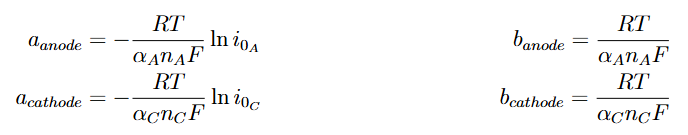
where Er is the reversible cell voltage (a function of the Gibbs energy change of the reaction), aanode, acathode, banode, and bcathode are fitting constants for kinetic activation losses, i is the current density, ileak is the leakage current density, ASROmega is the ohmic resistance loss, C is a concentration loss fitting constant, and iL is the limiting current density. The activation losses are functions of more fundamental constants:
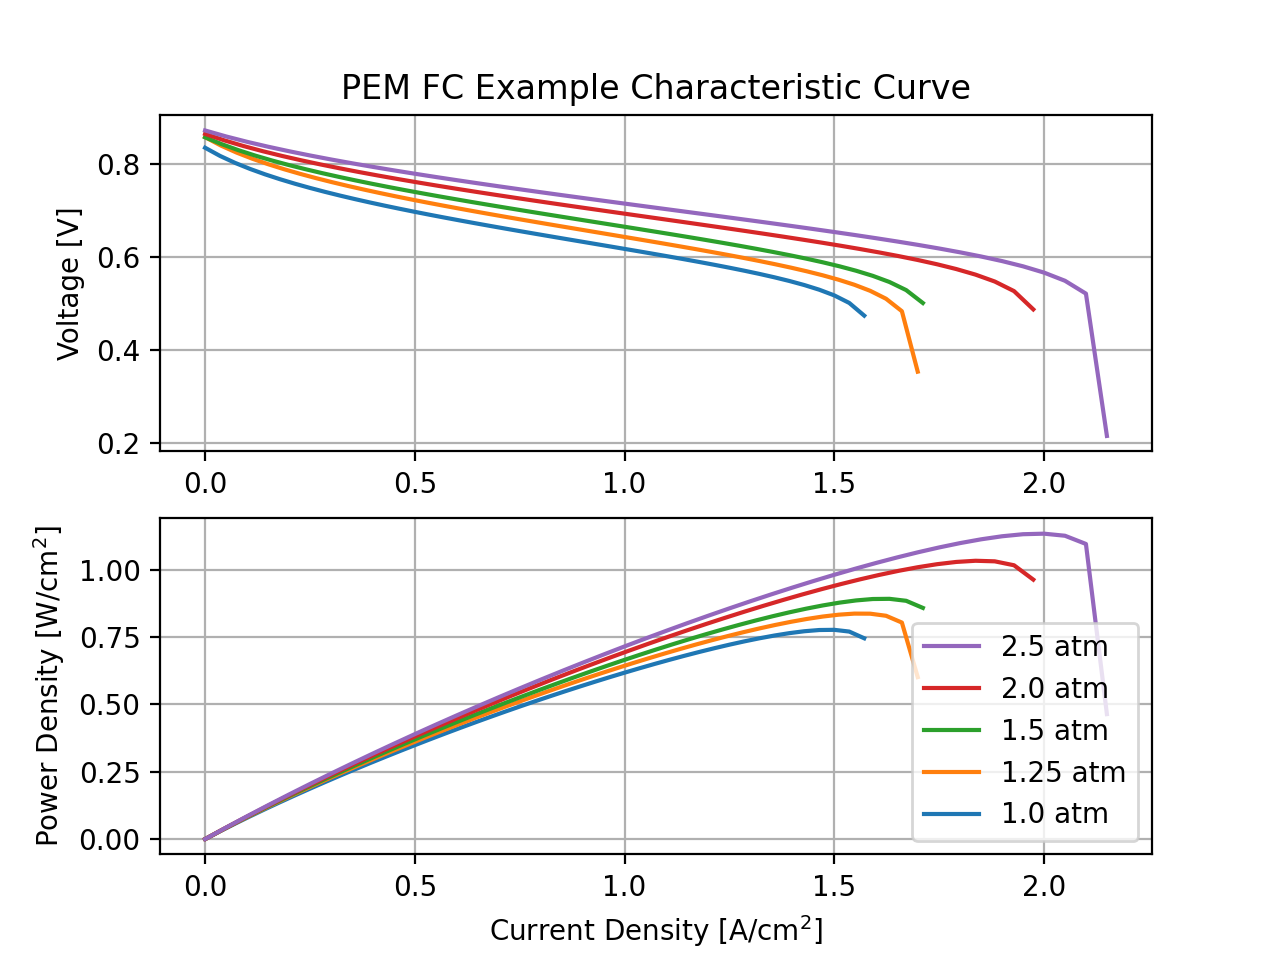
After performing experiments or detailed analysis to find the constants for a specific fuel cell stack, the characteristic curves can be computed using Eq. 2 and p = vcelli. Example curves based on typical values are shown below.
The overall efficiency is:
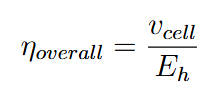
Where Eh is the heat of the reaction. Often, the voltage efficiency will be reported, which compares to Gibbs energy change rather than heat of reaction, since the Gibbs energy change is the maximum heat that can be converted to useful work. We will typically consider the overall efficiency as more informative, since it represents how much of the energy in the fuel is converted to useful work.
Once the fuel cell's characteristics are known, the fuel cell stack is designed by selecting a point on the characteristic curve, as well as any two of overall power, current, and voltage.
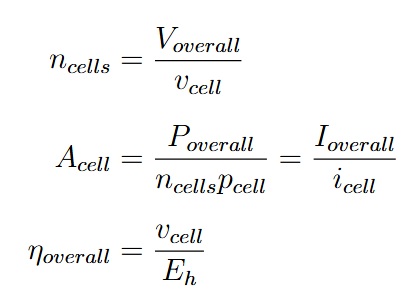
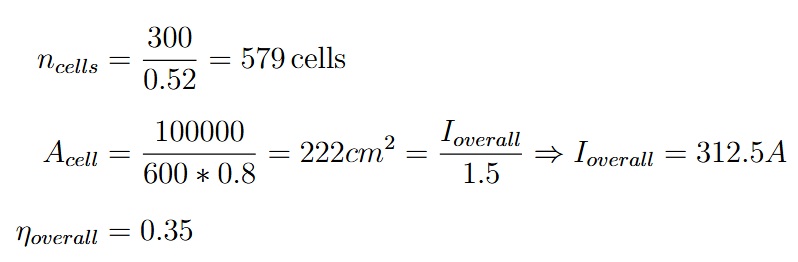
A common choice is to select the maximum power density point, as this will minimize the stack's mass for a given design power. For example, suppose we want a 300 V fuel cell with a power output of 100 kW, operating at 1 atm, and we wish to minimize its weight, so we pick to operate at the peak of the power density-current density curve. Then Poverall = 100kW , the power density and current density are where the curve peaks (pcell = 0.78W/cm2 at icell = 1.5A/cm2, which corresponds to vcell = 0.52V ), and the other parameters fall out.
Now that the area and number of cells are known, the thickness and density of the components (bipolar plates, gas diffusion layers, catalysts, PEM, gaskets) chosen to make each cell in the stack can be used to calculate the stack weight and volume.
Finally, the hydrogen and air consumption is calculated. The current (Ioverall) must be produced in each cell, and is proportional to the molar rate of consumption of the reactants. Once the molar rate is known, the mass flow rate can be calculated.
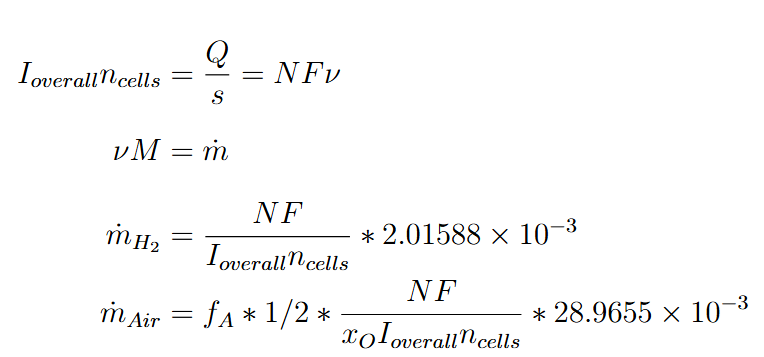
where fA is an air utilization factor due to providing more air than is stoichiometrically needed, and is usually ≈ 1.5-2.5. In our example fuel cell, mH2 = 2 g/s and mAir = 70 g/s.
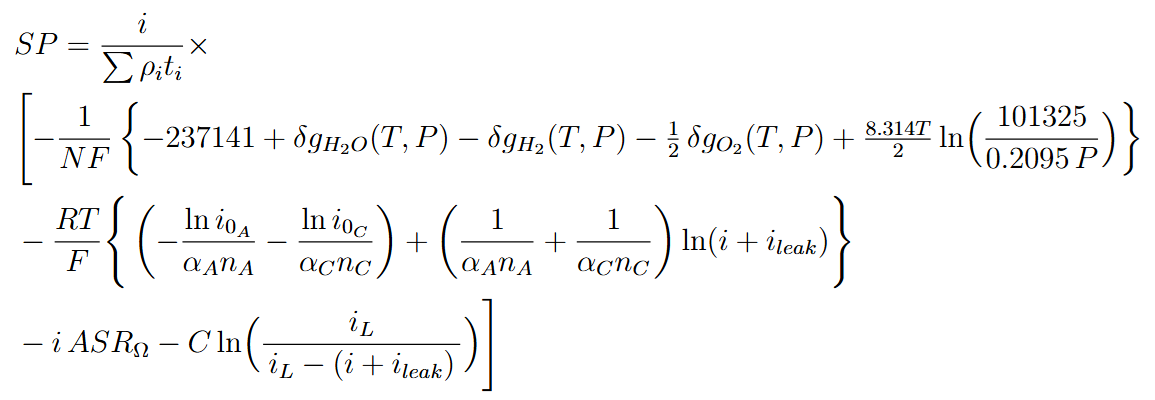
In addition to the efficiency, the technical model allows us to calculate other figures of merit such as specific power:
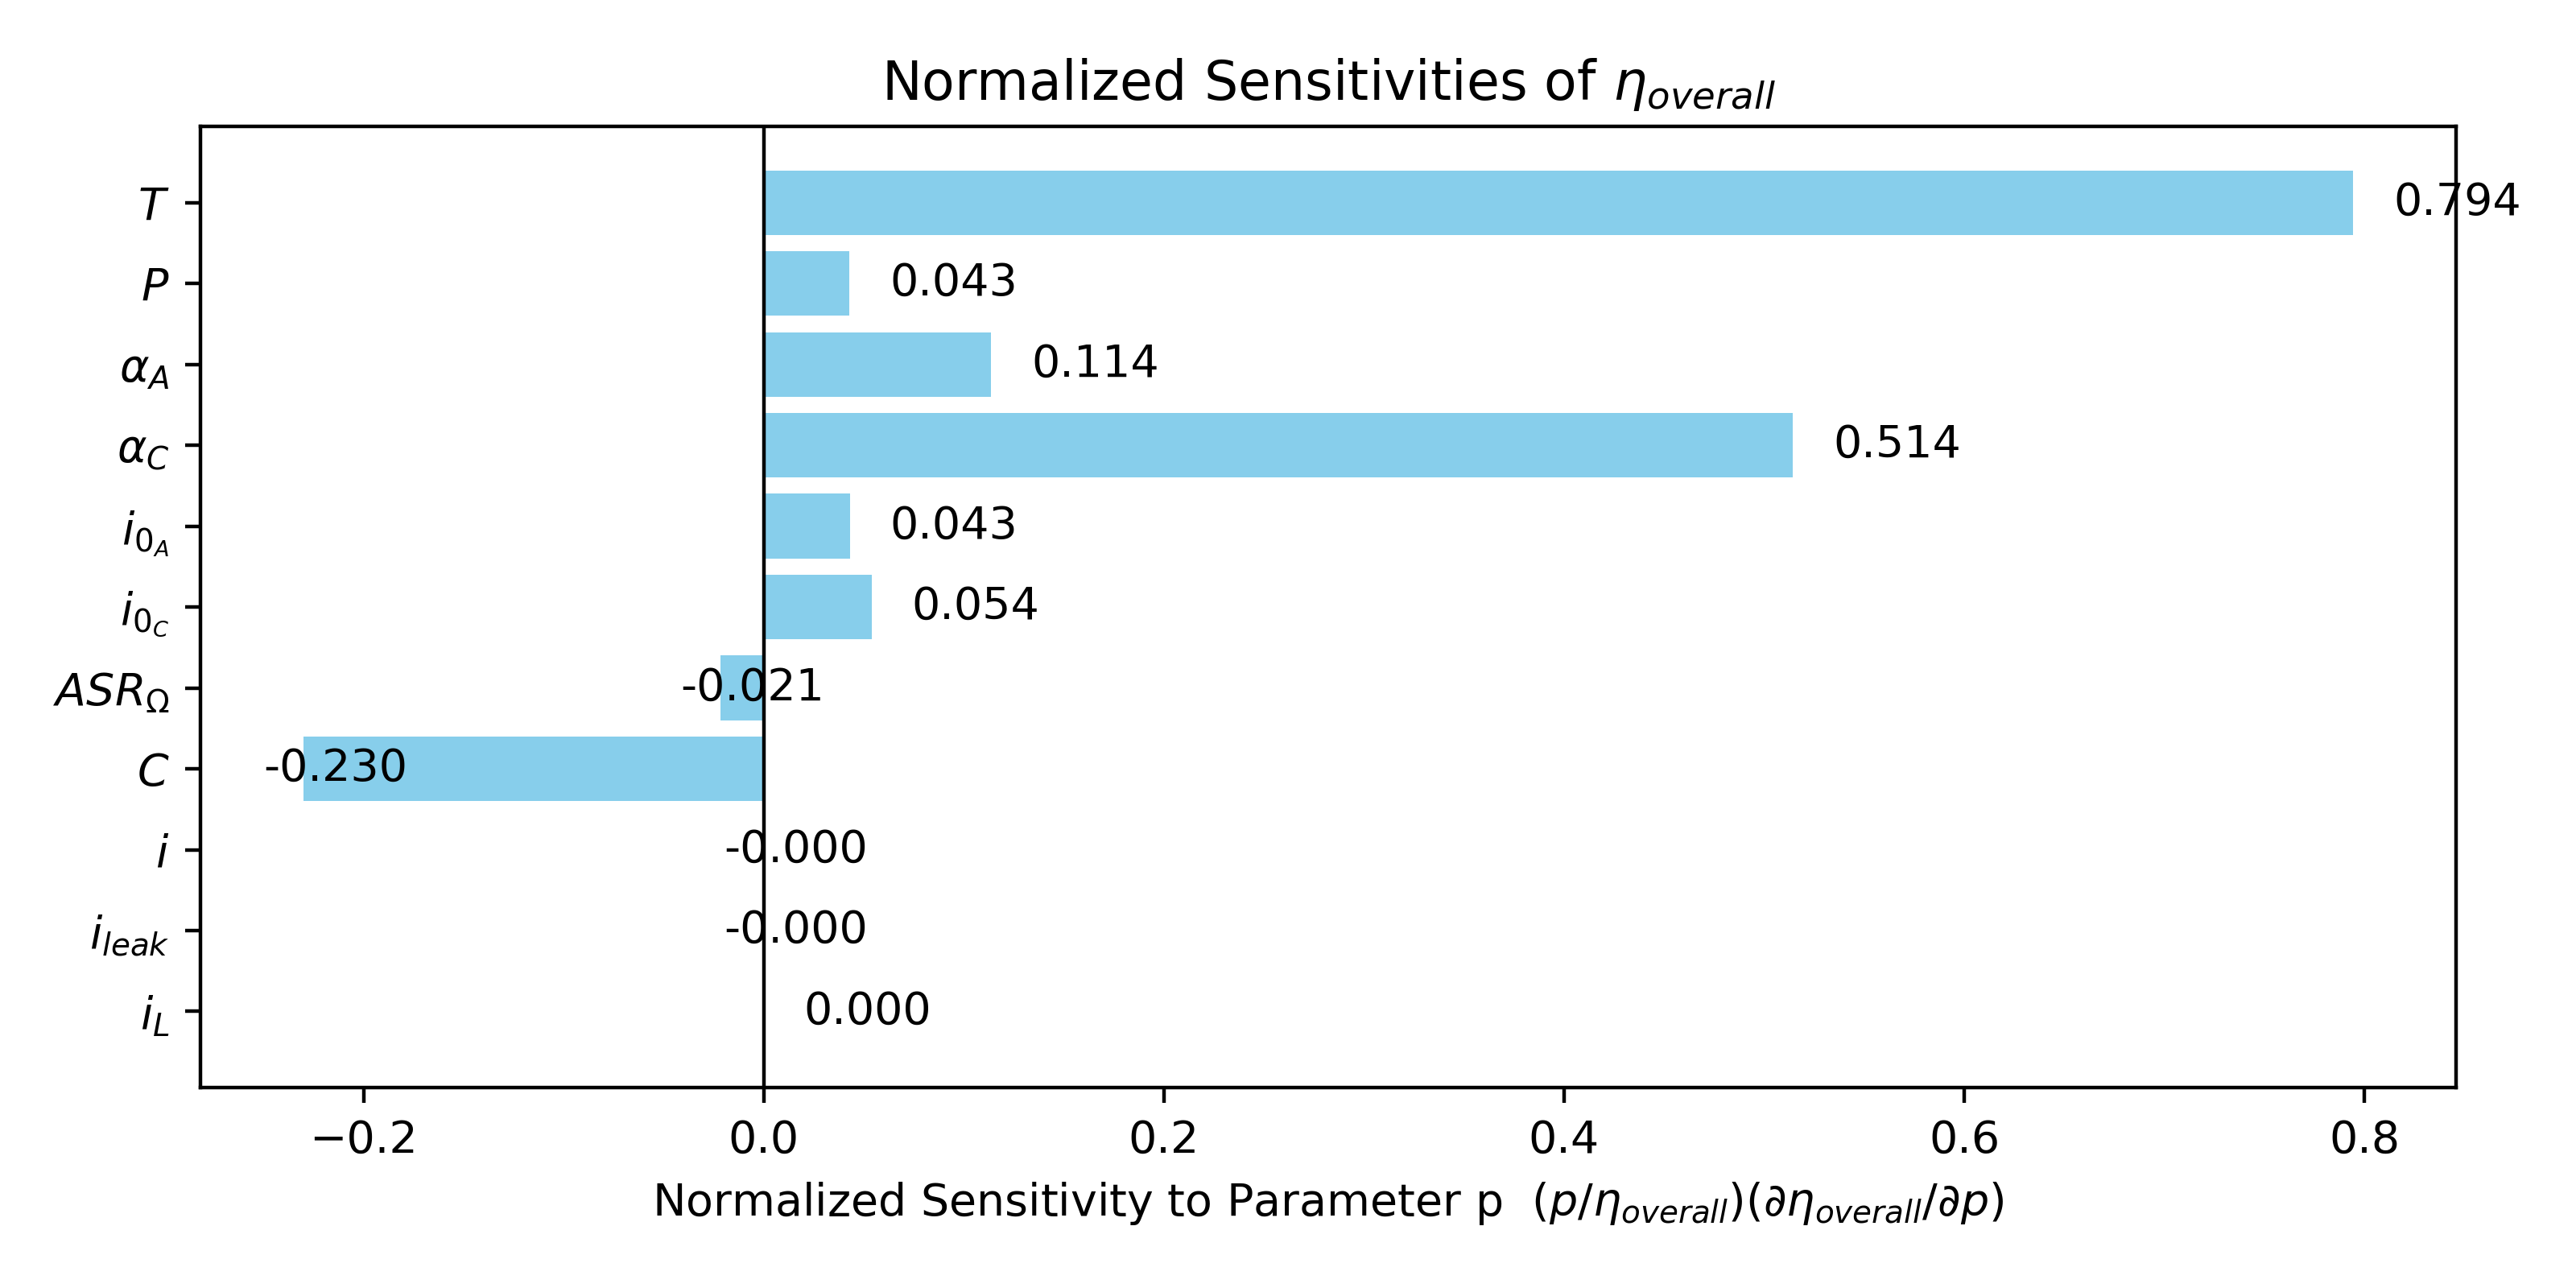
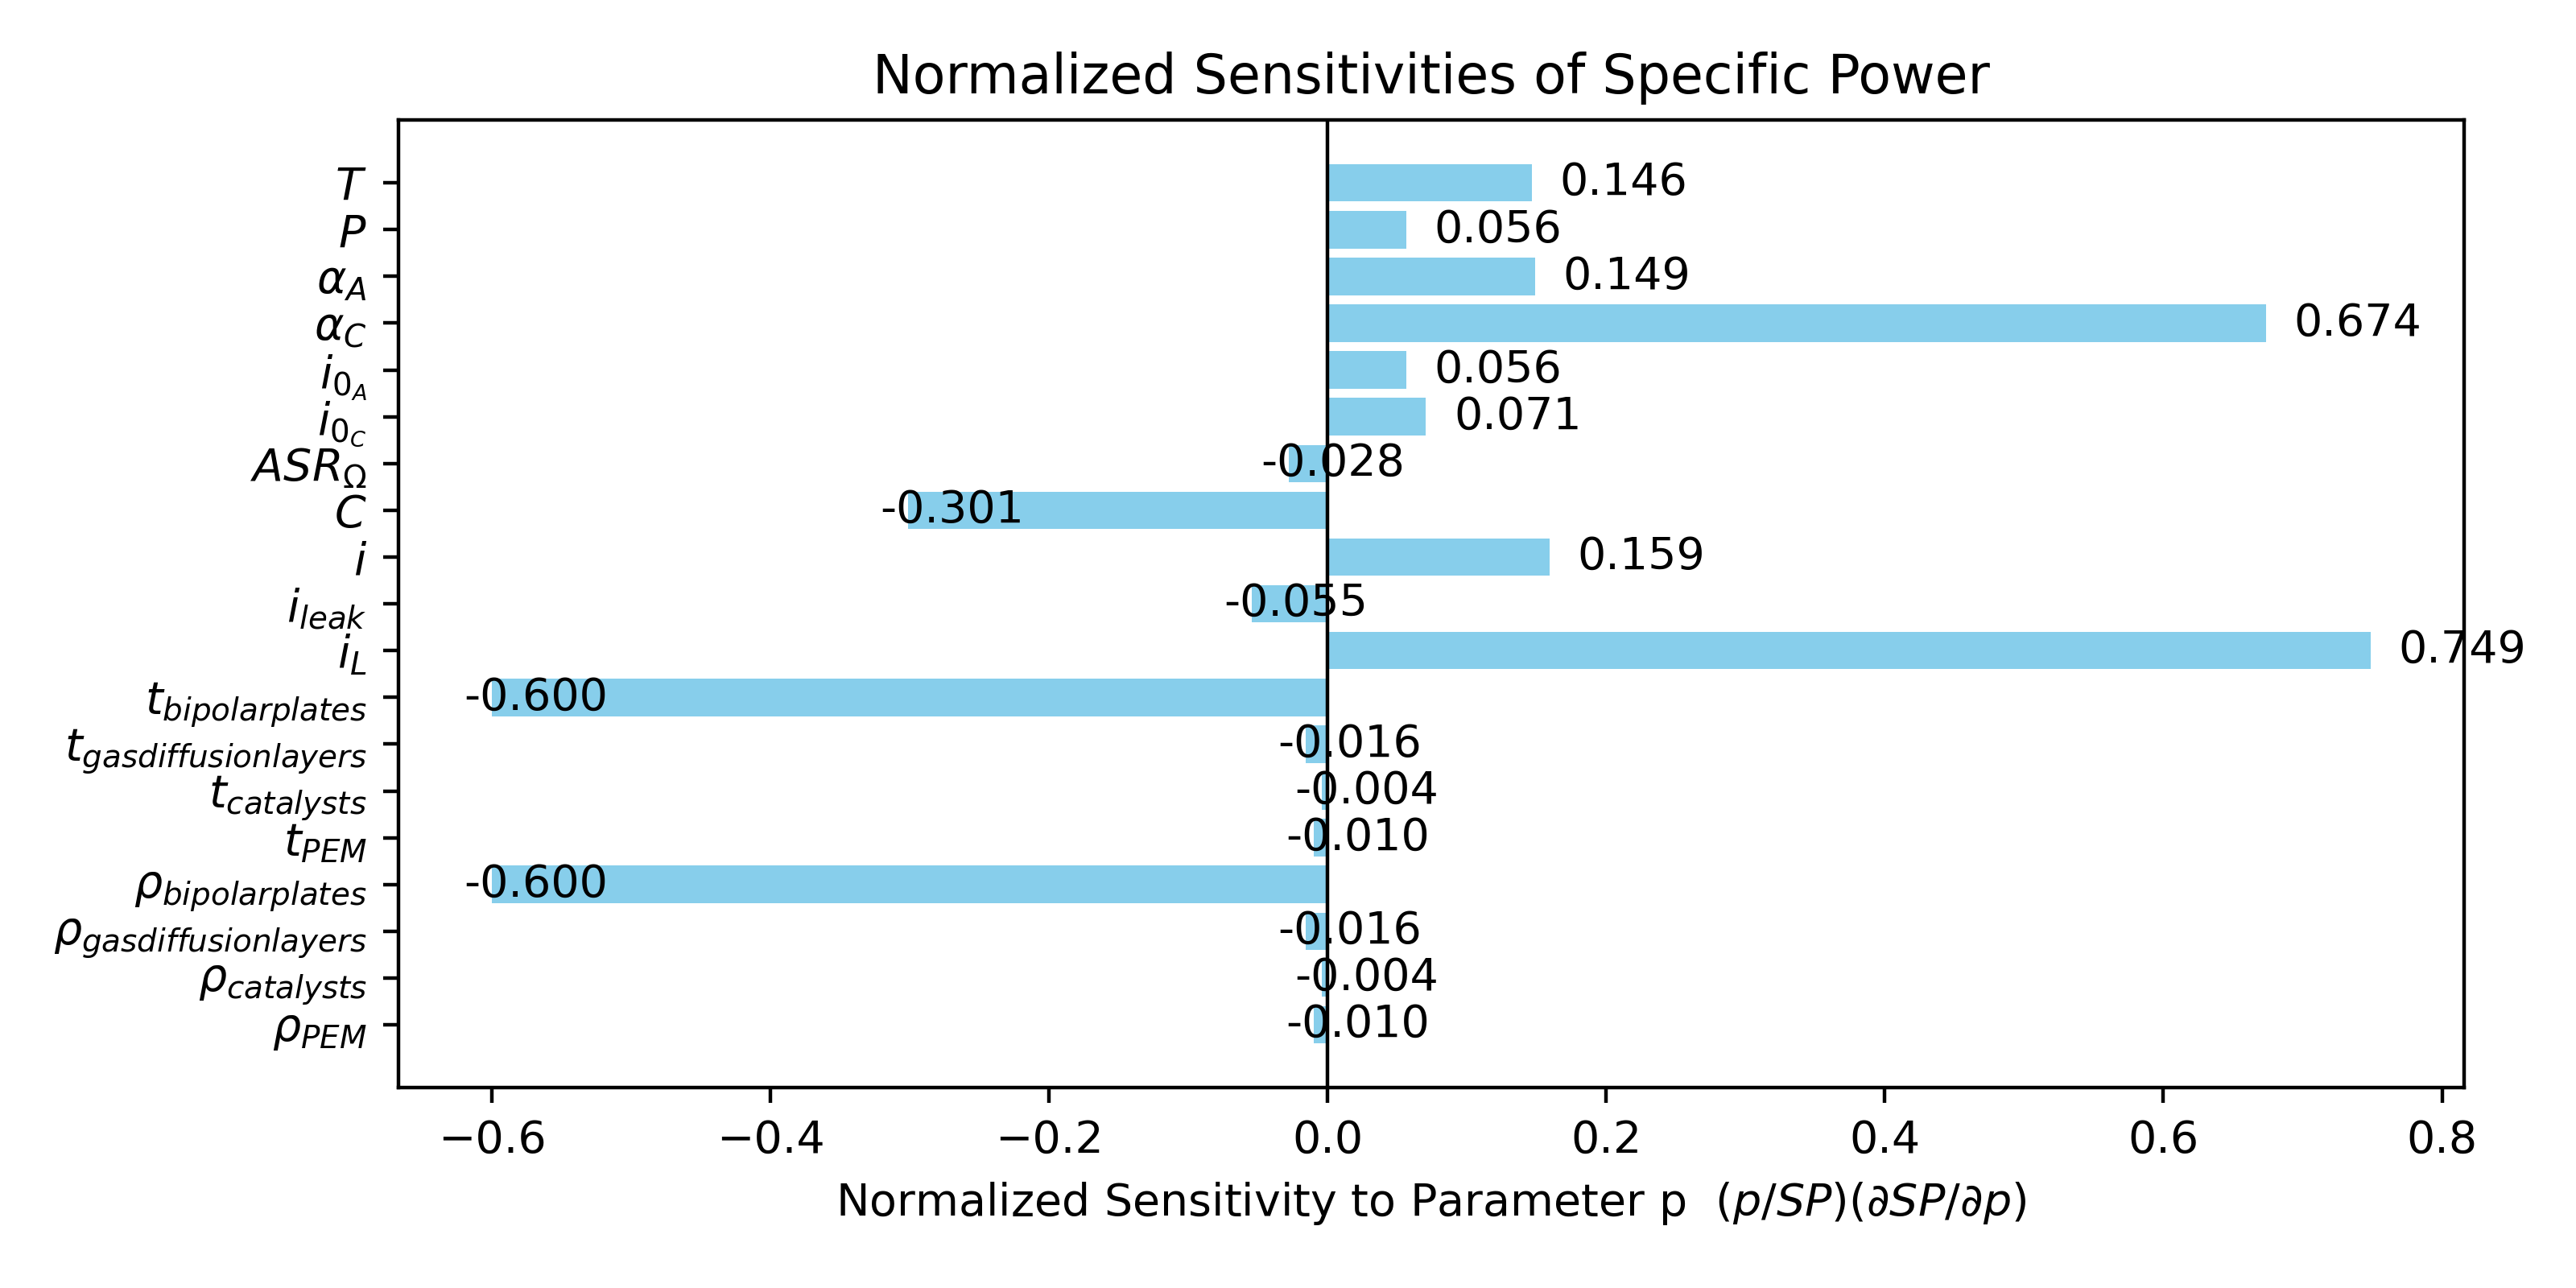
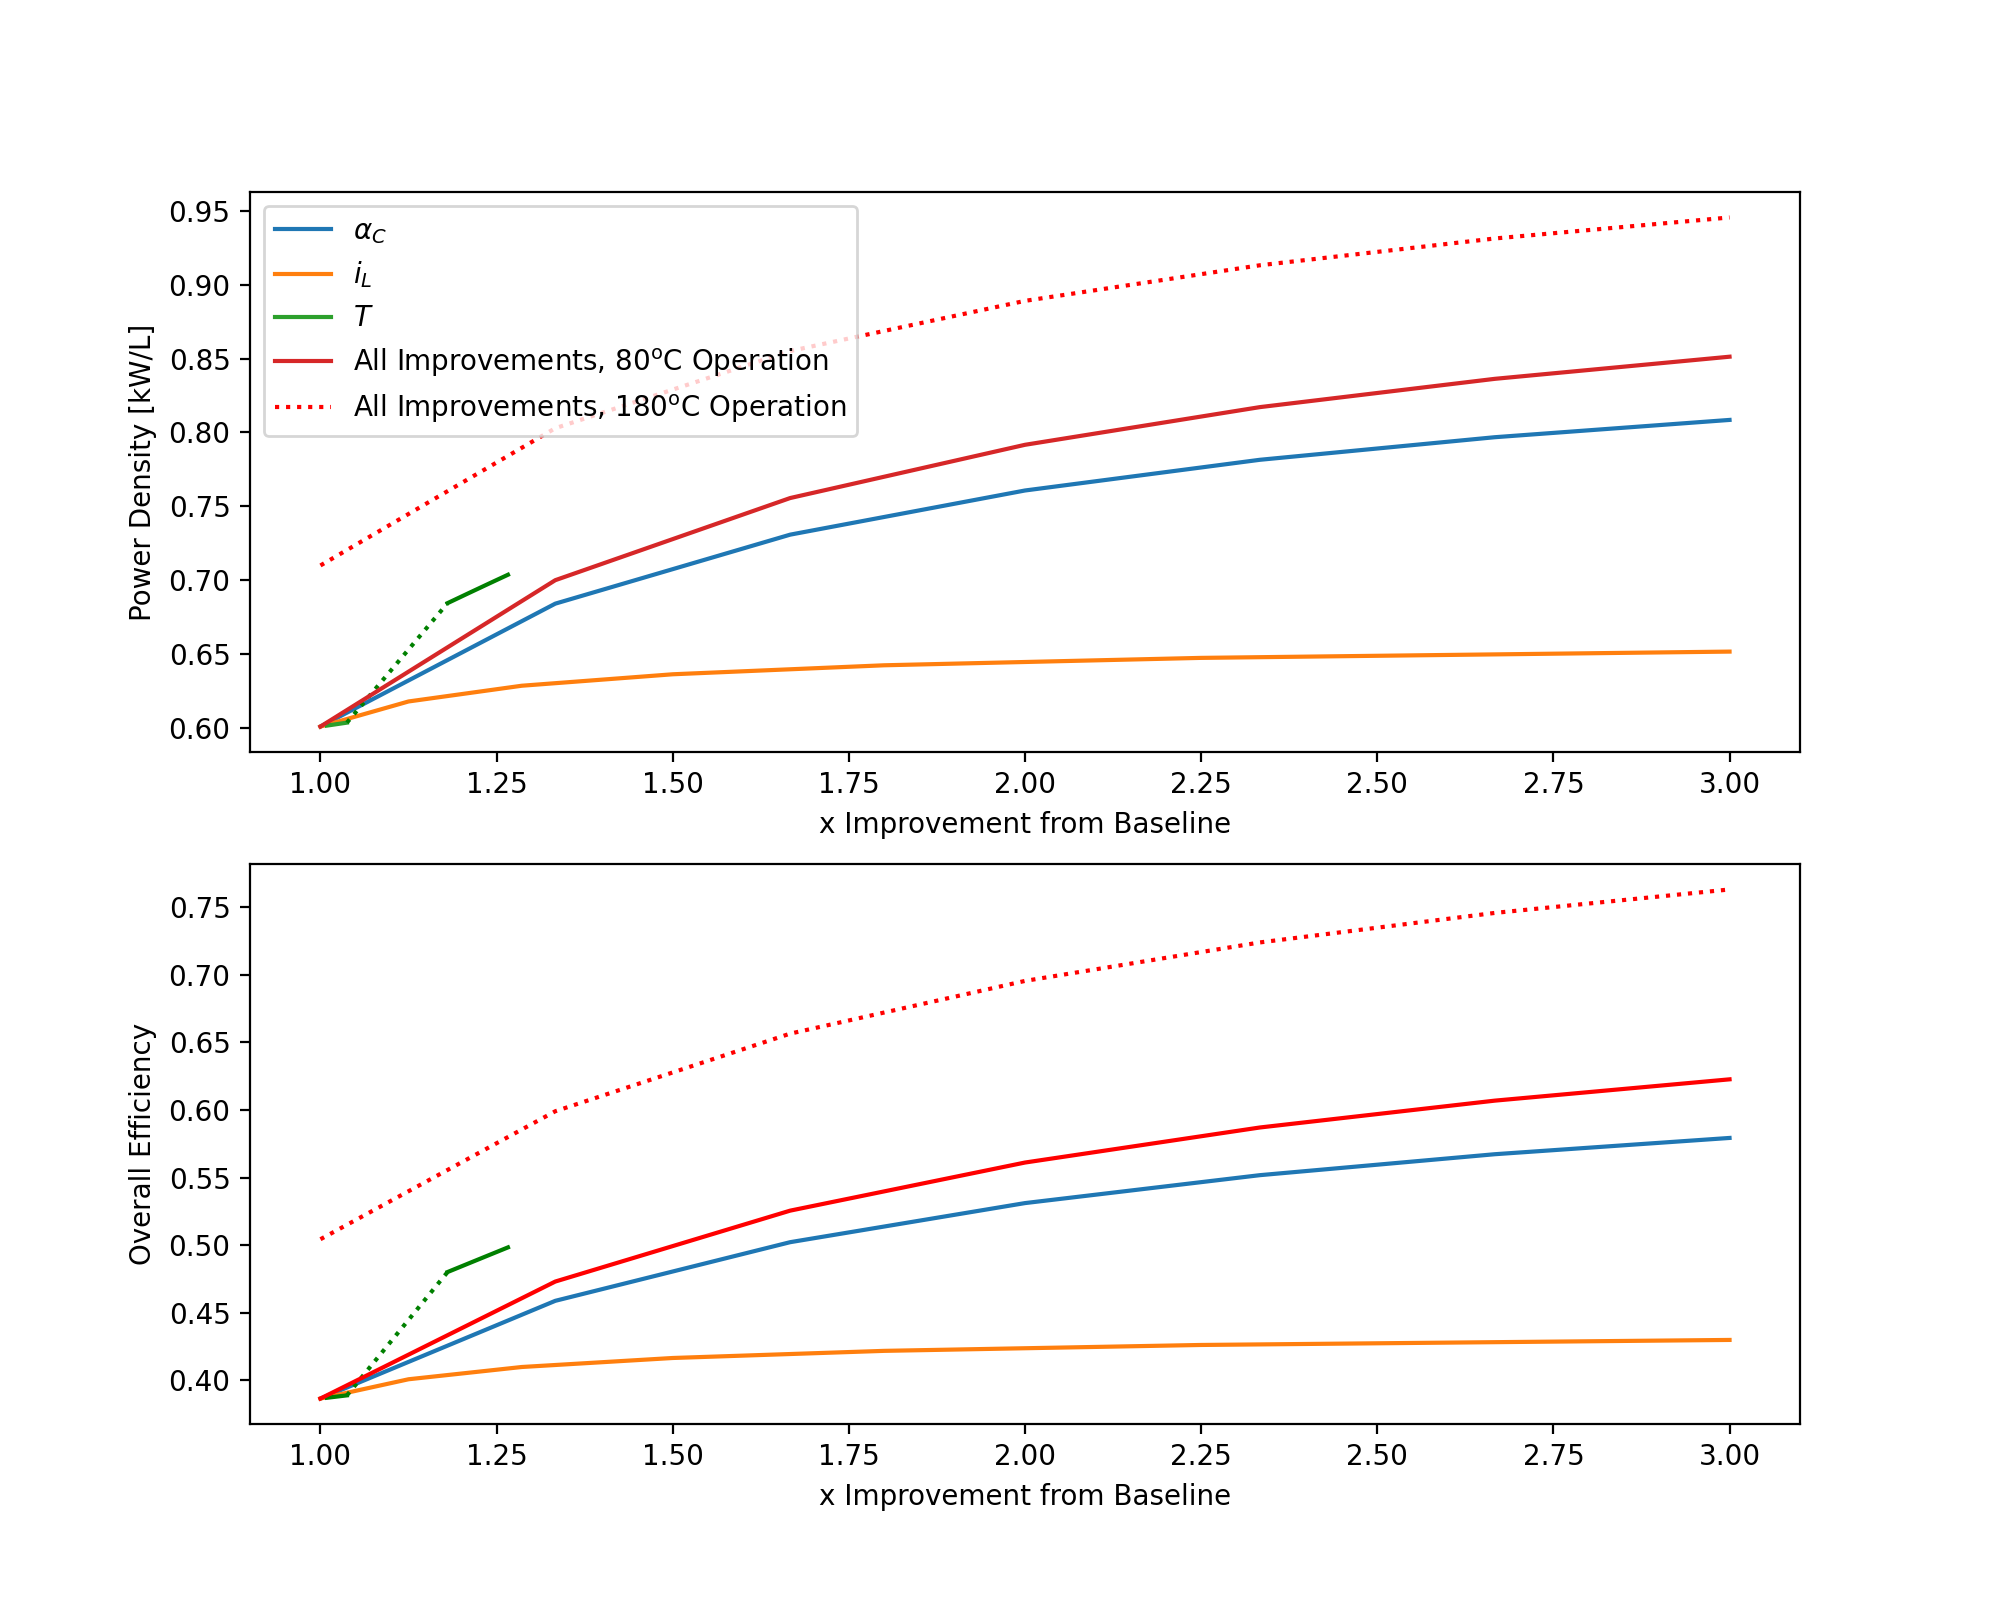
The technical model allows us to investigate how key figures of merit depend on sub-component performance and properties, which helps strategy for reaching the FOM goals laid out in section 5. Normalized sensitivities for the overall efficiency and specific power are shown below. When investigating overall efficiency and specific power, the following strategies for improving performance emerged as having the highest impact:
- Increasing temperature (with higher temperatures having a very strong effect on efficiency specifically)
- Increasing pressure
- Reducing cathode kinetic losses, which are typically more important than anode kinetic losses
- Increasing limiting current (with higher limiting current having a very strong effect on specific power specifically)
- Lightweighting the heaviest components
It should be noted that the technical modeling done here was simplified in many ways. More detailed modeling reveals even more dependencies between different parameters. It is important to remember it is difficult, if not impossible, to address one of the parameters without impacting the others – material, electrochemical, and mechanical properties are highly linked. Additionally, breakpoints such as the freezing and boiling points of water must be considered, as these cause a step-change in behavior. For example, perfluorinated polymers like Nafion are very popular electrolytes, but these must be hydrated with liquid water, restricting the temperatures they can operate at. Sensitivity analysis shows that while electrochemical performance is very important, system level considerations greatly impact and potentially constrain electrochemical performance and vice versa. Additionally, careful selection of figures of merit for the specific application is critical to understanding relevant benefits and drawbacks. As we saw in this example, in increasing efficiency a designer would not worry about current density. But if the fuel cell application is on a car or airplane, the current density becomes very important as it greatly impacts the specific power.
| Decision Variable | 1 | 2 | 3 | 4 | 5 |
| Operating Temperature | ~80oC (low temp) | ~160oC (high temp) | |||
| PEM Material | Perfluorinated Polymers (e.g., Nafion) | Sulfonated Hydrocarbon Polymers (e.g., Polyetheretherketone = PEEK) | Phosphoric Acid Doped Polybenzimidazole (PBI) | Polymer–Inorganic Composite Membranes | Solid-Acid Membranes |
| Electrode/Catalyst Material | Platinum | Platinum alloys | |||
| Bipolar plate material | Carbon-based composites | Metals | |||
| Cooling architecture | Air-cooled (passive) | Liquid-cooled | Evaporatively-cooled |
¶ 8. Financial Model: Technology Value (𝛥NPV)
¶ 8.1 Purpose and Scope
The purpose of the financial model is to quantify the economic value created by advancing PEM hydrogen fuel-cell technology relative to a baseline. As in the ATRA framework (Fig. 17.8 in the book), technology value is defined in terms of changes to financial figures of merit, primarily net present value (NPV) and ΔNPV, for the two mission domains in this roadmap:
- Narrow-body aircraft propulsion / onboard power (Strategic Driver 1)
- Long-haul trucking powertrains (Strategic Driver 2)
Following the methodology of Ch. 17, the model distinguishes:
- Value to customers (airlines and trucking operators), and
- Value to the manufacturer / integrator (PEMFC stack + balance-of-plant supplier).
Each technology is therefore evaluated twice: once for the operator’s business case and once for the manufacturer’s. Technology is valuable only if it generates positive ΔNPV within a defined scenario (Eq. 17.13).
To compute ΔNPV, a baseline PEMFC system is defined for each application domain.
¶ 8.2 Baseline Systems and Cash-flow Drivers
Application 1: Aircraft (A320neo-class power requirement)
Baseline (assumptions):
- system-specific power ≈ 0.8 kW/kg,
- system power density ≈ 1.5 kW/L,
- efficiency ≈ 50–55%,
- lifetime ≈ 6,000–10,000 h.
Operator-side cash-flow drivers:
- Fuel (hydrogen) consumption
- Cooling drag penalty (large effect on fuel burn)
- Maintenance burden (stack replacements driven by lifetime)
- Capital cost per kW (acquisition of fuel-cell system)
Manufacturer-side drivers:
- Stack + BoP production cost
- Pt catalyst loading (this is a major cost driver)
- Cost of high-temperature membranes and plate materials
- R&D cost to mature new MEA chemistries
- Certification and integration costs for aviation applications (very high NRC)
Application 2: Trucking (long-haul)
Baseline (assumptions):
- Cost ≈ $650–900/kW,
- Durability 10,000–15,000 h,
- Efficiency ≈ 50–55%.
Operator-side cash-flow drivers:
- Hydrogen consumption vs. diesel
- Stack replacement interval (lifetime is dominant in ΔNPV)
- Maintenance and downtime costs
- Upfront system cost
Manufacturer-side drivers:
- Volume scaling and learning curves (trucking is high-volume relative to aviation)
- Material cost (Pt) and membrane/manufacturing cost
- R&D to improve lifetime and reduce cost per kW
¶ 8.3 Link to Technical FOMs
The technical sensitivities derived in Section 7 (↑T, ↑iL, ↑αc, thinner bipolar plates, etc.) map directly to revenue- and cost-side cash flows:
1. Efficiency (↑ηoverall) → ΔNPV via hydrogen consumption
We can compute the effect of efficiency on hydrogen use using:

Aircraft: improved efficiency reduces required cooling area → reduces drag → reduces propulsion power → reduces total energy consumption.
Trucking: similarly, improved efficiency increase saves of hydrogen fuel, producing savings.
2. Stack specific power & system specific power (kW/kg)
Aircraft: Mass is a first-order driver of ΔNPV. Each 100 kg of additional mass on a narrow-body produces >$30k/year in fuel burn and payload penalties.
Trucking: Mass affects available payload (revenue), but less strongly than in aviation, so ΔNPV contribution is modest compared to efficiency and durability.
3. Lifetime
Lifetime dominates ΔNPV in trucking and remains a major cost in aviation because stack replacement is capital-intensive. Improving lifetime reduces total ownership cost. Lifetime improvements also reduce maintenance downtime (large NPV effect for fleet operators).
4. Cost ($/kW)
Both domains require a large cost reduction to meet strategic targets. Reducing Pt loading (catalyst) and manufacturing cost directly raises manufacturer ΔNPV, as in Table 17.5 of the aircraft example.
¶ 8.4 Representative ΔNPV Calculations
To quantify technology value, we run paired NPV analyses:
ΔNPV = E[NPVwith tech] − E[NPVbaseline]
Values below are representative, order-of-magnitude estimates, which are consistent with the ATRA methodology.
Application 1: Narrow-Body Aircraft
Assumptions:
- Cruise power requirement: 8 MW
- Baseline PEMFC efficiency: 55% → improved 60%
- Baseline system specific power: 0.8 kW/kg → improved 1.2 kW/kg
- Stack replacement interval: 8000 h → 12,000 h
- H₂ price: $6/kg
- Discount rate: 5%
- Mission lifetime considered: 15 years
- Annual operating hours (representative): ~3,000–3,500 h/year
Operator ΔNPV contribution (Rough Estimates)
1. ΔNPV from efficiency improvement (55% → 60% efficiency)
Hydrogen consumption is inversely proportional to efficiency: fuel_use ∝ 1 / efficiency. Thus, relative change = (1/0.55) − (1/0.60) ≈ 8–9% reduction.
Higher efficiency → less waste heat → smaller radiator → lower drag → lower propulsion power
Literature shows that only part of the electrical-side saving appears as total block energy saving. so using a (conservative) factor of 0.45, we get: 9% × 0.45 ≈ 4% total block-energy saving
Next, we can compute baseline annual H₂ use:
Electrical energy per year: 8 MW × 3,200 h ≈ 25,600 MWh/year
At 55% efficiency, this corresponds to fuel power needed ≈ 25,600 / 0.55 ≈ 46,500 MWh/year
Using hydrogen LHV (33.3 kWh/kg), H₂ baseline = 46,500,000 kWh / 33.3 kWh/kg ≈ 1.4 million kg H₂/year
Now apply the 4% saving: 0.04 × 1.4M ≈ 56,000 kg H₂ saved/year
56,000 kg × $6/kg ≈ $336,000 per year
NPV factor at 5% over 15 years ≈ 10.4
ΔNPV_eff ≈ 336k × 10.4 ≈ $3.5M
→ Rounded to: $3–5M ΔNPV
2. ΔNPV from specific-power improvement (0.8 kW/kg → 1.2 kW/kg)
System mass = power / specific power
Baseline mass = 8,000 kW / 0.8 = 10,000 kg
Improved mass = 8,000 kW / 1.2 = 6,667 kg
Mass saved ≈ 3,300 kg
It is assumed that each tonne of permanent mass on a narrow-body costs $100k–300k per year in fuel + payload penalty (depends on utilization and network). Hence, we conservatively use $50–150k per tonne per year.
Thus: 3.3 t × ($50–150k) ≈ $165k–$495k per year
Multiply annual savings by the 15-year 5% discount factor (≈10.4):
Lower bound: 165k × 10.4 ≈ $1.7M
Upper bound: 495k × 10.4 ≈ $5.1M
To stay conservative:
→ $1–2.5M ΔNPV
(The lower half of the range is reported because fuel-cell installations may not fully realize all payload-benefit economics.)
3. ΔNPV from lifetime improvement (8,000 h → 12,000 h)
Over 15 years at 3,200 h/year, total operating hours ≈ 48,000 h.
Baseline: 48,000 / 8,000 ≈ 6 replacements
Improved: 48,000 / 12,000 ≈ 4 replacements
≈ 2 replacements avoided
Aviation-grade PEMFC stack + labor + downtime: $300k–500k each.
Thus avoided maintenance cost:
2 × ($300–500k) ≈ $0.6M–1.0M
Replacements occur in years 3, 6, 9, 12, etc.
The avoided replacements in later years carry lower discounted value, so the discounted total ≈ $1–1.5M.
→ ΔNPV: $1–1.5M
TOTAL
| Improvement | Effect | ΔNPV (15 yr) |
|---|---|---|
| +5% absolute efficiency | −~4% energy use | +$3–5M |
| +50% specific power | −1200–1500 kg system mass | +$1–2.5M |
| +50% longer lifetime | Fewer stack replacements | +$1–1.5M |
Total operator ΔNPV: ~$5–9M per aircraft equivalent system
Application 2: Long-Haul Trucking
Assumptions (illustrative)
- Annual distance: 160,000 km
- Baseline FC efficiency: 55% → improved 60%
- Baseline lifetime: 10,000 h → 20,000 h
- Baseline cost: $600/kW → $350/kW
- FC system size: 350 kW
- Discount rate: 8%
Operator ΔNPV contribution
1. ΔNPV from efficiency improvement (55% → 60%)
The efficiency increase gives ~8–9% less fuel. A long-haul FC truck is assumed to use 10–12 kg H₂ / 100 km.
Thus annual baseline H₂ use: 160,000 km × 0.11 kg/km ≈ 17,600 kg/year
8–9% saving → 1,400–1,600 kg saved/year
Conservatively estimate ≈ 900 kg/year (accounts for real-world duty cycles and partial-load operation).
Converting to dollars: 900 kg × $6/kg ≈ $5,400 per year
Discount 10 years at 8%: NPV factor ≈ 6.7
5,400 × 6.7 ≈ $36k
Upside scenarios give $70–100k.
2. ΔNPV from lifetime improvement (10,000 h → 20,000 h)
Annual hours for such trucks ≈ 2,000 h/year.
Over 10 years: 20,000 h.
Baseline (10,000 h life) → 1 replacement
Improved (20,000 h life) → 0 replacements
Replacement cost (stack + downtime): $100–150k
Discounted value: $100–150k
3. ΔNPV from cost reduction ($600/kW → $350/kW on a 350 kW FC)
Cost reduction = 250 USD/kW
× 350 kW = $87,500 CAPEX reduction
Discounted benefit to operator ≈ $50–90k
(This also depends on financing and resale effects.)
TOTAL
| Improvement | Effect | ΔNPV (10 yr) |
|---|---|---|
| +5% efficiency | ~900 kg H₂ saved/yr | +$70–100k |
| Lifetime doubled | Avoid one replacement | +$100–150k |
| Lower cost/kW | CAPEX −$87.5k | +$50–90k |
Total operator ΔNPV: ~$200–330k per truck
SUMMARY:
| Application | Improvement Lever | Mechanism | Annual Effect (Order-of-Magnitude) | ΔNPV (Discounted) |
|---|---|---|---|---|
| Aircraft (A320-class) | +5% efficiency (55→60%) | Less H₂ consumption + lower cooling drag | ~56,000 kg H₂ saved/yr | $3–5M |
| +50% specific power (0.8→1.2 kW/kg) | ~3.3 t mass reduction → lower fuel + payload benefit | $0.17–0.50M per yr | $1–2.5M | |
| +50% lifetime (8,000→12,000 h) | Avoid 1–2 stack replacements | $0.6–1.0M avoided (discounted) | $1–1.5M | |
| Aircraft Operator Total | $5–9M per aircraft system | |||
| Trucking (long-haul) | +5% efficiency (55→60%) | ~900 kg H₂ saved/yr | $5–11k per yr | $70–100k |
| Lifetime ×2 (10,000→20,000 h) | Avoid one replacement | $100–150k avoided | $100–150k | |
| Cost reduction ($600→350/kW) | 350 kW → $87.5k lower CAPEX | Operator share of savings | $50–90k | |
| Truck Operator Total | $200–330k per truck |
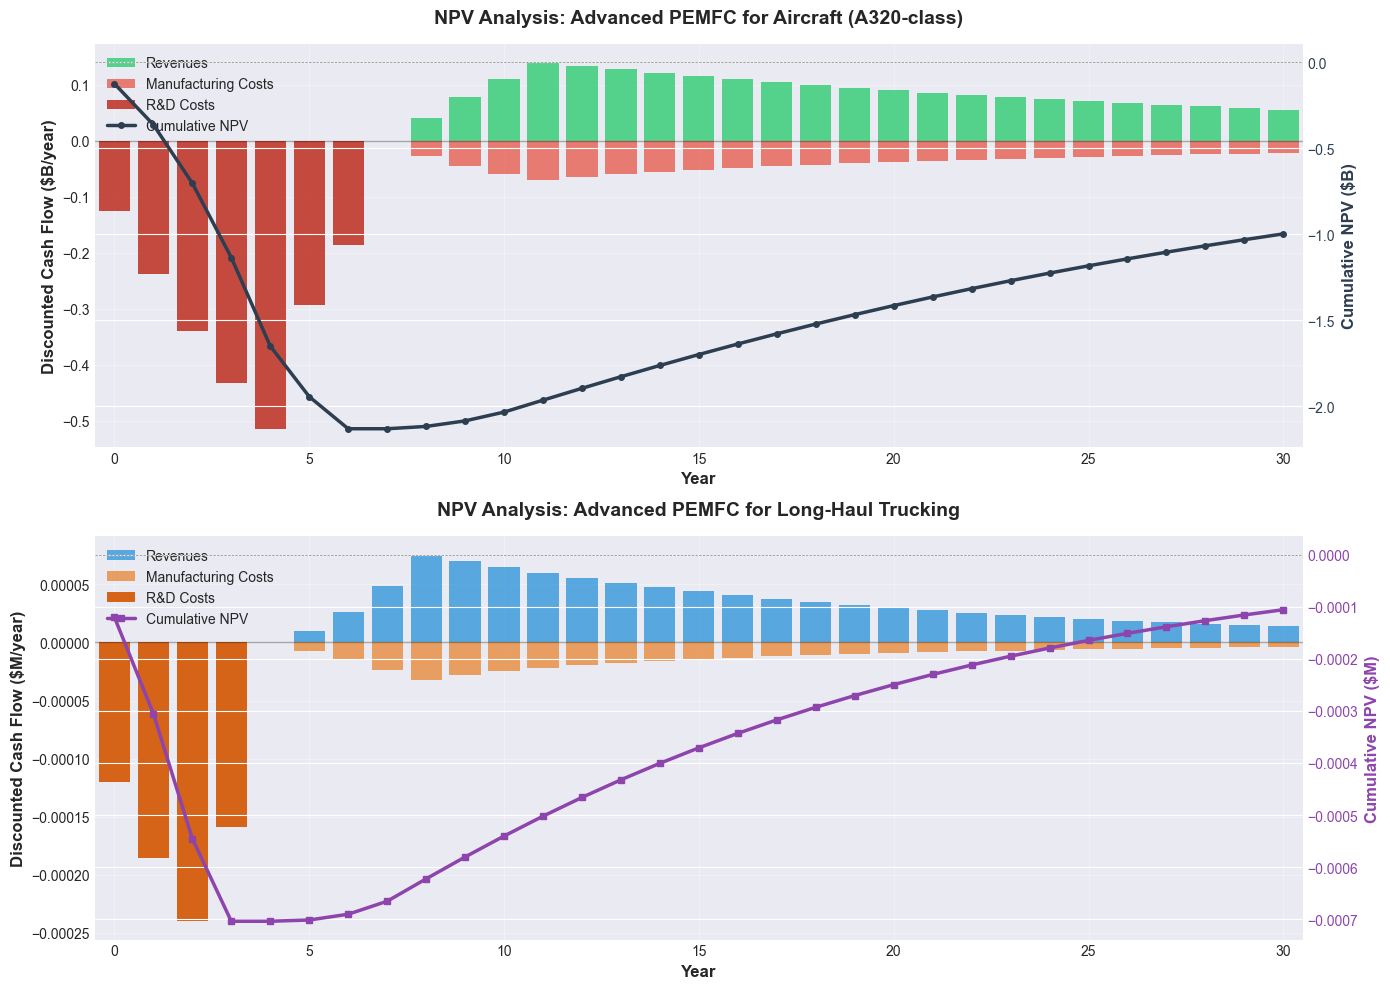
¶ 8.5 NPV Analysis
To complement the operator value analysis, we evaluate the financial viability of developing and producing advanced PEMFC systems from the manufacturer's perspective. This analysis models a 30-year program horizon encompassing R&D investment, production ramp-up, steady-state manufacturing, and the effects of learning curves on unit costs.
Application 1: Aircraft
The aircraft program assumes a 7-year R&D phase requiring $2.5B investment to achieve aviation certification and entry-into-service. Development costs follow a beta distribution, peaking during detailed design and validation testing in years 4–5. Production begins in year 8 with a 3-year ramp-up (5, 10, 15 units/year) before reaching steady-state production of 20 aircraft systems per year. Over the 23-year production period, 430 total systems are manufactured.
Manufacturing costs decrease according to a 92% learning curve, typical of aerospace applications where labor-intensive assembly and stringent quality requirements limit cost reduction. Initial unit costs of $8M per system (8 MW at $1,000/kW) are offset by a sales price of $12M per system, providing margin to recover development investment.
At a 5% discount rate (reflecting aerospace market risk), the program achieves break-even around year 14 with a final 30-year NPV near $0M. This marginal outcome reflects the challenge of amortizing substantial R&D costs across modest production volumes, which is not surprising for early-stage aviation hydrogen systems. This business case would probably also assume government co-funding for early TRL advancement and strategic first-mover value.
Application 2: Trucking
The trucking program benefits from faster development (4-year R&D phase, $800M investment) due to less stringent certification requirements. Production begins in year 5, ramping to 500 truck systems per year by year 8. Over 26 years of production, 12,000 total systems are manufactured—nearly 30× the aircraft volume.
Higher production volumes enable an 88% learning curve, driving unit costs down from $210k (350 kW at $600/kW) more aggressively than in aviation. Systems are priced at $280k, providing margin for profitability while remaining competitive with diesel and battery-electric alternatives.
At an 8% discount rate (reflecting commercial trucking market dynamics), the program reaches break-even by year 8 with a final 30-year NPV near $0M. In this case, while break-even occurs faster than aircraft, thin margins indicate the need for aftermarket revenue streams (service, stack replacements) and potential platform extensions to adjacent applications.
¶ 8.6 Summary of Technology Value (ΔNPV)
Across both strategic drivers, the highest-value improvements are:
- Higher operating temperature (↑T):
Strongest lever on efficiency and αc; enables simpler cooling, major ΔNPV boost in aircraft applications. - Higher limiting current density (↑iL):
Dominant lever for specific power; high ΔNPV for both aviation and trucking. - Improved catalysts (↑αc with reduced Pt loading):
Dual benefit: better performance and lower cost → high manufacturer ΔNPV. - Lifetime and durability improvements:
Largest ΔNPV component for trucking; meaningful for aviation. - Lightweight and low-cost bipolar plates:
Moderate but reliable ΔNPV for both domains; synergistic across all designs.
¶ 9. List of R&D Projects and Prototypes
To achieve the strategic FOM targets in Section 5, system specific power, system power density, durability, and cost must all be improved. Improvements in stack specific power and power density directly raise these system-level metrics, while higher efficiency reduces heat rejection requirements, allowing for smaller, lighter cooling systems. Similarly, higher-temperature tolerance reduces BoP mass, volume, and complexity.
However, these improvements depend on several assumptions—particularly around achievable limiting current, water management, thermal stability, and catalyst durability—that carry uncertainty. Many of the modeled gains rely on optimistic boundary conditions (e.g., ideal humidification, minimal flooding, aggressive membrane thinning, or high catalyst utilization), and the roadmap should acknowledge that deviations from these assumptions can meaningfully affect the achievable FOMs.
¶ Primary Improvement Levers
Based on the technical model and sensitivity analysis, the strongest levers for increasing overall efficiency are:
- increasing stack temperature (↑T),
- increasing the cathode charge-transfer coefficient (↑αc → ↓activation losses), and
- decreasing concentration losses (↑iL).
The strongest levers for increasing stack specific power are:
- increasing limiting current (↑iL),
- increasing cathode charge-transfer (↑αc), and
- reducing bipolar-plate density and thickness.
These levers come with risks. For example, thinner plates and membranes reduce mass but may compromise mechanical stability, durability under cycling, and manufacturability. Likewise, improvements in iL and αc depend heavily on water and thermal management.
¶ LT-PEMFC vs. HT-PEMFC Considerations
Low-temperature PEMFCs (LT-PEMFCs), which currently have higher TRL, cannot reliably operate above ~100°C because their MEAs require humidification with liquid water to maintain membrane conductivity. High-temperature PEMFCs (HT-PEMFCs), in contrast, can operate above water’s boiling point (commercial systems operate up to ~180°C), allowing dry operation, simplified BoP, and less stringent cooling. However, they face durability challenges due to high temperatures and acidic environments associated with PBI-based membranes doped with phosphoric acid, and they currently exhibit worse polarization curves than state-of-the-art LT-PEMFCs.
Both approaches carry integration and certification risks. LT-PEMFCs require complex BoP with humidification and advanced thermal management, while HT-PEMFCs require new materials, new manufacturing routes, and new validation procedures. These risks must be recognized as gating constraints on the roadmap, and they may influence prioritization even if the technical model indicates strong leverage from ↑T or ↑αc.
¶ Cross-Cutting R&D Needs
In all cases, cross-cutting advances in MEA performance (reducing activation and concentration losses, increasing iL), material cost reduction (lower Pt loading), and durability will benefit both approaches. Achieving these improvements requires parallel advances in manufacturing reproducibility, catalyst–ionomer interfacial control, and membrane stability under variable humidity and transient operation—areas where current industry capability remains limited.
If higher-temperature operation is to be pursued—because of its strong leverage on αc and efficiency—the program would necessarily pivot to HT-PEMFCs, which require distinct MEA materials and different BoP architectures. This pivot carries risk, and explicit decision criteria should be defined (e.g., minimum polarization performance and durability thresholds).
The portfolio therefore considers both strategies.
¶ PEM Key FOM Improvements Resulting from Component Improvements
¶ Strategy 1: Improve Low-Temperature (~80°C) PEMFC MEAs
¶ Objectives
Catalysts: Develop cathode/anode catalysts that reduce platinum use while increasing the effective cathode charge-transfer coefficient (αc) to improve specific power, power density, and efficiency. Target 20,000-hour durability.
Membranes: Create thinner, chemically robust proton-exchange membranes with higher proton conductivity and improved stability under humidity cycling.
Acknowledged risks:
Membrane thinning increases vulnerability to pinholes and mechanical failure; improved αc requires stable catalyst–ionomer interfaces that are not yet well understood; durability under aircraft-specific cycling remains unproven.
¶ Impact on Technical Model Parameters
- ↑αc → decreases activation overpotential (ηact) and improves performance at all current densities.
- ↑iL through improved mass transport achieved via higher diffusivity (Deff) and reduced diffusion-layer thickness (δdiff).
However, these improvements depend on maintaining correct water management and thermal uniformity—both unresolved challenges in high-power-density aircraft applications.
¶ Key Activities
- Engineer catalyst–ionomer interfaces for higher ORR kinetics.
- Synthesize reinforced or composite PEMs (Nafion alternatives).
- Perform durability tests under humidity and temperature cycling.
- Integrate new materials into full MEAs and test under 50–100°C conditions.
¶ Success Metrics
- αc as high as possible, given other requirements
- Membrane thickness ≤ 40 µm
- +25% improvement in iL relative to baseline
- Durability > 20,000 h
(Note: these targets assume controlled water management and ideal gas transport; deviations may shift required values.)
¶ Strategy 2: Track High-Temperature (≥160°C) PEMFC Development
Monitor HT-PEMFC progress over the next 2–3 years as industry and research programs advance phosphoric-acid–doped PBI membranes, high-temperature catalysts, and simplified dry BoP architectures. If HT-PEMFC polarization curves and durability improve sufficiently—or if high-temperature operation becomes strategically advantageous based on our model sensitivity (especially strong leverage from ↑T and ↑αc)—the program should be prepared to pivot toward HT-PEMFC R&D.
Acknowledged risks:
HT-PEMFC technology has uncertain durability trajectories, limited manufacturing maturity, and unproven certification pathways for aviation. Pivot criteria should therefore be explicit and based on achievable, not theoretical, MEA performance trends.
¶ Strategy 3: Improved BoP Architecture and Components to Reduce System Mass and Volume
As shown in the plot, even with these PEMFC improvements, the strategic target for power density has not been reached. This technical model assumes a volume fraction for BoP components based on current technology levels. To meet the strategic targets, BoP mass and volume must improve in addition to stack performance.
This is an especially high-risk area for aviation: compressors, humidifiers, thermal management systems, sensors, and control electronics all contribute significant mass and complexity, and their performance does not scale linearly with stack improvements.
To take advantage of architectural benefits and synergies, the third R&D focus is on collaborating with end-users such as ZeroAvia and producing demonstrator fuel-cell systems to power real airplanes. Early demonstrators will also surface integration risks, certification challenges, and operational boundary conditions that are not captured in the current model.
¶ 10. Key Publications, Presentations and Patents
¶ 10.1 Publications & Presentations
Proton Exchange Membrane Fuel Cells: Advances and Challenges (Téllez Cruz et al., 2021)
This study establishes the foundational understanding of PEM fuel cell membranes from a materials perspective. It examines how polymer chemistry and composite reinforcement affect proton conductivity, chemical stability, and water retention—three parameters that govern overall energy conversion efficiency. Comparing Nafion, sulfonated polyetherketones (SPEEK), and polybenzimidazole (PBI), the authors demonstrate the tradeoff between conductivity and durability. Their findings underscore the importance of advanced membranes incorporating inorganic or graphene fillers to sustain conductivity with less humidification, reducing the load on the balance of plant systems.
Direct Deposition of Proton Exchange Membranes Enabling High Performance Hydrogen Fuel Cells (Klingele et al., 2015)
Building on the material insights from Téllez Cruz et al., this paper focuses on fabrication innovation. The authors employ inkjet printing to integrate membranes directly with gas diffusion electrodes, creating thinner, tightly bonded layers that achieve power densities above 4 W/cm²—over twice those of conventional Nafion assemblies. This method minimizes interfacial resistance and advances mass and thermal efficiency, aligning with our design objective of reducing stack mass and contact losses.
Designing the Next Generation of Proton Exchange Membrane Fuel Cells (Jiao et al., 2021)
Jiao and colleagues expand the focus to system integration, presenting quantitative performance goals of 6 kW L⁻¹ by 2030 and 9 kW L⁻¹ by 2040. Their work identifies component-level innovations, including gradient pore gas diffusion layers, integrated bipolar plate structures, and enhanced heat and water management that are required to meet these targets. The paper unites materials and fabrication principles into a cohesive system vision, arguing that future PEMFCs must integrate structure, materials, and control subsystems holistically.
Relevance to the Roadmap:
Together, these studies define a sequence of technological insight that progresses from molecular understanding to system coordination. Téllez Cruz establishes the chemical foundations of PEM performance, Klingele translates them into manufacturable interfaces, and Jiao extends the scope to system architecture. This chain of development reinforces our roadmap’s design structure matrix (DSM), linking material design, fabrication, and control integration.
¶ 10.2 Patents
Fuel Cell Power System (US 20250192207 A1, Caterpillar Inc., 2025)
This patent integrates PEM stack design, electronic control, and cooling management within a unified architecture. The system maintains membrane stability under variable loads by coordinating coolant flow, hydrogen supply, and electrical output through a control-driven integration framework. It embodies the multidomain coupling proposed by Jiao et al. (2021), merging electrochemical, thermal, and control subsystems into a cohesive platform.
Fuel Cell Stack (US 11764387 B2, Audi AG and Volkswagen AG, 2023)
This patent focuses on mechanical reliability through a configurable compression and retensioning system that maintains uniform contact pressure across the membrane electrode assemblies (MEAs) and bipolar plates. Its adaptive design counters “stack breathing,” the dimensional changes caused by humidity and temperature fluctuations that typically degrade PEM performance. By stabilizing mechanical contact, thermal conduction, and electrical continuity, the design extends PEMFC lifespan and resilience under variable loads.
Relevance to the Roadmap:
The Caterpillar and Audi systems translate the research progression into practical engineering solutions. The Caterpillar design integrates the stack, cooling, and control functions into a coordinated system that manages thermal and electrical stability in real time. The Audi architecture focuses on structural adaptability, maintaining consistent compression and sealing under changing humidity and temperature conditions. Within our DSM, these two technologies directly correspond to the Stack–Cooling–Control and Stack–Structural Durability couplings, demonstrating how industrial designs are converging toward the same cross-domain coordination principles defined in our roadmap.
¶ 11. Technology Strategy Statement
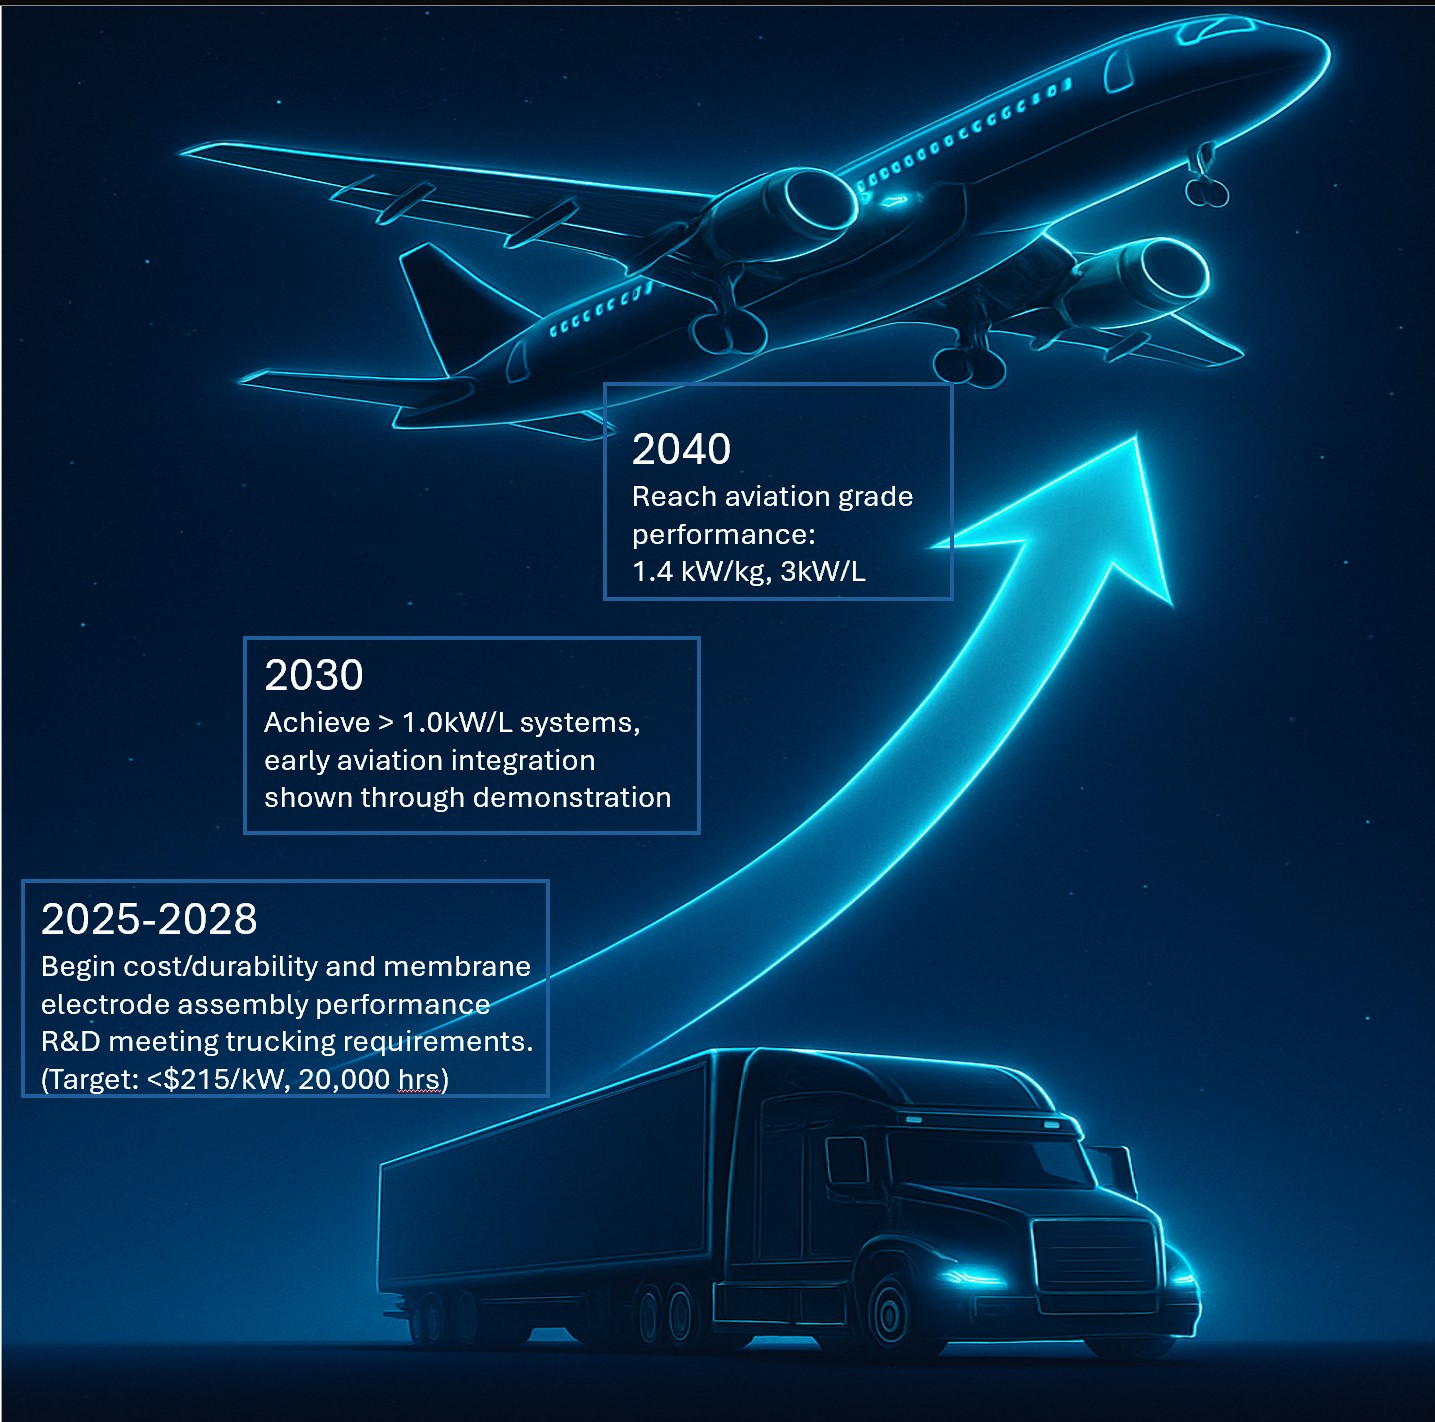
The strategy is to develop hydrogen PEM fuel cell systems that can meet the performance and cost demands of both long-haul trucking and narrow-body commercial aircraft. Initial development focuses on trucking by reducing system cost toward ~$215/kW and achieving durability of ~20,000 hours under heavy-duty operating conditions. As the technology matures, the targets shift toward aviation requirements, aiming for a system-level specific power of ~1.4 kW/kg and a power density of ~3 kW/L, benchmarked against the A320neo and its PW1100G engine. Improving efficiency will also reduce waste-heat rejection needs, supporting integration into aircraft where thermal management is costly in terms of drag. The cost and durability improvements necessary for the long-haul trucking application will also benefit the aircraft application, providing a lower-risk stepping stone for initial R&D. This strategy establishes a coherent path from ground-transport readiness to aviation-grade performance.
¶ 12. Roadmap Maturity Assessment (optional)
¶ 13. References
- Téllez-Cruz, M. M., Meza-León, A., Pérez-Pérez, L. M., & Ramos-Sánchez, G. (2021). Proton exchange membrane fuel cells: Advances and challenges. Polymers, 13(18), 3064. ttps://doi.org/10.3390/polym13183064
- Klingele, J., Schmidt, T. J., & Papageorgopoulos, D. (2015). Direct deposition of proton exchange membranes enabling high-performance hydrogen fuel cells. Journal of Materials Chemistry A, 3(22), 11239–11245. https://doi.org/10.1039/c5ta01341k
- Jiao, K., Xuan, J., Du, Q., Bao, Z., Xie, B., Wang, B., Zhao, Y., Fan, L., Wang, H., Hou, Z., Huo, S., Brandon, N. P., Yin, Y., & Guiver, M. D. (2021). Designing the next generation of proton-exchange membrane fuel cells. Nature, 595(7867), 361–369. https://doi.org/10.1038/s41586-021-03482-7
- Sakaray, U., & Caterpillar Inc. (2025). Fuel cell power system. U.S. Patent Application US 20250192207 A1. United States Patent and Trademark Office. https://ppubs.uspto.gov/pubwebapp/
- Jilani, A., & Voosani Krishna, S. S. (2023). Fuel cell stack. U.S. Patent US 11764387 B2. United States Patent and Trademark Office. https://ppubs.uspto.gov/pubwebapp/
- O’Hayre, Ryan P., et al. Fuel Cell Fundamentals. Third edition., Wiley, 2016.
- Datta, A. (2021). PEM Fuel Cell Model for Conceptual Design of Hydrogen eVTOL Aircraft.