¶ Technology Roadmap Sections and Deliverables
This is a technology roadmap for:
- 3WEC - Wave Energy Conversion
This is a “Level 3” roadmap, indicating that it addresses a technology at the subsystem level. Higher level roadmaps related to this subject would address technology progression at the market level (AUV Docking Station) and product level (Electricity Generation & Management).
¶ Roadmap Overview
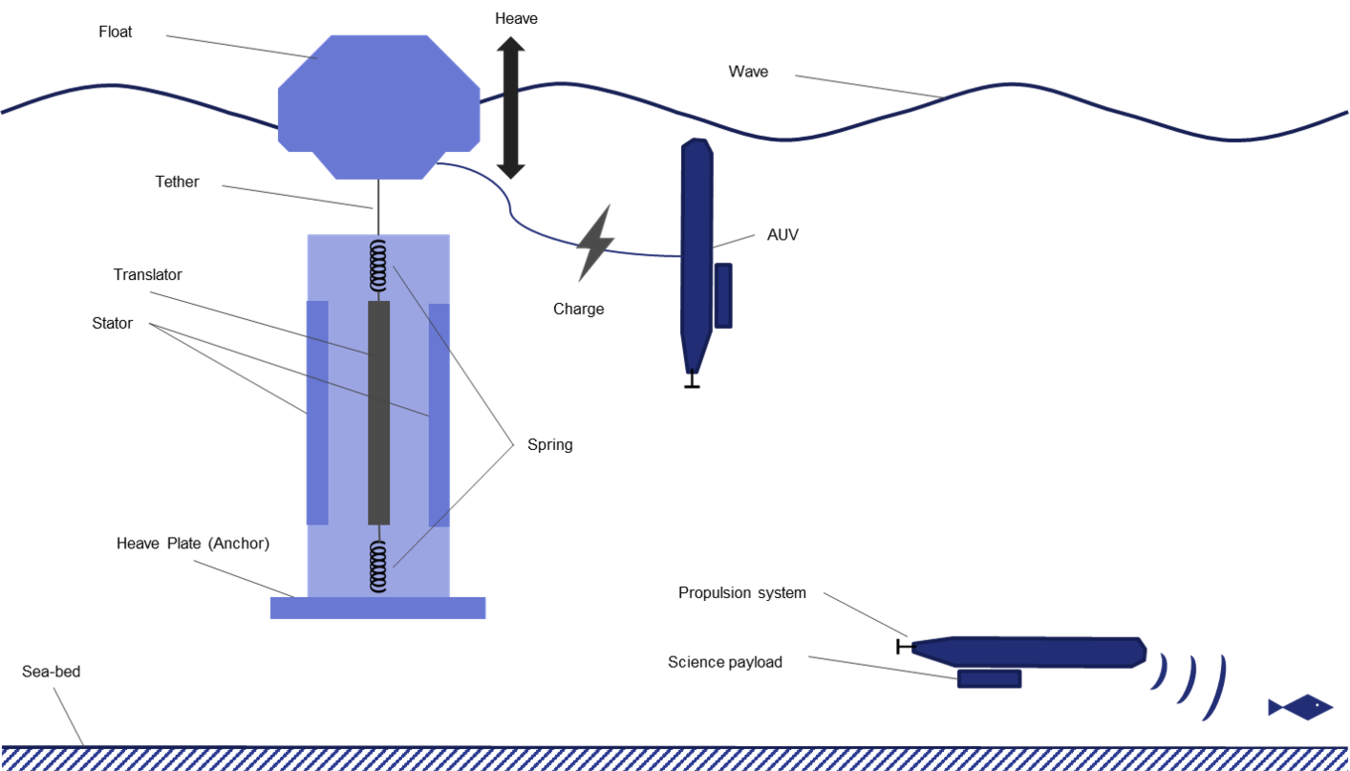
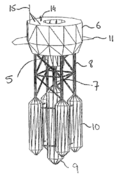
Autonomous underwater vehicles (AUVs) are essential tools for ocean exploration. Despite advancements in battery and other energy storage technologies, power availability remains a key limiting factor for many AUVs. Power constraints limit payload capabilities, reduce design trade space for key functions like communication and navigation, and restrict the reach of AUVs by reducing mission durations and preventing access to remote areas of the ocean. Despite its austerity, the ocean offers abundant sources of environmental energy in the form of wave energy. In contrast with wind or solar energy, wave energy is always available, which makes it a good candidate for enabling persistent AUV operations. While wave energy is a rich research area, much of the research is focused on near-shore wave energy converters (WECs). Many of these designs are incompatible with a mobile, untethered WEC. Moreover, most WECs are designed with grid power in mind and thus have completely different use cases. We are developing heaving buoy WECs as our wave power source for AUVs.
Why heaving buoy wave energy converters? Heaving buoy WECs have the added advantage of being portable, have smaller form factors, and do not require anchoring to the ocean floor.
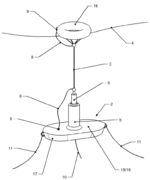
The figure below shows a notional autonomous maritime system that utilizes each of these energy sources to provide an in-situ power generation capability.
The basic process by which wave energy is converted into usable electricity can be divided into three parts: 1) wave energy conversion, which converts the motion of a wave into mechanical, pneumatic, or potential energy, 2) power take-off (PTO), which transforms converted energy into into useful mechanical energy, and 3) electricity generation, which transforms useful mechanical energy into electrical energy. The figure below depicts these steps.
Error creating thumbnail: File missing (as of Oct 2025)
Basic process of wave energy conversion<ref>Wave energy conversion and hydrodynamics modeling technologies: A review, Wanan Sheng</ref>
¶ Design Structure Matrix (DSM) Allocation
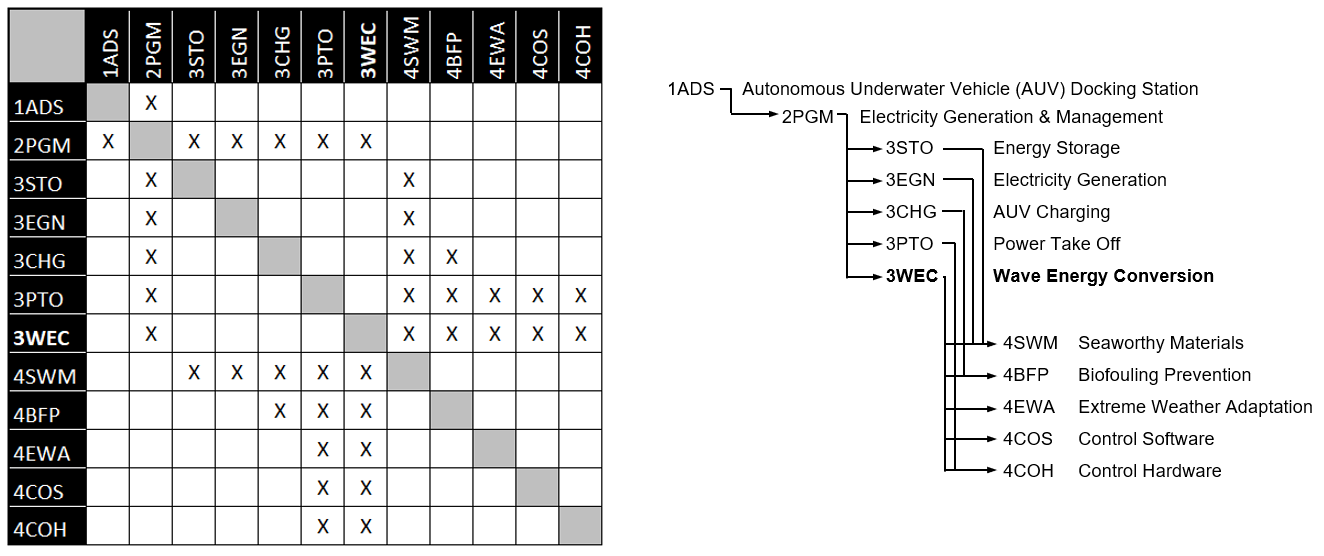
The 3WEC tree shown above reveals that wave energy conversion (3WEC) is an enabling technology for the Electricity Generation & Management (2PGM) subsystem on an AUV docking station (1ADS). 3WEC technology makes up the 2PGM subsystem along with with energy storage (3STO), electricity generation (3EGN), AUV recharging (3CHG), and power take off (3PTO). Enabling technologies for 3WEC are materials that can withstand the harsh ocean environment for long durations (4SWM), technologies which reduce and prevent biofouling (4BFP), design and operations techniques for adjusting to high energy events like storms (4EWA), and control software (4COS) and hardware (4COH) that optimize wave power conversion across a range of ocean conditions. Some of the 3WEC enabling technologies are shared with other Level 3 technologies, especially those having to do with operation in the ocean environment.
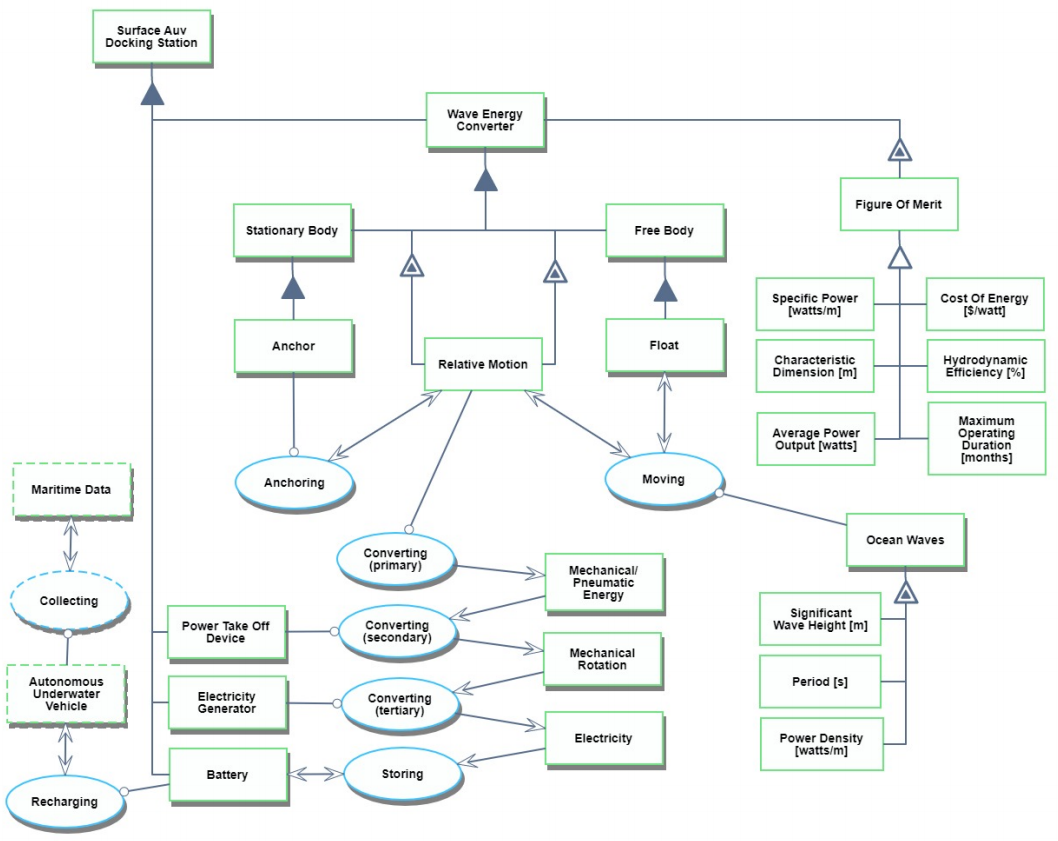
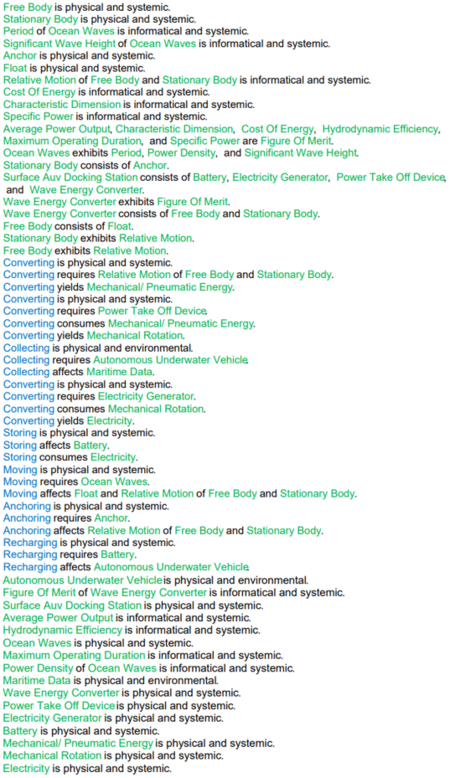
¶ Roadmap Model using OPM
The Object-Process Diagram (OPD) in the figure below shows how the 3WEC technology is related to the AUV docking station, and the broader persistent AUV system that docking station enables. The diagram focuses on the wave energy conversion process for a point absorber type of WEC, which at its most fundamental level relies on wave-induced relative motion between two components to generate a more useful form of energy, such as pneumatic or mechanical. This undergoes a secondary conversion process to generate mechanical rotation, which drives an electricity generator. Electrical energy is stored in a battery and used to recharge a persistent AUV, which has been collecting maritime data of interest in the vicinity of the surface docking station. Figures of merit (FOM) characterizing WEC technology are also shown, as well as the ocean wave characteristics that describe the amount of available wave power. The Object-Process Language (OPL) associated with the OPD is auto-generated and is shown to the right of the OPD. It reflects the same content as the OPD in narrative form.
¶ Figures of Merit
Wave energy is primarily governed by the following variables:
- ρ: Water density [kg/m3]
- g: Acceleration due to gravity [m/s2]
- h: Wave height [m]
- Te: Wave period [s]
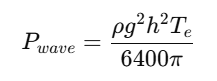
Wave power is governed by the following equation:
The following table shows figures of merit (FOM) that can be used to compare wave energy converters for AUVs. Each FOM provides unique information: specific power summarizes the proportion of power to WEC size, hydrodynamic efficiency provides information about how much the technology can still be improved before the theoretical maximum is reached, maximum operating duration reveals how readily the technology can support persistent AUV operations, and LCOE allows us to compare WECs with other energy sources.
| Figure of Merit | Units | Description |
|---|---|---|
| Specific Power | [W/m] | Average power output normalized by characteristic dimension of WEC |
| Average Power Output | [W] | Average power output of WEC |
| Characteristic Dimension | [m] | Size of WEC as it relates to drag |
| Hydrodynamic Efficiency | [%] | Fraction of wave energy converted into mechanical energy |
| Maximum Operating Duration | [days] | Average number of days WEC can continuously harvest energy for |
| Levelized Cost of Energy (LCOE) | [$/W] | Lifetime cost of one WEC divided by lifetime energy production |
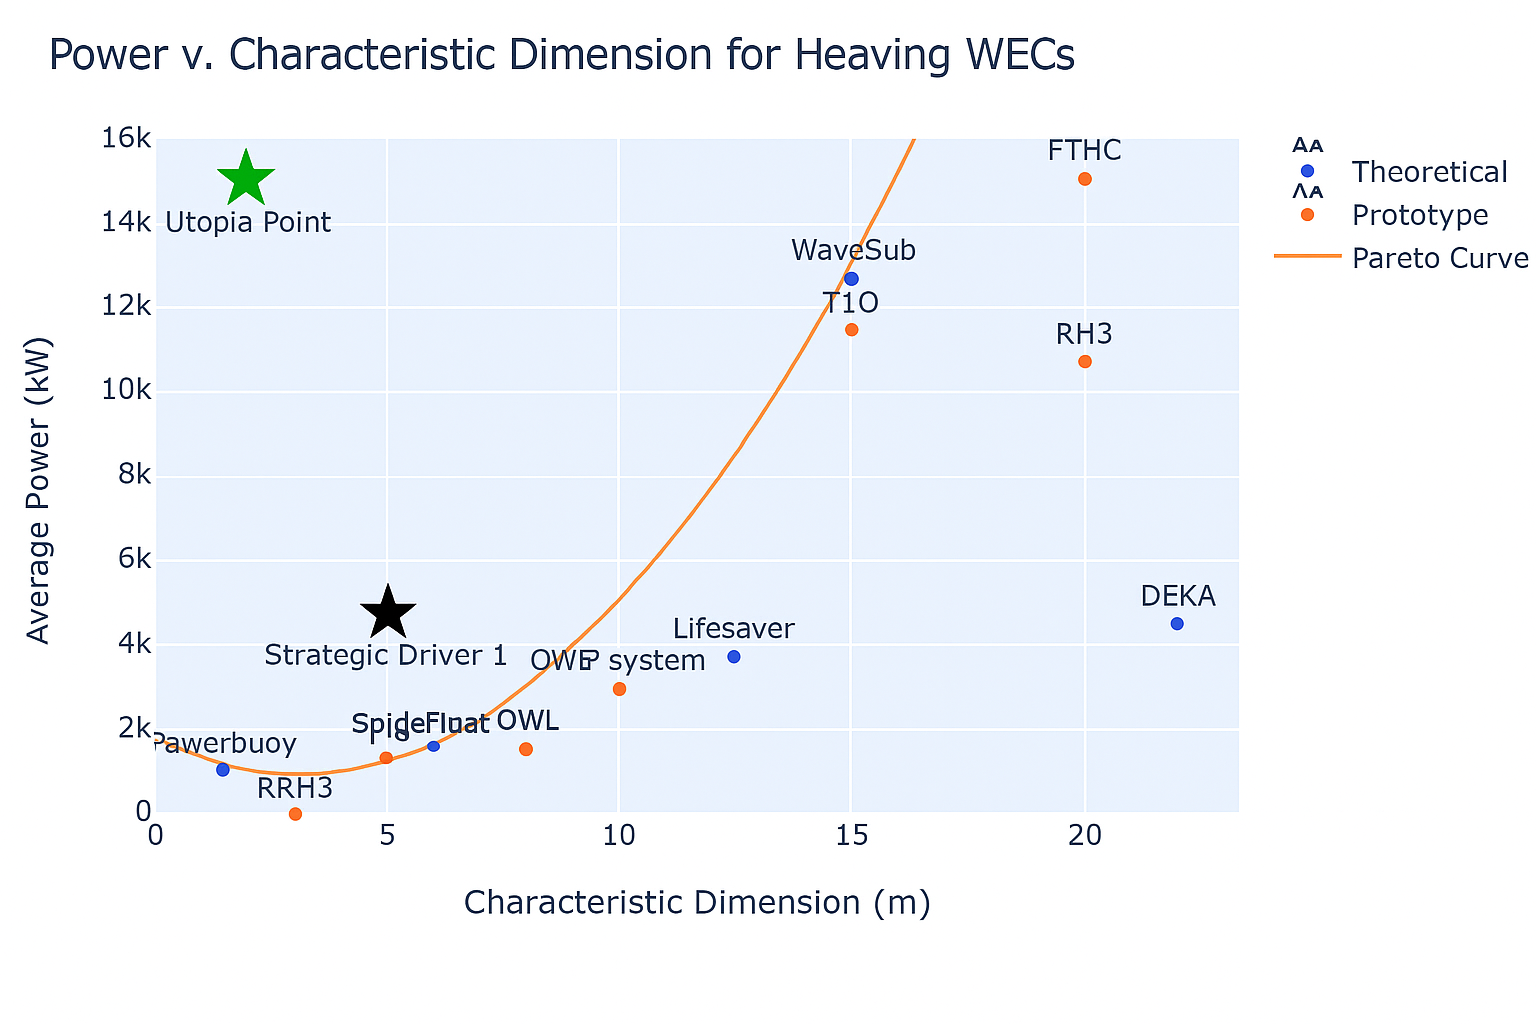
The following plot shows improvements in specific power of various wave energy converters. There is not an obvious trend, although there is some improvement over time. Some qualifications to this chart:
- By normalizing power by characteristic dimension, we lose some information. Some specific powers appear large because of very small characteristic dimensions and vice versa. Moreover, scaling a power-efficient WEC design is non-trivial. Data points that were misleading because of a small denominator were removed.
- The data points in red come from computer modeling of WEC designs, and have not been demonstrated in an ocean environment.
- Power is only one of many relevant FOMs. Many of these nascent WEC companies are likely concerned with other considerations, such as manufacturing costs, reliability, and marketing.

¶ Alignment with Company Strategic Drivers
The following table shows our strategic drivers and the alignment of those drivers with this roadmap.
| Number | Strategic driver | Targets and Alignment |
|---|---|---|
| 1 | Deliver a portable offshore wave energy conversion system with enough capacity to sustain large-class (>500kg) AUV operations. |
Target: Generate an average of 5kW of electrical power using a device with a maximum characteristic width of 5m. We expect that a persistent AUV capable of long-duration meaningful maritime data collection will be in the largest class of AUV. The 5m characteristic width constraint was imposed based on an estimate of the largest size of device that could be transported and placed in the ocean environment without specialized equipment. The 5kW power target represents progression beyond the Pareto front for this technology, and is a rough estimation of the power required to continuously sustain two large-class AUVs using a single docking station and WEC. Increasing wave energy conversion efficiency at a deployable size is the focus of this roadmap, therefore this strategic driver is aligned with the technology roadmap. |
| 2 | Increase the quantity of data an AUV payload collects by increasing the operating-to-docking duty cycle rate. |
Target: AUV in collection operations 50% of the time. For a system comprised of one AUV associated with a single ocean surface docking station, AUV duty cycle depends on the rate of energy generation, the rate that energy can be transferred to an AUV when it is docked for energy replenishing, and the quantity of energy an AUV can store. This roadmap only addresses the rate of docking station power generation. Therefore, this strategic driver is aligned with the technology roadmap, but other technology development is required to fully achieve this strategic driver’s target. |
| 3 | To provide a system capable of continuous unattended operation to enable maritime data collection in remote oceanic regions with minimal support infrastructure. |
Target: 1 year of continuous autonomous operation. Our roadmap focuses on increasing the efficiency with which wave power can be converted to useful power. This objective will result in the incorporation of new wave energy transfer technologies that are untested over extended operations. Additionally, this roadmap does not address potential maritime-specific failure mechanisms like biofouling or extreme weather. The technology tree and associated DSM shown earlier in the roadmap described how the 4SWM, 4BFP, and 4EWA enabling technologies contribute to other Level 3 technologies adjacent to the 3WEC technology that is the focus of this roadmap. Improving these Level 4 technologies would contribute to increased reliability over a longer operating duration for all aspects of an AUV docking station, as they seek to counter degradation caused by the harsh ocean environment. Therefore, this strategic driver is not aligned with the technology roadmap. |
As the table shows, the roadmap for wave energy conversion technology is not sufficient by itself to enable a reliable offshore power source for long-duration unattended AUV maritime data collection operations.
¶ Positioning of Company vs. Competition
There are a wide variety of heaving buoy wave energy converters. The table below summarizes the key data points about each model. https://oceanpowertechnologies.com/pb3-powerbuoy/.
|
Error creating thumbnail: File missing (as of Oct 2025)
DEXA |
|
|
Error creating thumbnail: File missing (as of Oct 2025)
Wavebob |
| Name | Hydrodynamic Efficiency (%) | Characteristic Dimension (m) | Average Power (kW) | Year |
|---|---|---|---|---|
| Point Absorber | 14 | 125 | 28 | 2002 |
| DWP System | 20 | 10 | 3.2 | 2002 |
| AquaEnergy | 18 | 6 | 1.9 | 2004 |
| INRI/SEADOG | 19.25 | 5.7 | 1.9 | 2004 |
| Wavebob | 45.5 | 15 | 12.8 | 2004 |
| Small bottom-referenced heaving buoy (SBHB) | 3.75 | 3 | .2 | 2012 |
| Floating two-body heaving converter (FTHC) | 29.75 | 20 | 15 | 2012 |
| Bottom-fixed heave-buoy array (BHA) | 14.75 | 5 | 1.6 | 2012 |
| Floating heave-buoy array (FHA) | 9.75 | 8 | 3.2 | 2012 |
| Two-body heaving device (THD) | 25 | 15 | 11.6 | 2012 |
| Lifesaver | 12 | 12.5 | 3.9 | 2014 |
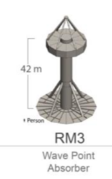
| RM3 | 16 | 20 | 11 | 2013 |
| DEXA | 8 | 22 | 4.6 | 2012 |
| Powerbuoy | 44 | 1.5 | 1.2 | 2017 |
Below, we can see two of our FOMs compared graphically. We show two series. The points in red reflect heaving WEC prototypes tested in actual ocean conditions, whereas the points in blue show mathematically modeled results. The two data series generally agree about the current performance of heaving WECs.
In accordance with strategic driver 1, we want to shift the Pareto front towards our Utopia point in the top left, where we get more power with a smaller form factor (lower characteristic dimension).
¶ Technical Model
¶ Overview
As is mentioned in the Roadmap Overview section, the basic process can be divided into three parts: 1) wave energy conversion, 2) power take-off (PTO), and 3) electricity generation. In this roadmap, we focus on the first process.
As will be shown later, the wave energy converted by the WEC is determined by the significant wave height and the wave energy period, which vary with the location and season, and the characteristic dimension, which is the length that wave passes. WECs can be broadly classified into the following categories: heaving device, overtopping device, oscillating water device, oscillating wave converter, and others. Each type of WEC includes those whose structures are fixed to the seabed or the shore, floating, and submerged in the water. By adding the secondary and tertiary conversion options to the above information Morphological Matrix and Tradespace are shown as follows. Again, the first two variables have varying expected values depending on location and season, and that the secondary and tertiary conversions are outside the scope of this roadmap.

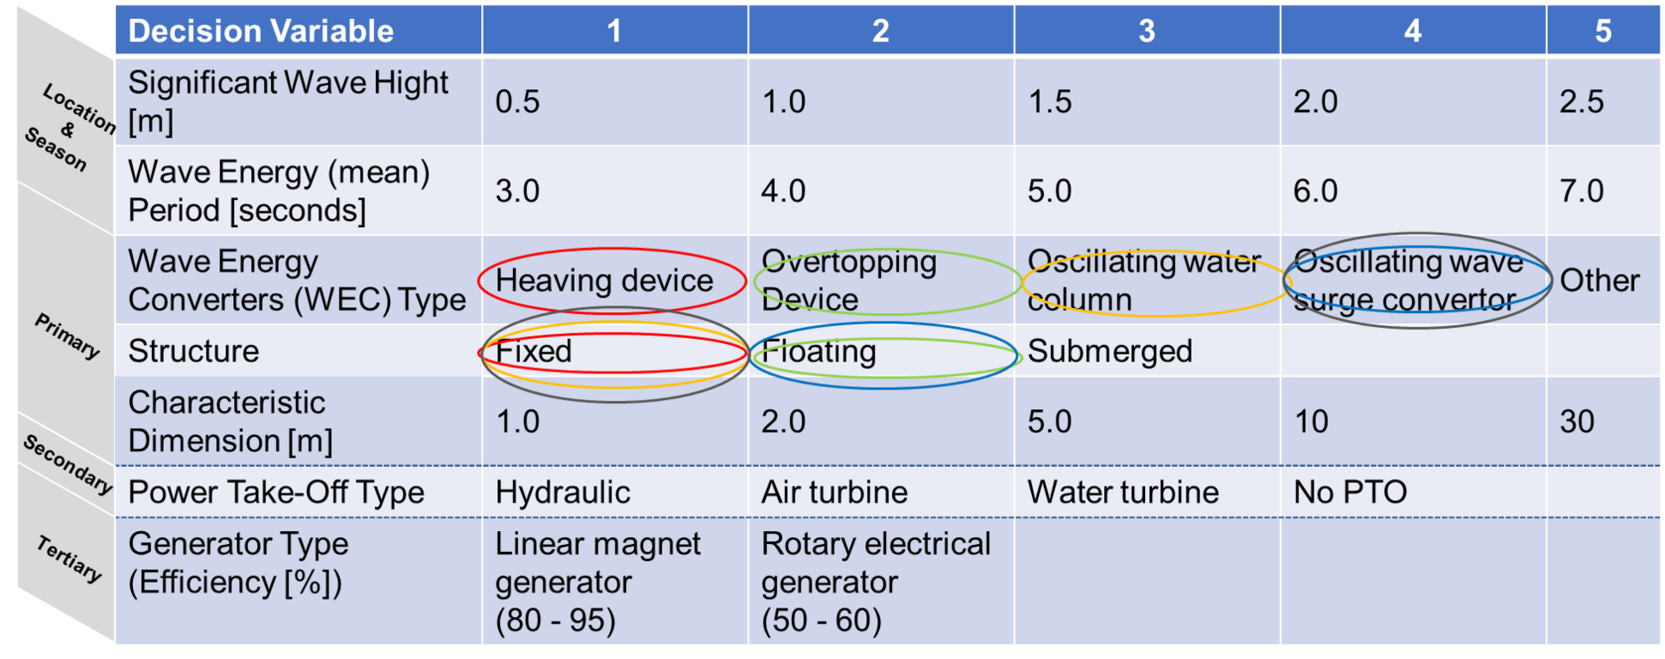
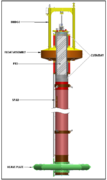
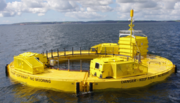
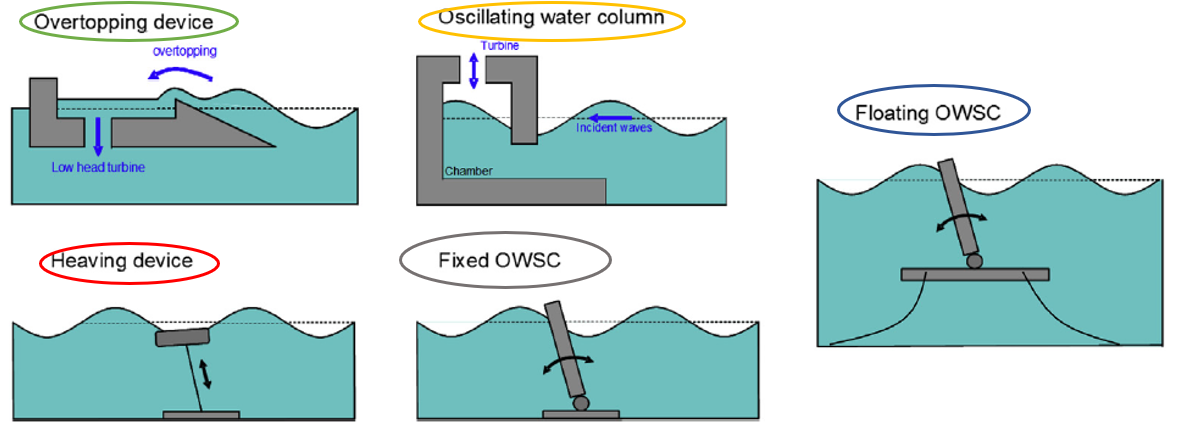
The image of each WEC type is as follows. The choices shown as ellipses in the matrix correspond to each type.
¶ Mathematical Modeling
Some important variables:
- B = Characteristic Dimension [m]
- A = Maximum Horizontal Cross-sectional Area of the WEC device [m^2]
- H = Significant Wave Hight [m]
- T = Wave Energy (mean) Period [seconds]
- η = Hydrodynamic Efficiency [%]
- ρ = Water Density [kg/m^3] (≈1000 kg/m^3 )
- g = Gravitational Constant [m/s^2] (≈ 9.81 m/s^2)
Key equations:
For heaving devices, the characteristic diameter is obtained by:
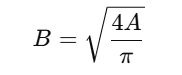
If the float is a vertical cylinder or a floating hemisphere, A is equal to its diameter.
According to the study, A. Pecher and J. Kofoed, Eds, Handbook of Ocean Wave Energy (Ocean Engineering and Oceanography), vol. 7. London, U.K.: Springer, 2017, ch. 3, pp. 43–80., the following equation is used to calculate omnidirectional wave power density in deep water from random seas:
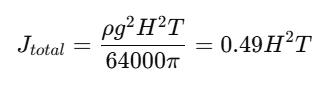
Where ρ = 1000, g = 9.81.
To calculate the amount of energy which can be taken out, converting efficiency is needed. According to the data obtained by the study<ref name="database" />, this value varies depending on the format of the WEC and hydrodynamic efficiency is approximated by the following equation:
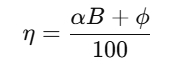
The coefficients affecting the energy conversion efficiency by WEC type differ as follows. As is shown in this table, α = 1.3 and φ = 5.6 for the heaving device.

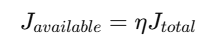
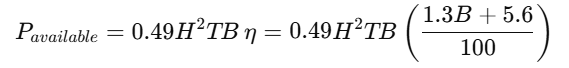
Using these valuables, available wave power density can be defined by:
Based on the results from the statistical analysis in the same source, the typical power performance for a given category of WEC can be estimated by using a characteristic dimension:
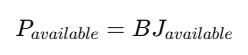
Assuming that we use the heaving device, which has a spherical floating device, the power converted by the WEC is given by:
¶ Sensitivity Analysis
Which parameters give us the greatest power increase? By performing sensitivity analysis on our power equation, we answer this question.
The power of a heaving body WEC is given by P(H,T,B,η) = 0.49H2TBη
The first order nature of our power equation suggests that power will be equally sensitive to the various parameters. Taking the gradient:

Let X0 represent standard assumptions about waves along with the characteristics of the Lifesaver device. Our normalized sensitivities are then given by
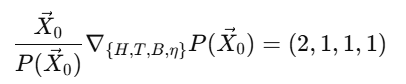
As expected, the linear terms all have a normalized sensitivity of 1; that is, a 1% increase in efficiency, wave period, or characteristic dimension corresponds to a 1% increase in power. The one quadratic term, wave height, has a normalized sensitivity of 2%.

¶ List of R&D Projects and Prototypes
¶ Summary
In wave power conversion, as described in the technical model, the power output is highly dependent on the state of the waves. In other words, it is highly dependent on changes in the height and period of the waves. The waves' characteristics change with the season, or the time even on the same day. Besides, the characteristics of waves vary greatly from region to region. To recharge the AUVs, a wave power generator needs to be installed in the AUVs' active area. Still, the designed wave generator characteristics are not always optimal for the waves in the region.
With this background, we will focus on an R&D project to achieve greater power output to match the wave characteristics to achieve greater efficiency of Strategic Driver#1.
Wave power is still an immature technology field, with few commercialized and publicly available information. Many WECs mentioned in the "Positioning of Company vs. Competition" section are mostly scaled-down prototypes or mathematical modeling values. Some have been canceled due to failure to obtain funding [1], even though the results were expected. This section will address the technical elements of the projects that are still underway and in which research is being attempted.
¶ R&D Projects and Prototypes
| R&D Project | Strategic Driver | Description | Relating project |
|---|---|---|---|
| R&D-1 Design Optimisation | #1 | To optimize the physical design | CETO Project [2] |
| R&D-2 Damping (Latching) Optimisation | #1,#2 | To optimize the movement of the WEC in accordance with the wave attributes | AWS Project [3][4], CETO Project [5], Corpower Ocean Project [6][7], WaveBoost Project [8] |
¶ R&D-1 Design Optimisation -CETO Project-
Demonstrators (TRL5 ->7)
The intention was to optimize for two values of WECs, maximum annual power generation and minimization of the levelised cost of energy (LCoE), to suit the sea area's characteristics (in this case, the Albany test site in Western Australia.) There are the variables used for optimization include buoy radius, height, and damping. For greater maximum annual power generation, the larger the radius and height, the better the result, which is not a useful result concerning cost. For LCoE, the results show that €20.9/MWh can be achieved with optimal design. However, this value doesn’t seem to be realized soon because LCoE for wave energy in 2030 estimated to be between €113-226/MWh.[9] and it is said that if LCoE is $120‒470/MWh for wave energy, it can be commercialized.[10]
Note that this study was conducted in imitation of the WEC model called CETO. Although the study was conducted independently of the developer, the results coincide with the next generation CETO (CETO6) parameters that have actually been designed. The development company has also publicly stated that they are optimizing the LCoE in the design of CETO.[11]
¶ R&D-2 Damping (Latching) Optimisation -Corpower Ocean Project-
Demonstrators (TRL6 ->7)
The period and height of the waves, like the wind, are not constant and vary greatly with the time of day and season. If WEC's range of motion and intensity of damping were held constant, the time available for efficient conversion to power in these changes would be short. There is also a higher risk of failure during storms and other emergencies. To solve these problems and increase the efficiency of power conversion, it is desirable to control the damping characteristics in accordance with the wave conditions.
A related project is Corpower Ocean's WEC. The company achieved a 27% increase in annual power generation and a reduction in LCoE of about 30% in its WaveBoost project, which ended in 2020. The lessons learned will be carried over as Corpower Ocean moves the project to the next step of demonstrating full-scale units.
¶ Project Milestone
Error creating thumbnail: File missing (as of Oct 2025)
Although research into converting wave energy to power has been conducted since the 1970s, few technologies have achieved commercialization by 2020 due to the complexity and cost. Even Pelamis, which was the world's first offshore wave energy device installed to generate electricity into a national grid in 2004 and was considered the closest to commercialization, went into administration in 2014 due to funding failure. [12][13]
There are many studies analyzing the method to improve the efficiency of WECs. Many of these studies, however, do not seem to reach full-scale testing. Or they tend to run into financial difficulties before they can be applied to prototypes; for WECs to be commercialized, they need not only academic support from universities and research institutions but also long-term financial support from governments. For example, in 2014, PowerBuoy secured its first offshore commercial order. Since fiscal 2002, a significant portion of their revenues has depended on government agencies. [14]
It should be noted that since charging the AUVs is the ultimate goal, the optimal way of charging the AUVs needs to be studied in parallel with improving the efficiency of the WECs.
¶ Financial Model
¶ Baseline Case
Our project’s financial model calculates the net present value (NPV) of the total project over an assumed 20-year project duration. The lack of public financial information in the wave energy sector coupled with the currently nonexistent wave-energy-for-AUV recharging market forced heavy reliance on estimates of realistic model parameters. When possible, model inputs were derived from reported information, but in some cases the inputs represent our best estimate without independent substantiation. The financial model is based on a scenario where our company designs and produces a single type of heaving wave energy convertor that is sold to an AUV recharging platform manufacturer to incorporate onto an open-ocean charging platform. While marketing, sales, and operation of the WEC and charging platform are assumed to be the responsibility of the AUV platform manufacturer and AUV operator, our company does assume responsibility for WEC maintenance and repair costs since repair cost liability is expected to be driving consideration for potential adopters of this unproven technology.
The financial model necessitated the creation of a customer demand model to reflect the change in WEC demand in response to changes in WEC power conversion performance and cost. Using a simple approach that assumes these are the only two factors that influence demand, a basic model for demand is given by:
Unit Demand = (Demand Factor)(Power Generation) − (Cost Factor)(Sales Price)
where the two different factors relate how much demand is influenced by unit price and WEC power conversion performance. Additional model inputs included:
- WEC efficiency of 12%, which is based on the Pareto front performance for a WEC with a characteristic width of 5m.
- Discount rate of 10%, which is based on a typical rate for a medium risk project.
- A mean time before failure of 0.5 years, which means each system must be repaired twice per year on average. Since these systems are expected to be deployed in remote locations, each repair is expected to cost $20,000 to account for the challenge of sending a repair team to a difficult-to-reach ocean location.
- Total program R&D cost of $20M, all expended during the first 5 years of the project with 10% spent in Year 1, 15% spent in Year 2 & 5, and 30% spent in Year 3 & 4. The magnitude of spending is inferred from limited public reporting of past and present WEC development efforts, while the per-year spread reflects a standard technology development effort. These R&D costs are required to produce an initial commercial product with performance at today's Pareto front. We did not consider federal grants, but these might be available given growing interest in renewable energy and would partially offset development costs.
- Initial production cost of $2M per unit, and initial sales price of $2.1M. We assumed a production learning rate of 5% and a constant sales price over the period.
A complete list of baseline model inputs is shown in the table below.
| Model Parameter | Value | Rationale |
|---|---|---|
| Discount Rate [%] | 10% | Moderate Risk Project |
| Average wave power density [kW/m] | 20 | Estimated worldwide average |
| Characteristic width [m] | 5.0 | Target conversion device size based on company strategic drivers |
| Power conversion efficiency [%] | 12% | Expected efficiency for this characteristic width based on technical model |
| Power take-off efficiency [%] | 80% | Estimated for linear power take-off technique |
| Electricity generation efficiency [%] | 40% | Estimated for hydraulic turbine generator |
| Mean time before failure [years] | 0.5 | Estimated |
| Repair cost [$1000] | $20 | Estimated |
| Starting unit production cost [$1000] | $2,000 | Estimated based on limited reporting for current prototype designs |
| Starting sales price [$1000] | $2,100 | Estimated based on production cost value |
| Operating life [years] | 5 | Estimated |
| Production learning rate [% per year] | 5.0% | Estimated. Large gains expected due to newness of WEC production sector. |
| Demand factor [-] | 2 | Estimated |
| Cost factor [-] | 0.001 | Estimated |
| Annual market growth [% per year] | 10% | Estimated based on Department of Energy market growth projection |
| Total R&D cost [$1000] | $20,000 | Estimate based on current reporting for current WEC prototypes |
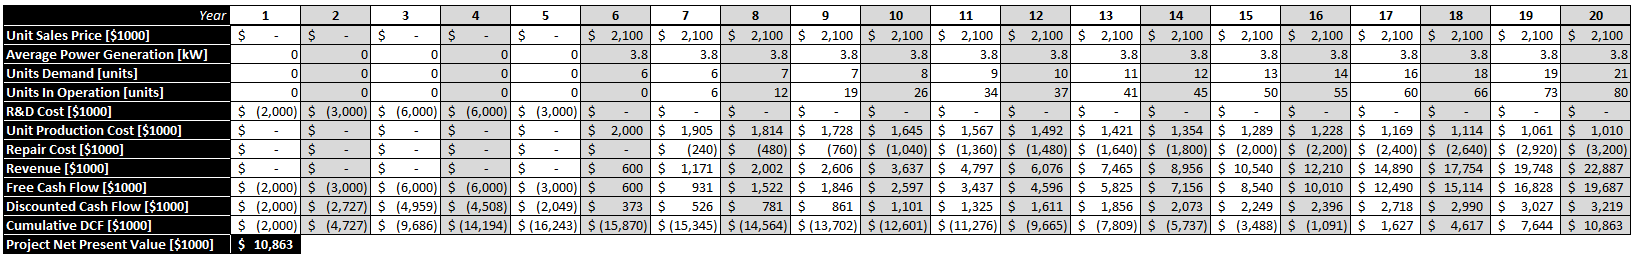
These model inputs result in the plot below, which shows development cost, revenue, repair/maintenance cost, discounted cash flow, and the cumulative discounted cash flow over the 20-year project period. The financial model reveals that while the project begins to generate annual profit in year 6, the project does not generate positive cumulative NPV until year 17. At the end of the 20-year timeline the project has a total NPV of $10.8M.

The table below shows the detailed free cash flow balance sheet for the baseline case.
¶ Improved Performance Through R&D Case
The same financial model was used to calculate the projected monetary benefit of pursuing the technology maturation efforts described in the R&D Projects section of the roadmap. Those projects required additional R&D spending in Year 6-11 and resulted in the following changes to model inputs from the baseline financial case:
- Increased R&D spending by $50M. $20M was distributed evenly in Years 6-8, and $30M was distributed evenly in Years 9-11.
- Power generation efficiency was increased by 5% (to 17%) starting in Year 12 following the completion of the additional R&D. This efficiency increase results in a 5.4kW power generation capability, which is consistent with our company's strategic goal of achieving 5kW of average power production for a device with a 5m characteristic width.
The resulting project financial performance and corresponding balance sheet table are shown below.


The financial performance plot shows that the additional R&D in Years 6-11 results in worse initial cashflow, but higher cumulative NPV by the time the project concludes due to increased power conversion efficiency increasing power output and resulting in more unit sales. The updated balance sheet that includes the additional R&D projects shows that pursuing the R&D projects is predicted to result in a cumulative NPV of $22.2M, an increase of $11.3M from the baseline case. The increased performance that results from the enhanced R&D scope results in a total sales of 255 WECs over the life of the project, an increase of 78 units from the baseline case. The magnitude of NPV increase from the increased R&D case confirms that the selected additional R&D projects are financially worthwhile.
¶ Technology Strategy Statement
Our target is to develop a new heaving wave energy converter that can support continuous AUV operations in any ocean environment by 2030. To achieve our average electric power target of 5 kW and our size constraint of smaller than 5 m in characteristic dimension, we will invest in two R&D projects. The first is a design optimization project where we optimize physical characteristics of the WEC to maximize power generation and minimize levelised cost of energy. The second project is a damping optimization project in which we optimize the WEC to adapt to changing ocean conditions. Through these two projects, we anticipate a 5% gain in hydrodynamic efficiency. By investing approximately $95 million in R&D, we expect to double our NPV.

¶ Key Publications and Patents
Key publications and patents are listed below. The listed publications were used to understand current wave energy convertor performance, review modeling methodologies for AUV recharging using wave energy, and determine how this roadmap's technology could be used in a market application. The patents listed represent the first document instance of this type of wave energy conversion technology, as well as several incremental improvement features to increase efficiency and utility.
¶ Publications
- Babarit, Aurélien. "A database of capture width ratio of wave energy converters." Renewable Energy 80 (2015): 610-628. Executive Summary: Comprehensive compilation of wave energy convertor performance scaled to device characteristic width. Establishes wave energy extraction performance by convertor type and device characteristic width using data regression.
- Aderinto, Tunde, and Hua Li. "Review on power performance and efficiency of wave energy converters." Energies 12.22 (2019): 4329. Executive Summary: Review and comparison of reported hydrodynamic efficiencies and power performance of wave energy convertors across a range of convertor types and sizes. The analysis concludes that the oscillating body type of wave energy convertor currently has the highest efficiencies, and that efficiency can be further improved by matching the conversion system dynamics to local wave conditions to maximize power output.
- Driscol, Blake P., L. Andrew Gish, and Ryan G. Coe. "A Scoping Study to Determine the Location-Specific WEC Threshold Size for Wave-Powered AUV Recharging." IEEE Journal of Oceanic Engineering (2020). Executive Summary: Feasibility analysis of wave energy in a AUV recharging application using reported wave energy convertor performance and observed ocean wave energy data. The study concludes there is sufficient available wave energy in the studied locations to support AUV recharging operations using modestly-sized wave energy convertors.
- LiVecchi, A., et al. "Powering the blue economy; exploring opportunities for marine renewable energy in maritime markets." US Department of Energy, Office of Energy Efficiency and Renewable Energy. Washington, DC (2019): 207. Executive Summary: United States Department of Energy report exploring scientific, military, and commercial markets where marine energy may be uniquely suited to meet market needs. The report explores opportunities and potential applications of one such market—underwater vehicle recharging—which is expected to double by 2022.
¶ Patents
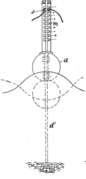
- Gehre, Max. (1899). US Patent No US628457A. “Device for producing electric currents at sea by the action of waves” available on https://patents.google.com/patent/US628457A. Executive Summary: The first known US patent for a heaving point absorber type of wave energy convertor that generates electricity at the wave site. The simple device uses a simple float to induce electrical current through one-dimensional motion between a series of magnets and an induction coil.
- Dick, William, (2001). US Patent No US6857266B2. “Wave energy convertor” available on https://patents.google.com/patent/US6857266B2. Executive Summary: The described device is for a typical heaving point absorber type of wave energy convertor that includes the novel feature of being able to variably tune the oscillation device to match the wave period, a key current research area of wave energy conversion technology.
- Foster, Graham and Stockman, Gareth, (2009). US Patent No US8826658B2. “Wave powered generator” available on https://patents.google.com/patent/US8826658B2. Executive Summary: A patent for a point absorber type of wave energy conversion device that incorporates features that make each convertor more easily transportable, such as an inflatable float and non-rigid connectors between pieces of the device.
|
|
|