Optical Payload for Space Situational Awareness in Geosynchronous Orbit
Technology Roadmap Sections and Deliverables
This is a technology roadmap for:
- 3GEOSSA - Optical Payload for Space Situational Awareness in Geosynchronous Orbit
Space situational awareness (SSA)—detecting, identifying, and tracking resident space objects (RSOs) as they orbit the Earth—requires observing many RSOs, using the measurements deduced from those observations to determine the orbit of each object, and then using those determined orbits to identify objects again in the future, while further improving their orbital parameters. Emerging space actors about to develop and launch their first GEO satellites may not find it feasible to develop a new ground-based optical telescope to contribute to global space situational awareness. They could, however, contribute excellent SSA observations for the sliver of the GEO belt that they intend to occupy with their satellite upon successful launch. The new space actor could plan to add a small, optical sensor to its GEO satellite designed to monitor the satellite’s vicinity during its operational lifetime and report its observations either to the public or an international space object catalog. This roadmap is exploring related technologies.
Roadmap Overview
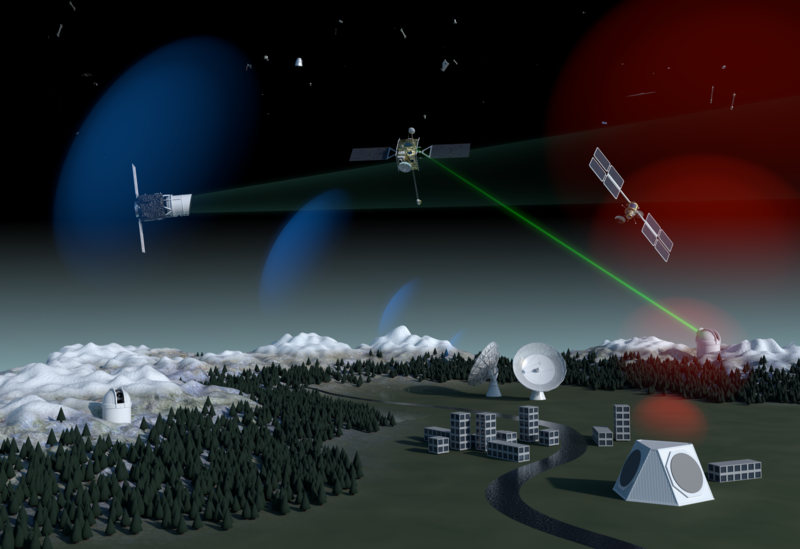
Artist's impression of various SSA systems comprising a full SSA architecture.<ref>“Space Surveillance and Tracking - SST Segment.” Accessed October 1, 2020. https://www.esa.int/Safety_Security/Space_Surveillance_and_Tracking_-_SST_Segment. </ref>
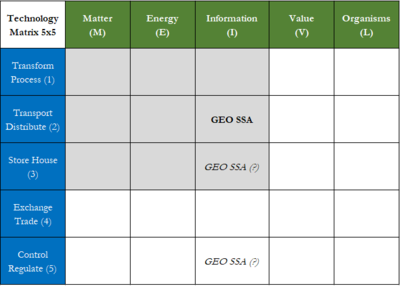
5x5 Technology Matrix showing the position of 3GEOSSA.
Our technology roadmap concept—a low-cost space situational awareness sensor that could be integrated into a geostationary (GEO) satellite bus—was motivated by one particular research question: How can an emerging space actor contribute to space situational awareness in the geosynchronous region by launching just one satellite to GEO?
Space situational awareness (SSA)—detecting, identifying, and tracking resident space objects (RSOs) as they orbit the Earth—requires observing many RSOs, using the measurements deduced from those observations to determine the orbit of each object, and then using those determined orbits to identify objects again in the future, while further improving their orbital parameters. Comprehensive SSA results in knowing where all RSOs of some minimum size are at a given time and where they’re going, which results in a reasonably accurate assessment of the likelihood of collision between two RSOs. The collision of two satellites typically results in catastrophic damage to both RSOs involved and the creation of thousands of pieces of space debris, uniformly unfavorable results for all space actors in the orbital regime in which the collision occurred.
SSA systems generate RSO observations using a variety of sensors: including ground- and space-based optical telescopes and radar systems. SSA in GEO, specifically, has historically been pursued using optical, ground-based telescopes, as part of broader systems maintained by the space actors that have contributed the most number of RSOs to the near-Earth space environment: the United States and Russia. Since SSA is critical to maintaining a sustainable GEO environment, improving SSA in GEO is the interest of all space actors, even those in their earliest stages.
A relatively nascent space actor—one in the early stages of planning its first GEO launch—may not find it feasible to develop a new ground-based optical telescope to contribute to global space situational awareness. They could, however, contribute excellent SSA observations for the sliver of the GEO belt that they intend to occupy with their satellite upon successful launch. The new space actor could plan to add a small, optical sensor to its GEO satellite designed to monitor the satellite’s vicinity during its operational lifetime and report its observations either to the public or an international space object catalog.
Comprehensive Technology Roadmap for 3GEOSSA
Design Structure Matrix (DSM) Allocation
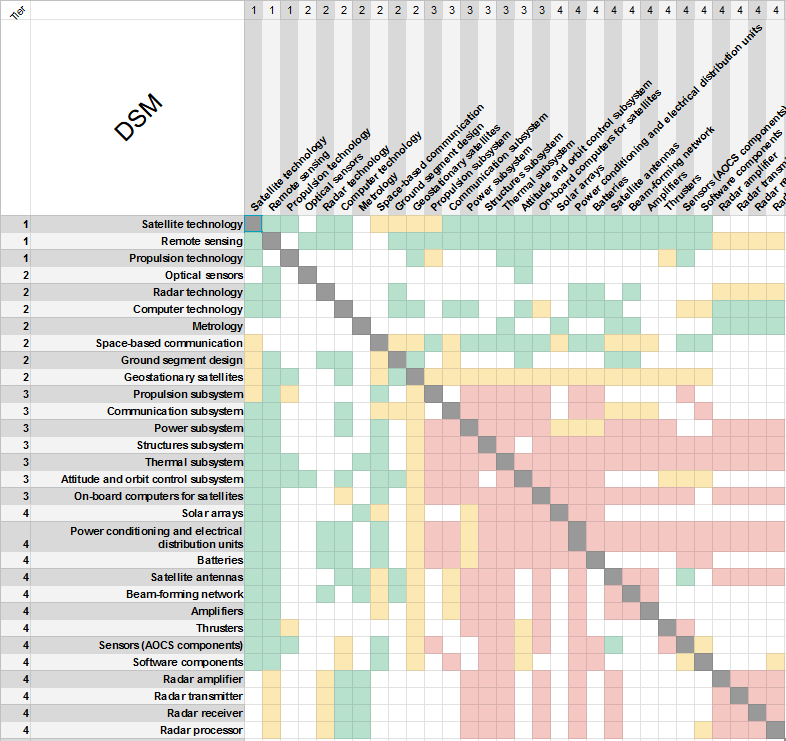
The detailed DSM shows connections between the various technologies comprising our SSA payload (marked with green), as well as hierarchical relationships between technologies and objects (yellow), and physical relationships between components or subsystems (red).
The key level-1 technologies from which SSA derives are satellite technology and remote sensing. The DSM shows a strong interconnection between the various technologies which enable advanced satellite payloads and the coupled nature of the various systems which comprise a remote sensing satellite tasked with SSA/SST.
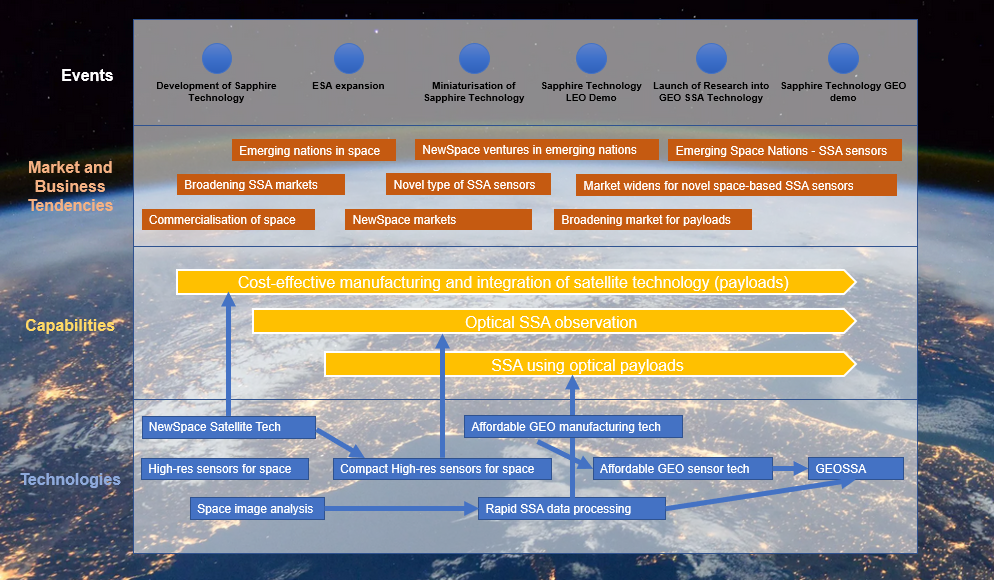
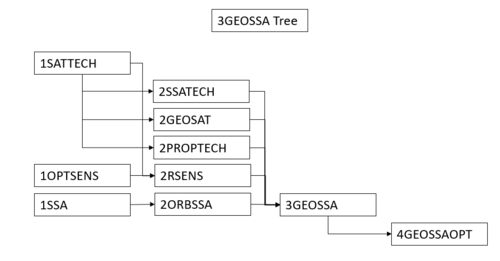
The tree highlights the key relationships in the DSM from which the 3GEOSSA technology can be derived as well as the objects which derive from our technology.
Roadmap Model using OPM
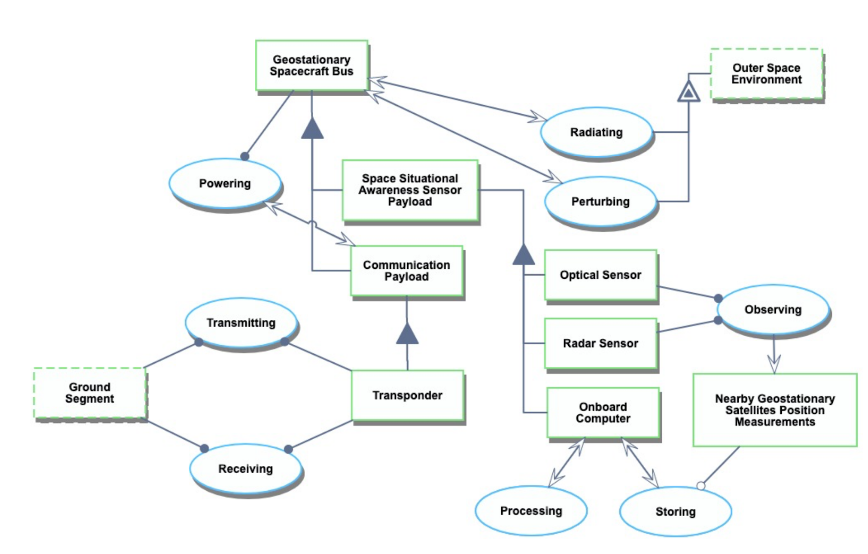
The Object-Process-Diagram (OPD) of a space-based SST-system flown on a GEO satellite is shown below.
Figures of Merit
Although there are standard Figures of Merit (FOMs) for optical sensors and radar systems in general, such as objective lens aperture [m] and signal-to-noise ratio, this specific technology—detecting nearby satellites in GEO—could be better measured by others. The table below describes several of these potential FOMs in greater detail, including their appropriate units.
| Figure of Merit | Units | Description |
|---|---|---|
| Spatial resolution at GEO | m | The physical distance that corresponds to one pixel of an optical image for GEO object observations; that is, the minimum separation distance between objects in GEO such that the sensor can detect two unique objects |
| Unit cost | $ | The cost of producing one on-orbit SSA sensor that could be integrated into a GEO satellite bus |
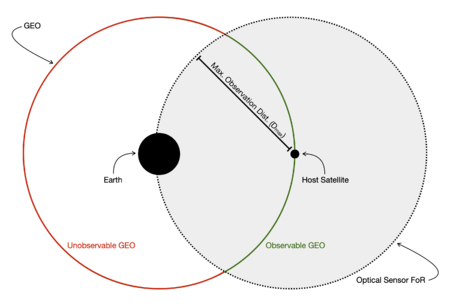
| Nominal GEO Field of Regard | # of orbital slots in view | The portion of the geostationary belt that the sensor could possibly observe (i.e. the GEO region, measured number of orbital slots) that aren't blocked by the Earth or its atmosphere from the perspective of the sensor); see Figure 4 |
| Minimum object size for detection | cm | The smallest object that the sensor could detect at GEO; directly related to spatial resolution |
| Exposure time | s | How long the space object must be observed before a measurement is taken |
| Readout time | s | How long it takes the on-board computer to report a detected satellite |
| CCD resolution | px | The number of pixels in each image created by the sensor |
| Field of view | sq. degrees | The angular size of the sensor's instantaneous field of view; not to be confused with the field of regard (the field of regard is limited by masking effects, the field of view is limited by telescope properties such as aperture and focal length) |
| Number of sensors required for full coverage | # | How many sensors are required to observe the entire geostationary belt instantaneously |
| Latency | s | The delay between when a nearby satellite is detected and when that information is communicated to the ground segment |
Let’s consider two FOMs from the table above in greater detail.
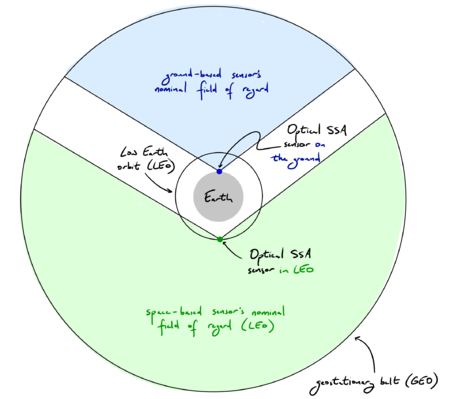
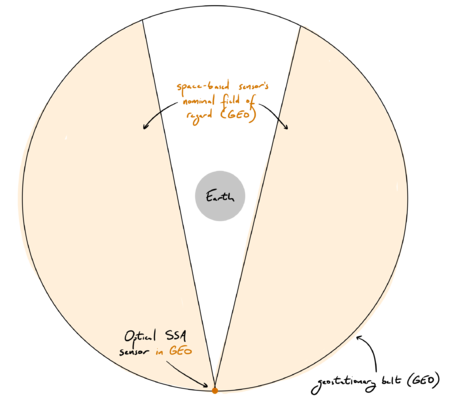
The nominal GEO field of regard, measured in number of orbital slots, describes the portion of the geostationary belt that the sensor could possibly observe from its vantage point. The top of Figure 4 shows the nominal field of regard for a ground-based optical SSA sensor and a space-based optical SSA sensor placed in equatorial LEO. Due to masking limitations (a masking angle of roughly 30 degrees is shown for illustrative purposes), a ground-based optical SSA sensor can only observe a minority of the 3,600 orbital slots in GEO. Due to the nature of the geostationary belt—in which each orbital slot’s position stays fixed relative to the Earth’s surface—a ground-based optical SSA sensor observes the same orbital slots over time. Although a space-based optical SSA sensor placed in LEO can observe a greater portion of the GEO belt, more than half of it, it too is limited due to masking constraints from the Earth and its atmosphere. Unlike a ground-based sensor, a LEO-based sensor observes different orbital slots over time, since their positions are not fixed with respect to the LEO sensor’s inertial reference frame. The bottom of Figure 4 shows the nominal field of regard for a space-based optical SSA sensor placed in GEO. Although an SSA sensor in GEO can observe a much greater fraction of the 3,600 orbital slots, it observes the GEO belt at vastly different distances, ranging from 0 m to nearly twice the geostationary radius. To account for the distance between the sensor and the satellites it’s observing, let’s consider the spatial resolution, a different figure of merit.
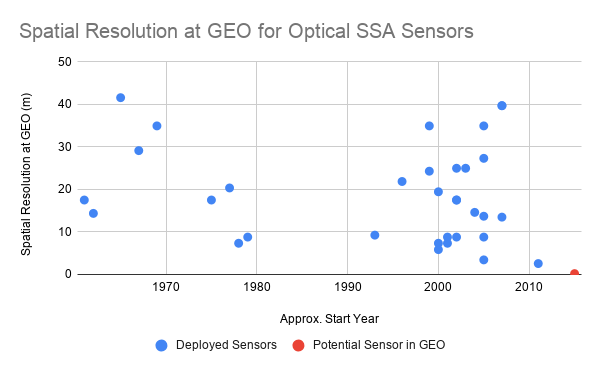
The spatial resolution at GEO, measured in meters, refers to the physical distance that corresponds to one pixel of an optical image created by an SSA sensor, that is, the minimum separation distance between two objects in GEO such that the sensor can detect two unique objects instead of one; a critical capability for SSA in GEO. The spatial resolution at GEO is defined as follows:
where f is the distance between the sensor and the object it is observing, is the wavelength of light being measured, and D is the diameter of the objective lens’ aperture. Throughout the history of space situational awareness, optical SSA sensors with various apertures have been used to detect space objects. Figure 6 describes the spatial resolution at GEO for many of these systems, assuming that they are placed on the equator at sea level. The United States, which maintains the U.S. Space Surveillance Network—a robust collection of optical telescopes and radar systems—has achieved relatively constant spatial resolution over time, as shown in blue in Figure 6. Non-U.S. entities, including both foreign governments and private companies, have developed more optical SSA sensors relatively recently, and enjoyed an improvement in spatial resolution at GEO. A SSA sensor in GEO, could observe objects at very close distances—fractions of an orbital slot. The figure below shows a potential GEO-based SSA sensors’ spatial resolution when detecting objects 50 km away (i.e. observing its direct neighbors in the same orbital slot and those nearby). Since this technology has not yet been developed and previous optical systems show only a gradual improvement in spatial resolution over time (if any), optical SSA sensing in GEO is likely in the “incubation” stage, as described in Figure 4-15 of the course text.
Both of these figures of merit have physical limits: you can’t observe more than all the GEO orbital slots and you can’t achieve a spatial resolution of exactly 0 meters (but you can get close!).
Alignment of Strategic Drivers
| Number | Strategic Driver | Alignment and Targets |
|---|---|---|
| 1 | To develop a commercially available SST sensor which can contribute to the broadening of SST capabilities of emerging space nations at a CAPEX of Xm dollars. | The roadmap aims at developing a compact sensor similar to that flown on the Sapphire spacecraft but at a cost of Xm dollars allowing emerging space nations to fly this sensor on various missions. Therefore the roadmap is in alignment with this driver. |
| 2 | To develop SST technologies with key FoMs contributing to the utility of SST instruments enhanced and enable the acquisition of higher quality SST data. | The aim of the roadmap is to develop an SST instrument which has a spatial resolution higher than 0.09m and a field of regard higher thank 0.98. Therefore this would allow data acquisition at qualities above the current state of the art systems leading to higher utility. Therefore the roadmap is in alignment with this driver. |
| 3 | To develop SST technology which can be flown on the first Hungarian geostationary satellite by 2024 and which can be marketed to other emerging space nations. | The target of the roadmap is to develop a novel, state of the art and affordable SST sensor by 2022. Therefore the roadmap is in alignment with this driver. |
Positioning: Company vs. Competition
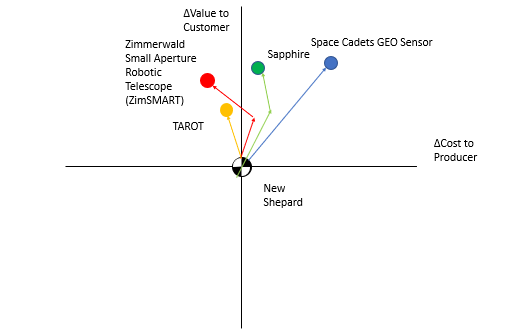
The positioning shows that the development of the proposed SST technology would provide the customer high value compared to competitors, due to its compact nature and low cost whilst meeting high FoM values. The cost to the technology producers, however, may be higher than competitors' due to the new mechanisms and design reconfigurations that may be required to adapt previous optical sensor payloads—like the one on board the Sapphire satellite—for flight on a GEO host satellite.
Technical Model
To develop a technical model of our optical SSA payload technology, we must relate the most critical FoMs discussed in the previous assignment to one another in a quantitative mathematical expression. The first step for developing this mathematical expression, which we’ll call the technology’s utility, is to consider which FoMs contribute to the technology’s ability to track space objects at low cost and which ones detract from it. See the table below for a short list of our system’s most critical FoMs, their corresponding units, and whether or not they contribute (“✔”) or detract (“✘”) from the technology’s utility:
| Critical FoM | Units | Effect on Utility |
|---|---|---|
| Spatial resolution at GEO (Δl) | m | ✘ |
| Fraction of GEO visible with one sensor over 24 hours (FoR) | none | ✔ |
| Mass (M) | kg | ✘ |
| Average Power (P) | W | ✘ |
What makes an FoM contribute or detract from the technology’s utility? In this case, the only FoM that contributes to the technology’s utility, the fraction of GEO visible with one sensor over 24 hours (known as the field of regard or FoR), is associated with the system’s SSA capabilities. Wider FoRs contribute more comprehensive observations of space objects to an SSA system. You may be wondering, doesn’t spatial resolution at GEO also contribute to SSA capabilities by providing more precise space object observations? Why doesn’t it have a “✔” indicator in the third column of the above table? While better spatial resolution at GEO certainly contributes the technology’s utility, better resolution is associated with lower values of Δl, making higher that FoM actually detract more from the technology’s utility as it increases. Similarly, the mass and power FoMs also detract from the technology’s utility since they are directly associated with the costs of space operations, where more demanding requirements lead to higher operational costs. Unlike other SSA systems, which are ground-based, our technology is space-based, making it subject to the typical constraints of space operations, including mass, power, and volume. Both for simplicity and the sake of mirroring the FoM discussion in the relevant literature, we have chosen to only consider mass and power as the critical FoMs that detract from the technology’s utility.
Using the above table, we can write a simple mathematical expression for the technology’s utility, U:
where Δl is the spatial resolution at GEO (measured in meters), F is the FoR (a unitless figure between 0 and 1), M is the mass requirement of the system (measured in kilograms), and P is the average power required (measured in watts). The units of this technical model can be written:
To get a better understanding of how the variables in our system affect the technology’s utility, let’s express the first two FoMs listed in the above table as a function of the system’s variables:
where f is the distance between the sensor and the object it is observing, λ is the wavelength of light being measured, D is the diameter of the objective lens, D_max is the optical sensor’s maximum observation distance, and R is the host satellite’s orbital radius.
Re-writing the utility function using these two expanded FoMs gives us:
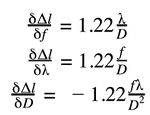
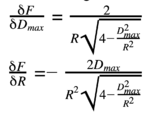
To conduct a sensitivity analysis on both of these expanded FoMs, we must calculate the partial derivative of each one with respect to each of its variables. Let’s start with the spatial resolution at GEO FoM:
And now let’s do the same thing for the field of regard FoM:
In order to produce a normalized “tornado” chart, we’ll first need to plug in some nominal values for each of the variables in the previous five equations. See the table below for these values and where they came from.
| Variable | Notation | Value | Reference |
|---|---|---|---|
| Distance between the sensor and the object it is observing | f | 20,000 m | Allan Scott, et al. (2014) / The median observation distance of the Sapphire optical sensor payload |
| Wavelength | λ | 560 nm | The median wavelength of the visible light spectrum |
| Diameter of the Objective Lens | D | 0.15 m | Michael S. Felten, et al. (2018) |
| The optical sensor’s maximum observation distance | D_max | 40,000 km | Allan Scott, et al. (2014) |
| Orbital radius of the host satellite | R | 42,164 km | Geostationary orbital radius |
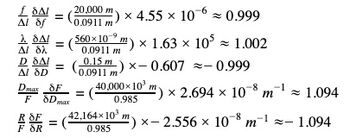
Now let’s plug these values into each of the partial derivatives listed above, beginning with the spatial resolution FoM:
And now let’s do the same thing for the field of regard FoM:
Before we can normalize these partial derivatives and make our tornado charts, we must first calculate each FoM’s nominal value using the contents of the above table:
Now we can normalize each partial derivative:
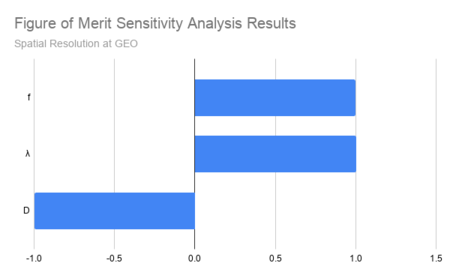
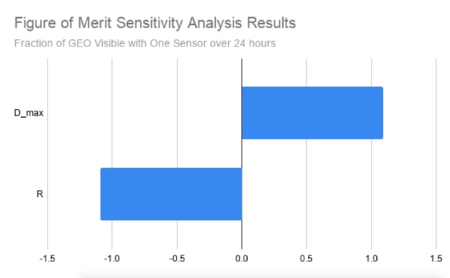
And make two tornado charts, one for each FoM:
Patent and Publication Review
Our search for key patents and publications related to the development of an optical SSA payload for a GEO satellite began with an exploration of the kinds of space-based SSA systems that have already been designed and patented that use satellites in the geosynchronous region. As we learned during the research process for Assignment 2, the U.S. Space Surveillance Network (SSN) already features four dedicated SSA satellites in the geosynchronous region as part of the Geosynchronous Space Situational Awareness Program (GSSAP). While the GSSAP satellites’ orbital characteristics—which do not appear to be patented—are excellent for observing the GEO belt, the satellites themselves are not precisely in geostationary orbit, which is a requirement for our SSA payload technology. Can any patented SSA satellite system designs depend on host satellites in precisely GEO orbit?
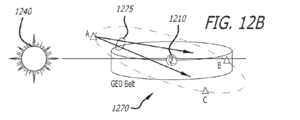
In 2018, a U.S. patent titled “Inclined Super-GEO Orbit for Improved Space-Surveillance” was issued to the Boeing Company.<ref>David R. Gerwe, et al., Inclined Super-GEO Orbit for Improved Space-Surveillance, US Patent US 9,908,640 B2, filed August 31, 2015, and issued March 6, 2018.</ref> The patent described how a satellite with non-zero inclination orbiting at an altitude greater than that of the geostationary belt could use raster scanning to observe the entire sunlit GEO environment and contribute to a broader space situational awareness mission. See Figure P1 (labeled Fig. 12B in the patent documentation) for an illustration of the patented design. Due to the orbiting altitude of the patented system, however, deploying this architecture would likely require a dedicated mission. It could not be mounted on a traditional GEO satellite, which typically has near-zero inclination and an altitude of approximately 35,780 km.
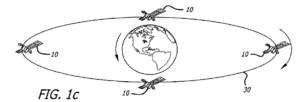
Another patent—“System and Method for Observing a Satellite Using a Satellite in Retrograde Orbit” by Ian Robinson and assigned to the Raytheon Company in 2012—describes how a system of satellites at GEO altitude could observe the rest of the GEO environment efficiently. Robinson described a system of N satellites equally spaced in retrograde geosynchronous orbit.<ref>Ian Robinson, System and Method for Observing a Satellite Using a Satellite in Retrograde Orbit, US Patent US 8,090,312 B2, filed October 3, 2006, and issued January 3, 2012.</ref> Each satellite in this constellation would transit the entire GEO belt twice per day and thus briefly re-visit all prograde-orbit GEO satellites every 12/N hours with a relative velocity of approximately 6.1 km/sec. This high relative velocity enables the efficient use of radar systems to detect other satellites in GEO and over time, determine their precise orbits. Figure P2 (labeled Fig. 1c in the patent documentation) is an illustration of the proposed sensor architecture for N=4 satellites.
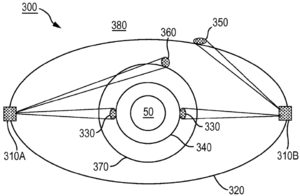
Although Robinson’s 2012 patented design depends on a system of satellites at GEO altitude—a more realistic option for a multi-objective mission than Gerwe’s patent described earlier—does an excellent job surveying the entire GEO population with a variable revisit rate, its retrograde orbit design almost certainly requires a dedicated satellite system, since traditional GEO missions rely on prograde orbits. Additionally, this design is much better suited for radar sensing as opposed to optical sensing, since the relative velocity between the sensors and the objects they are sensing is so high. A year later, a second patent submitted by Robinson called "Satellite System Providing Optimal Space Situational Awareness" was issued to Raytheon. This system describes a system of two or more satellites again in retrograde GEO orbit that can observe both prograde GEO satellites (like the previous patent), but also all other satellites at altitudes of 300 km or greater, including those seen against the dark background of outer space and those seen in the foreground of both the lit and unlit surface of the Earth.<ref>Ian Robinson, Satellite System Providing Optimal Space Situational Awareness, US Patent US 8,511,614 B2, filed March 22, 2010, and issued August 20, 2013. </ref> Figure P3 describes this design.
Although Robinson’s second design again depends on retrograde GEO orbits—a prohibitive requirement for a traditional GEO satellite—it does illuminate the possibility of an SSA sensor onboard a prograde GEO satellite contributing to LEO SSA. When it comes to observing lower-altitude satellites, Robinson’s proposed design would perform well in both retrograde and prograde GEO orbit.
This patent search reveals the potential for a new SSA architecture that could feature our optical sensor payload technology: using an optical sensor on a host GEO satellite to observe both a portion of the GEO belt (the GEO satellite’s neighborhood) and the entirety of the LEO orbital regime. While this architecture cannot observe the entire GEO belt with a single sensor, it can still contribute to broader SSA data collection and perhaps be featured on more GEO satellites, which together can observe the entire belt.
After we completed this revealing patent search, we turned our attention towards publications that could shed light on both SSA system architecture, like the patents, but also how an optical SSA sensor could be miniaturized so that it does not require a dedicated satellite mission, but instead could be included as a small payload on a host satellite. What kind of apertures would be needed for a GEO-based SSA sensor? How does that compare to other space-based sensors that have already been deployed as part of the SSN?
One paper presented the results of an optimization process geared at identifying both the size and placement of GEO-based optical sensors for SSA such that they would most efficiently contribute to the coverage provided by the ground-based components of the SSN.<ref>Michael S. Felten, et al., “Optimization of Geosynchronous Space Situational Awareness Architectures Using Parallel Computation,” 19th Advanced Maui Optical and Space Surveillance Technologies Conference, Maui, Hawaii, 2018, 11-14 September.</ref> The paper concluded that 12 satellites in geosynchronous polar orbit with 0.15-meter aperture sensors were best suited to contribute to the SSN. Although the orbital architecture presented in these findings is incompatible with our technology’s requirements, the 0.15 m figure is helpful in providing a baseline for the size of the optical sensor’s aperture.
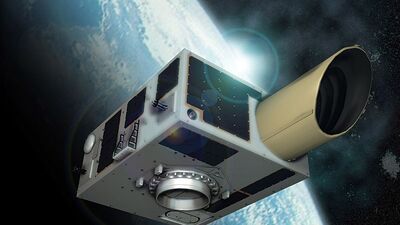
Perhaps the most fruitful result of our publications search was the discovery of published work by researchers from COM DEV Ltd., the Canadian company that built the optical sensor on board the Sapphire satellite. Sapphire—Canada’s first military satellite, launched in 2014—is a dedicated space surveillance satellite, providing space-based observations of the medium Earth orbit (MEO) and GEO environment as part of the SSN. One paper of great relevance to our work discussed the company’s development of a “flexible next-generation space-based SSA payload,” a high frame-rate optical sensor payload that could be used onboard a host satellite.<ref>Allan Scott, et al., “Flexible Next-Generation Space-Based SSA Payload,” 15th Advanced Maui Optical and Space Surveillance Technologies Conference, Maui, Hawaii, 2014, 9-12 September.</ref> The proposed payload uses electron-multiplying charge-coupled devices (EMCCDs) to achieve the same observational capabilities as the original Sapphire sensor at a lower mass. While the optical payload onboard Sapphire today has a mass of 28.5 kg, the proposed payload is only 15 kg. The mass reduction comes with a trade-off in power: the original optical sensor required just 14 W of average power, but the new one requires 30 W.
Together, the patent and publication search revealed a great deal about the state of the art surrounding the development of a GEO-based SSA optical payload. The patent environment suggests that placing an SSA sensor on a prograde-orbit GEO satellite could contribute to both region GEO SSA and comprehensive LEO SSA, while the publication environment suggests that a light-weight optical sensor payload with SSN-qualified detection capabilities is nearing technological readiness.
Financial Model
To quantify the financial value of our technology we have created a financial model considering key expenditures, including initial investment and other non-recurring costs, as well as expected variable costs and revenues from selling instruments. We then relied on the following two methods:
- Net present value of the investment, discounting future cash flows employing an industry standard value for cost of capital.
- To obtain accurate estimates for the expected manufacturing cost and revenues, we used Cost Estimate Relationships.
CER models from The New SMAD were used along with industry standard regression relationships used by NASA, called the NASA Instrument Cost Model (NICM).
We used COM DEV’s Sapphire’s satellite as a benchmark for the cost as well as the revenue estimations, due to similarities of the satellite’s payload to 3GEOSSA. The cost of the Sapphire project, including establishing a ground station as well as launch costs was $94 million. To obtain the price of the final payload, we calculated the non-recurring hardware development costs using the NICM relationship for optical instruments:
<math>Y=1.163 \cdot M^{0.328}\cdot P^{0.357}\cdot DR^{0.092}</math>
Where M stands for the instrument mass, P stands for the maximum instrument power in watts and DR stands for the total data rate in kbps.
Similar relationships were used to calculate wrap factors and the cost of the bus and the ground station. These were then deducted from the total cost of the project. The price obtained, $51 million is the assumed sales price of the instrument, i.e. we used this to obtain the future revenues once the payload is marketed. This, in addition to having been derived using the above methodology is comparable to the funding awarded to MDA to develop the instrument (minus the non-recurring hardware development costs). It is also in line with figures obtained using NICM relationships.
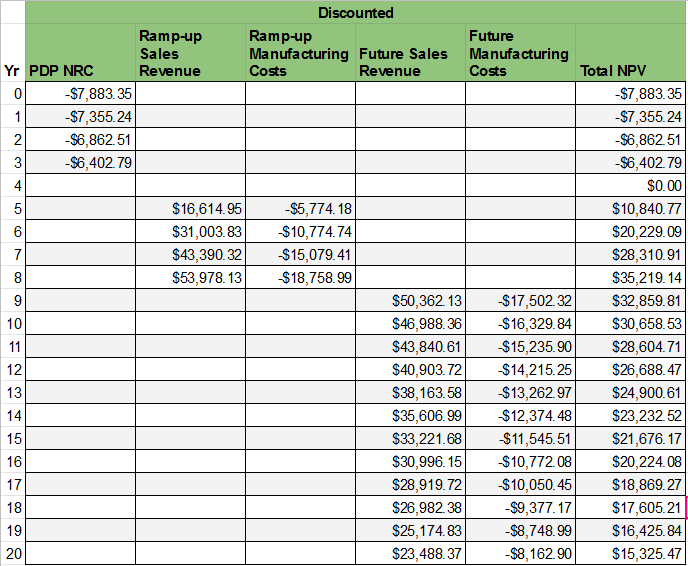
We then discounted future cash flows (both negative and positive) by a cost of capital of 7.8%. This led to the NPV table shown below.
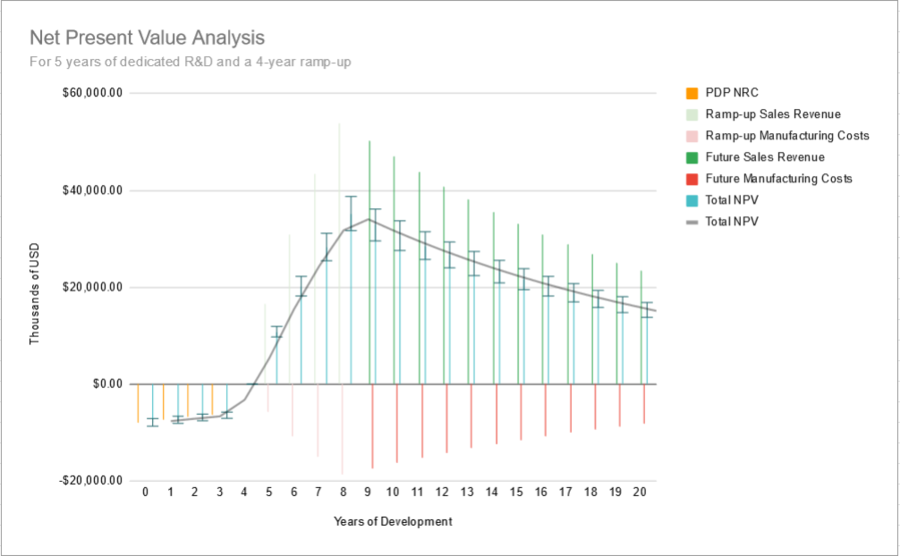
All future cash flows were plotted on a bar chart with a trendline showing the total NPV value.
List of R&D Projects
The technology at hand—a low-cost, low-mass optical sensor payload for taking space situational awareness observations onboard a geostationary satellite—requires one R&D projects and two associated demonstrator projects:
- An optical sensor payload miniaturization project with the target of lowering the mass, power, and pointing requirements of the optical sensor onboard the Canadian military’s Sapphire satellite, which was successfully deployed in 2014. This R&D project is already in development by COM DEV International, the Canadian satellite technology firm that developed the optical payload for Sapphire (see Scott, et al. 2014).
- A project demonstrating the miniaturized Sapphire payload’s performance onboard a host satellite in LEO. This demonstrator project represents a relatively low-cost opportunity to test the miniaturized optical sensor payload in space on a satellite not entirely dedicated to space situational awareness activities. Unlike a satellite in GEO, the host satellite could only offer periodic data dumps of the collected SSA data and therefore not provide near-real-time SSA observations. The LEO host satellite is intended to be launched in the year 2022.
- A project demonstrating the miniaturized Sapphire payload’s performance onboard a host satellite in GEO. This demonstrator project represents the first opportunity to both collect SSA observations using the miniaturized Sapphire sensor, but also deliver the corresponding data to the host satellite’s ground segment at near-real-time time scales. The GEO host satellite is intended to be launched in the year 2024.
These R&D projects build upon a history of SSA optical sensor development, which over time have improved many of the FoMs discussed in the Figures of Merit section. The table below describes these improvements, as well as each project’s start date, end date, and budget.
| Complete | R&D Project | Start Year | End Year | Improved FoM |
|---|---|---|---|---|
| ✔ | Development, testing, and deployment of various versions of ground-based optical SSA sensors for observing GEO | 1963 | 2020 | Fraction of GEO visible over 24 hours: ~35%
Distance to GEO: ~35,000 km |
| ✔ | Development, testing, and deployment of optical sensor onboard Sapphire | 2010 | 2014 | Fraction of GEO visible over 24 hours: 100%
Distance to GEO: 34,000 to 40,000 km Payload mass: 28.5 kg Payload average power: 14 W |
| Development, testing, and deployment of miniaturized Sapphire optical sensor | 2014 | 2021 | Fraction of GEO visible over 24 hours: 100%
Distance to GEO: 34,000 to 40,000 km Payload mass: 15 kg Payload average power: 30 W | |
| Miniaturized optical sensor LEO demonstration | 2022 | 2023 | Fraction of GEO visible over 24 hours: 100%
Distance to GEO: 34,000 to 40,000 km Payload mass: 15 kg Payload average power: 30 W | |
| Miniaturized optical sensor GEO demonstration | 2024 | 2028 | Fraction of GEO visible over 24 hours: 35%
Distance to GEO: 0 to 35,000 km Payload mass: 28 kg Payload average power: 14 W |
Technology Strategy Statement
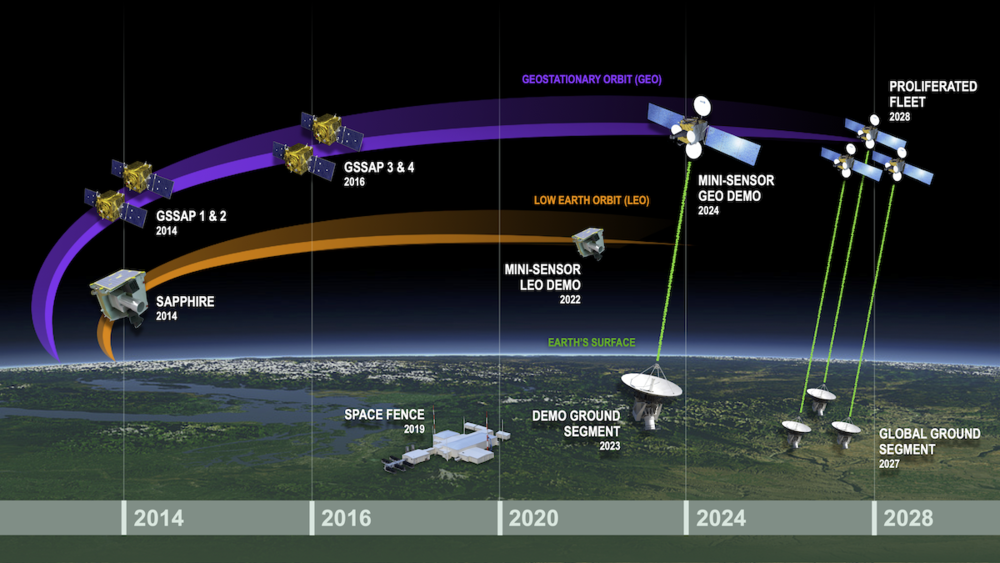
Our goal is to develop a low-cost, low-mass optical sensor payload that can be used for taking space situational awareness observations onboard a geostationary satellite by 2024 and offer full, continuous coverage of the geosynchronous belt by 2028. This technology builds off of the U.S. Space Surveillance Network’s legacy of space-based space surveillance platforms while lowering the cost of operations and barrier of entry for new space actors eager to contribute to space situational awareness activities. To achieve this target, we will invest in one R&D project—the miniaturization of the optical sensor onboard the Canadian military’s Sapphire satellite—which will first be demonstrated on a host satellite in LEO for at least 365 days before being integrated into a GEO host satellite for another 365 days. We believe this technology will enable emerging space actors to contribute to the sustainability of the space domain immediately upon the launch of their first geostationary satellite, as opposed to investing in a dedicated space-based SSA mission.
The chart below describes both the most recent additions to the U.S. Space Surveillance Network (Sapphire, GSSAPS, and Space Fence) and the timeline for development, demonstration, and implementation of our new technology.
References
<references />
