Ultrasonography in Periodontology
Technology Roadmap Sections and Deliverables
Roadmap Overview
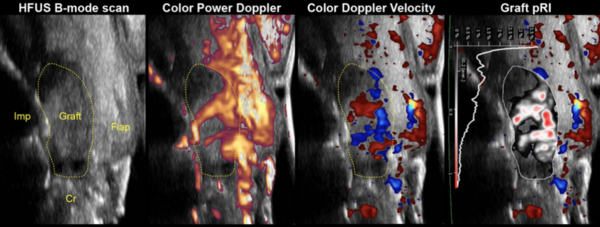
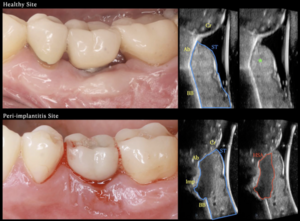
Ultrasonography in dentistry is a novel approach to diagnosing inflammation, specifically periodontal tissues (hard and soft tissue) and disease. An accurate dental diagnosis requires imaging and clinical evaluation. This technology is a level 3 technology with the unique identifier “3US - Ultrasound.” While this may not replace other types of medical imaging needed for an accurate dental diagnosis, it is a non-invasive, radiation-free technology that complements existing methods and enables real-time monitoring of inflammation. This capability represents a radical sustaining innovation, transforming dental imaging by transitioning from reactive to preventive diagnostics while maintaining compatibility with current workflows. Early studies demonstrate uses in wound healing and tissue maturation. Other technologies that would be at level 3 are radiographs, intraoral scanners, and cone beam computed tomography.
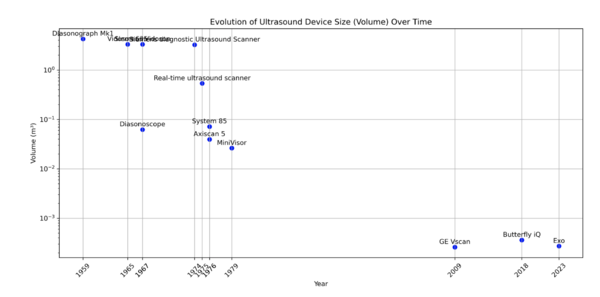
Ultrasound technology was first introduced in the mid-20th century for medical diagnostics, initially revolutionizing non-invasive imaging in cardiology and obstetrics. Early devices were large and restricted to hospital settings. By the 1980s, advancements in piezoelectric materials and signal processing enabled portable and more efficient devices, paving the way for compact applications like dental ultrasonography. The integration of this technology into dentistry leverages decades of innovation to address key challenges in periodontal care.
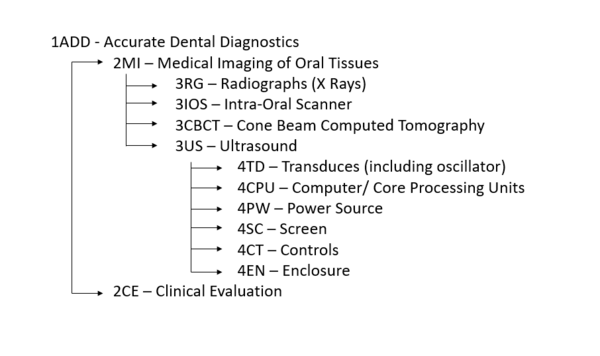
This technology can be further broken down into six level 4 identifiers: 4TD, 4CPU, 4PW, 4SC, 4CT, and 4EN (see DSM Allocation for descriptions of identifiers).
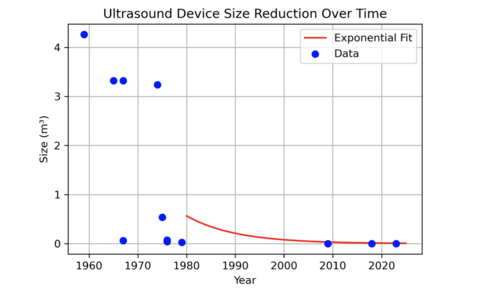
The historical evolution of ultrasound devices, as shown in the figures below, highlights a dramatic reduction in device size, with volumes shrinking from 4 m³ in the 1950s to less than 0.001 m³ in 2023. This exponential miniaturization has been driven by advancements in piezoelectric crystals, electronics, and manufacturing. The size reduction has enabled new applications, including compact, handheld devices suitable for dental diagnostics.
Indication: Dental disease is typically diagnosed through clinical and radiographic evaluation. Not only does this leave a patient exposed to radiation, but this model is reactive rather than preventive. The use of ultrasound in dentistry as an imaging modality is novel. Currently, it is used for wound healing research but we propose developing a POC model with appropriate resolution that could be used at several check ups throughout the year to track inflammatory biomarkers. This noninvasive technology could be beneficial in preventing disease.
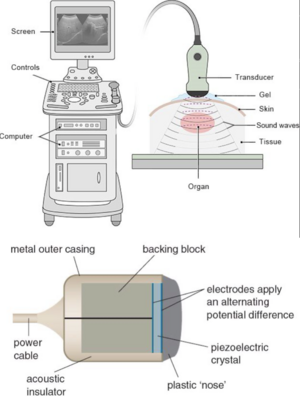
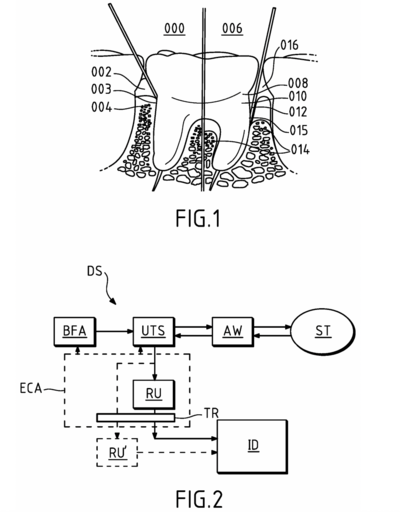
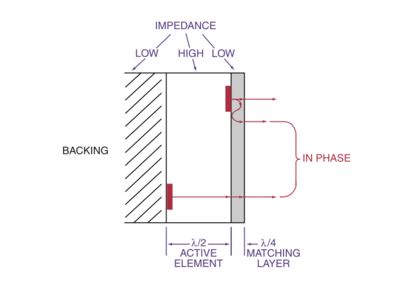
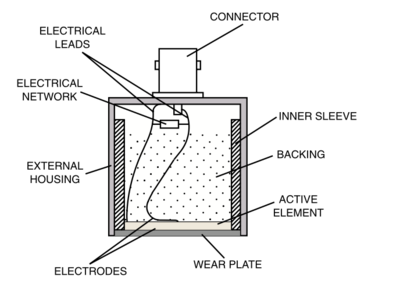
Technology: Electricity is sent to the transducer which has piezoelectric crystals. Piezoelectric crystals convert the electrical signal into a sound wave. The soundwave then travels through a gel medium into a patient’s tissue. The sound waves then bounce back into the transducer and the signal is then generated and processed by the computer processing unit (CPU). Once it has been processed, it is sent to the graphic processing unit and displayed on a screen for the user to interpret.
Design Structure Matrix (DSM) Allocation
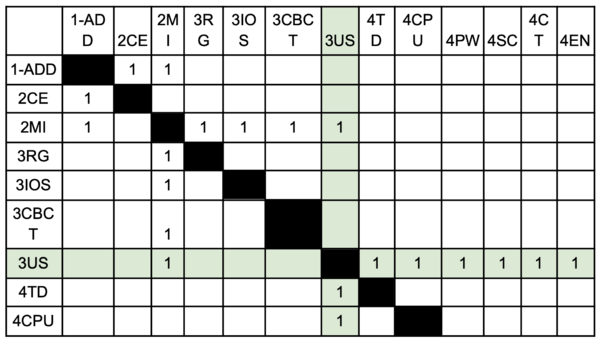
Our DSM explores the hierarchical relationships and dependencies of different technologies within the taxonomy of dental imaging systems and dental diagnosis. We classified ultrasonography in dentistry under the 3US category, which represents a level 3 technology in the system. The subsystems within 4TD, 4CPU, and their related identifiers correspond to the core functional components required for the operation and integration of ultrasound in dental applications.
In the upper section of the DSM, higher-level systems are categorized based on their diagnostic roles and interconnections. These categories include technologies like radiographs (3RG), intraoral scanners (3IOS), and cone beam computed tomography (3CBCT). Ultrasonography (3US) occupies a pivotal position as it interacts with these diagnostic tools while adding unique capabilities for soft tissue imaging and real-time biomarker tracking. Connections between these technologies are highlighted to indicate dependencies and shared functionality.
The lower section focuses on the specific subsystems that support ultrasonography and its integration within broader diagnostic workflows. These include transducer components (4TD), computational units (4CPU), and supporting modules like 4PW, 4SC, and 4EN. Each subsystem interacts to enable efficient signal generation, processing, and visualization in dental diagnostics. Blank boxes in the DSM indicate areas where no meaningful interaction occurs, reflecting the modular nature of the system.
Object Process Model (OPM)
The technology we have chosen to focus on fits best into the category of “Transforming Information” because its main function is to convert acoustic data into real-time, high-resolution images that enhance diagnostic capabilities. Without going into too much technical detail, ultrasound emits high-frequency (MHz) sound waves that penetrate tissues and reflect back, capturing data about the structure of the observed tissues. The reflected sound waves are processed to create visual images, representing internal anatomy. We could also consider "Transforming Energy" as the transducer generates sound waves but the relevant purpose of the US is to transform information.
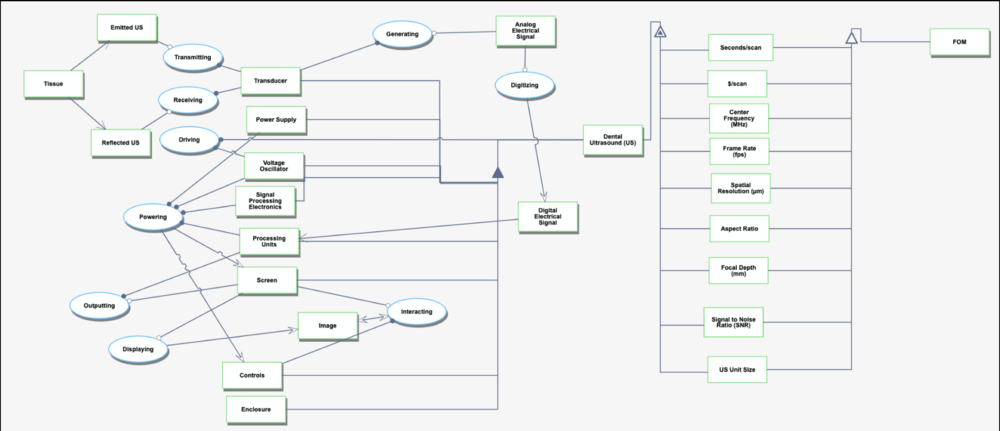
The OPM diagram below details how ultrasound technology transforms acoustic energy into actionable diagnostic information. Core processes like "Transmitting," "Receiving," "Driving," and "Powering" are visually represented alongside essential components such as the transducer, power supply, signal processing electronics, and display unit.
The model also illustrates the quantitative measures used to evaluate ultrasound performance, including spatial resolution, signal-to-noise ratio (SNR), and focal depth, among others. These figures of merit (FOMs) are critical for assessing the effectiveness of dental ultrasound systems in various diagnostic scenarios.
While energy transformation is part of the process, the model emphasizes “Transforming Information” as the defining purpose of dental ultrasound technology.
Figures of Merit (FOMs)
| Figure of Merit (FOM) | Unit | Description | Changing Trends |
|---|---|---|---|
| Spatial resolution | µm | Smallest feature that can be distinguished in the ultrasound image. | Improvements in spatial resolution have been achieved by advancements in transducer technology, image processing, and signal modulation. |
| Focal depth | mm | Distance from the transducer where the ultrasound beam is focused and produces the clearest image/highest resolution. | Application-dependent* |
| Volume/Dimensions of Ultrasound | m³ | Physical size of the ultrasound device, including its transducer and accompanying hardware, or the volume it occupies. | Reducing the device's size is important for maneuverability and patient comfort during dental procedures. Reduction in size is driven by miniaturization of electronics and transducers. ~9.8% yearly decrease since 1st ultrasound technology in 1940s (see Pset question 4) |
| Seconds/scan | s/scan | Time needed to perform one scan or acquire a complete image. | Decreases in scan time are largely due to faster processors, better algorithms, and improved transducer sensitivity. |
| Cost/scan | $ | Cost associated with performing a single ultrasound scan. | Tends to decrease with technological advancements, though pricing can be affected by external factors such as healthcare policies. |
| Center frequency | MHz | Central frequency at which the ultrasound transducer operates, which affects penetration depth and resolution. | Application-dependent* |
| Frame rate | fps | The number of images the system can capture per second, affecting the smoothness and real-time accuracy of imaging. | Frame rate improvements have followed advancements in electronics, particularly with faster signal processing. |
| Aspect ratio | ratio | The ratio of width to height of the ultrasound image. | Constant |
| Signal to noise ratio (SNR) | ratio | A measure of the quality of the ultrasound image by comparing signal strength to background noise. | SNR has improved steadily with advancements in signal processing and transducer sensitivity. |
(*) By application-dependent, we mean that the trends tend to be converging toward desired values depending on the desired application. For instance, one may be interested in a longer or shorter focal depth depending on how far from the surface the tissue they are looking to image is.
|
|
| Ultrasound Transducer Design | Detailed Transducer Cross-Section |
|---|
Alignment with Company Strategic Drivers
| ID | Strategic Driver | Alignments and Targets |
|---|---|---|
| 1 | Improve diagnostic capabilities in dentistry | Target spatial resolution < 20 micrometers |
| 2 | Enhance imaging efficiency and workflow | Achieve increased frame rate (300 Hz?) |
| 3 | Align with industry standards for dental imaging | Develop devices that meet or exceed current industry metrics |
| 4 | Increase accessibility of dental imaging technologies | Ensure cost-effectiveness and portability of new devices |
Position of Company vs. Competition
The field of ultrasonic imagery in dentistry, particularly in periodontology, is an emerging market with no established players. This presents a unique opportunity for our company to pioneer and lead in this niche. However, to understand our competitive positioning more broadly, we may examine the current landscape of ultrasonic technology in general. The ultrasonic technology market is robust and diverse, with several key players dominating various segments. Major companies such as GE Healthcare, Philips, Siemens Healthineers, and Canon Medical are leading the charge in medical ultrasonography. These companies have developed advanced ultrasound devices used in multiple medical fields, including cardiology, radiology, and obstetrics.
Key competitors include:
- GE Healthcare
- Philips
- Siemens Healthinneers
- Canon Medical
- VEVO
List of companies that offer point-of-care ultrasound (POCUS) devices, although they are not tailored for dental:
- Sonoscanner
- Sonoscape Medical Corporation
- Pulsenmore
- Butterfly Network
- Clarius Mobile Health
- EchoNous
- Fujifilm Corporation
- Konica Minolta
- Probomedical
| Figure of Merit | Our Technology | Competitors | Source |
|---|---|---|---|
| Spatial Resolution (μm) | 20 μm goal | GE, Philips, and Siemens Healthineers achieve ~50 μm for high-end medical imaging applications. | Philips, Siemens Healthineers |
| Focal Depth (mm) | Application Dependent | Canon Medical offers adjustable depths (~10–50 mm) optimized for broader applications like radiology. | Canon Medical |
| Device Size (m³) | <0.01 m³ | Current POCUS devices (e.g., Butterfly Network, EchoNous) are compact but not miniaturized for dental use. | Butterfly Network, EchoNous |
| Frame Rate (fps) | 100+ fps | Industry-standard devices achieve 60–120 fps, depending on imaging modality and target tissue. | GE Healthcare |
Technical Model
In our technical model, we focused on three Figures of Merit (FOMs): Volume/Dimensions of Ultrasound, Spatial Resolution (micrometers), and Focal Depth (mm). These FOMs are critical for assessing the performance and practicality of ultrasound devices in dental applications.
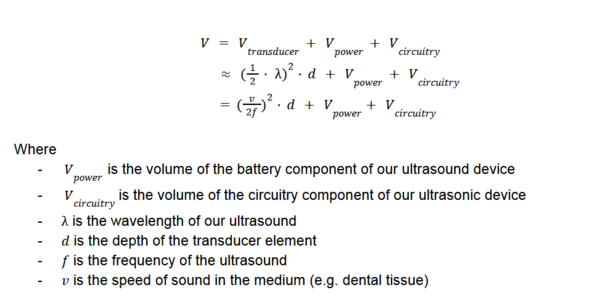
Volume/Dimensions of Ultrasound The physical volume of the ultrasound device encompasses the transducer, power supply, and processing electronics. A compact design is essential for maneuverability and integration within dental environments. The device volume is determined using the following equation:
Reducing the size of the power and circuitry components is crucial for creating a compact and portable ultrasound device suitable for dental applications. For the purpose of our sensitivity analysis, we assume that the volume of the battery component and circuitry component is constant.
Spatial Resolution Spatial resolution refers to the system's ability to distinguish between closely spaced points. It depends on the axial resolution, which is related to the spatial pulse length. The equation for spatial resolution is:
Higher frequencies (f) improve spatial resolution but reduce the penetration depth, which is a design trade-off for dental imaging systems.
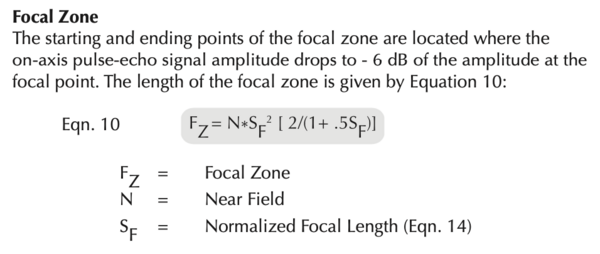
Focal Depth Focal depth is the point of highest concentration of the ultrasound beam and affects the accuracy of tissue imaging. It is calculated as:
Focal depth optimization is vital for achieving high-resolution imaging in periodontal tissues.
Sensitivity Analysis
We conducted a sensitivity analysis to explore how changes in key parameters impact the Figures of Merit. We also calculated the sensitivity of key parameters, using the following partial derivatives for spatial resolution (R_s) and focal depth (D):
These analyses highlight critical design trade-offs. For example:
- Increasing frequency (f) improves spatial resolution but decreases focal depth.
- Reducing power and circuitry volume is essential for portability.
Through this analysis, we can optimize the ultrasound device for real-world dental applications, balancing performance, size, and usability.
Morphological Matrix
| System | Device | Decision Variable | Vevo 3100 with MX250 Transducer | Vevo LAZR-X | Vevo 3100 with MX550D Transducer |
|---|---|---|---|---|---|
| Ultrasound Imaging | Transducer | Frequency Range [MHz] | 15-30 | 70 | 25-55 |
| Aperture Area [cm^2] | 0.7 | NA | NA | ||
| Transducer Depth [mm] | 10 | 10 | 10 | ||
| Frame Rate [Hz] | 200 | 20 | 50 | ||
| Spatial Resolution [micrometers] | 75 | 30 | 55 |
Description of Tradespace
The tradespace for ultrasound imaging in dentistry centers around key decision variables that impact imaging performance in dental applications. Some of the selected devices to study include the Vevo 3100 with MX250 transducer, Vevo LAZR-X, and Vevo 3100 with MX550D transducer. Critical parameters include frequency range (ranging from 8 to 23 MHz), aperture area (0.7 cm²), and transducer depth (up to 10 mm), which directly affect spatial resolution (approximately 30 micrometers) and frame rates (up to 200 Hz). This array of options informs the optimal balance of imaging quality, device size, and operational cost for dental ultrasonography.
Financial Model
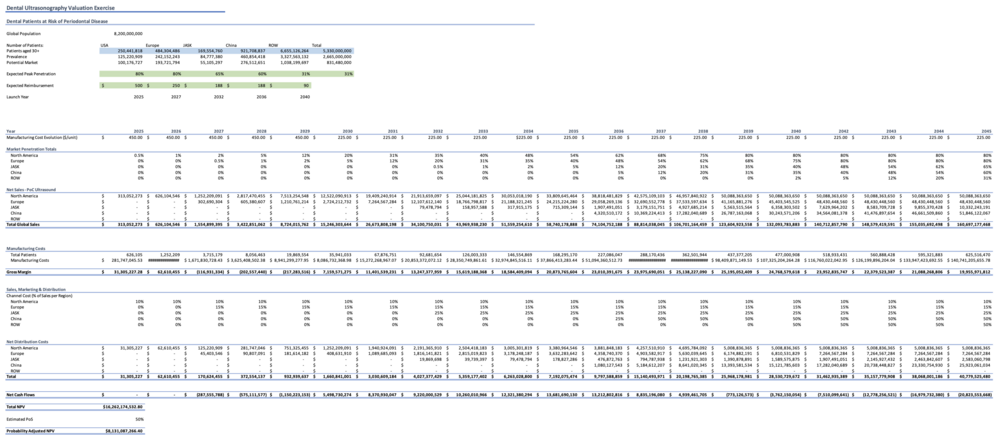
Our NPV projections (2025-2045) completed on MS Excel were based on the following criteria:
- Clinical indication: Periodontitis
- Patients over the age of 30 (when incidence is most common for developing periodontitis)
- Markets: USA; Europe; Japan, Australia, Singapore, and South Korea (JASK); China; Rest of world
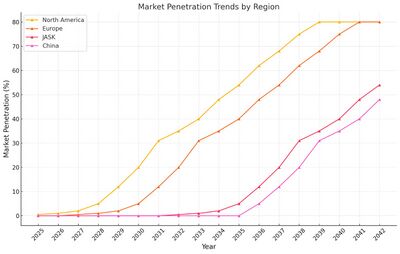
- Peak market penetration rates: 80%, 80%, 65%, 60%, and 31% respectively
- Expected reimbursement rates: $500, $250, $188, $188, $90 respectively
- Launch years: 2025, 2027, 2032, 2036, and 2040 respectively
- Manufacturing cost evolution: $450 (2025-2029); $225 (2030-2045)
- Estimated probability of success: 50%
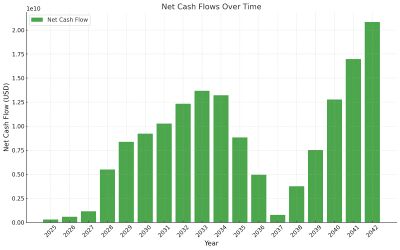
The financial model provides detailed projections of revenues, costs, and cash flows over time for dental ultrasonography. Below is a summary of the key metrics:
| Year | Total Revenue (USD) | Total Costs (USD) | Net Cash Flow (USD) |
|---|---|---|---|
| 2025 | $0 | $281,747,045.53 | $287,555,788 |
| 2026 | $626,104,546 | $563,494,091.06 | $575,111,577 |
| 2027 | $1,554,899,395 | $1,671,830,728.43 | $1,150,223,153 |
| 2045 | $160,697,177,468 | $140,741,205,655.78 | $20,823,553,668 |
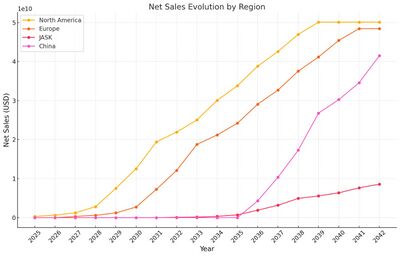
We can visualize the evolution of Net Cash Flow and Market Penetration trend below.
You can view the complete financial model by downloading the Excel file below:
Additionally, a visualization of the model is shown below:
R&D Projects
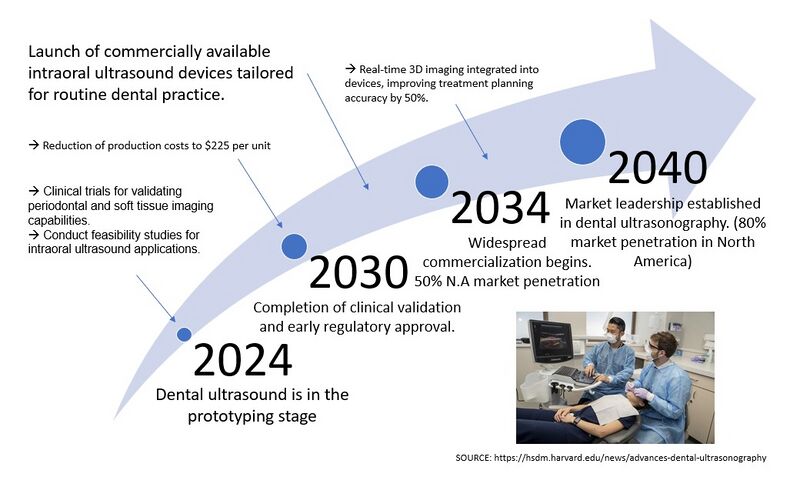
The R&D project timeline has been developed based on current information regarding intraoral ultrasound technology. Many timelines are short since the technology is not new. The main challenge is developing an intraoral probe powerful enough to work with a point-of-care device yet small enough to be used intraorally, specifically on the buccal surfaces and into the vestibule. To maintain competitiveness with leading manufacturers, the project targets R&D completion by Q4 2024 in order to enter the market in 2025. This timeline assumes that the PoC ultrasound and cloud database had been developed from Q1 2022 through Q4 2024. In the future, the company plans to expand to extraoral use when additional indications are developed such as head and neck exams. Finally, an AI software will be developed to track the progression of disease. The goal would be to utilize this data to help in the understanding of the pathogenesis of periodontitis.
| Project # | Status | Project Title | Start | Finish | FOM Improvement | Anticipated Cost | Breakdown of Cost |
|---|---|---|---|---|---|---|---|
| 1 | Completed | PoC Ultrasound | Q1 2022 | Q2 2023 | Dimensions of Ultrasound, Seconds/scan, Center frequency, Frame rate, Aspect ratio, SNR | $1,000,000 | Point of care ultrasound with adequate resolution |
| 2 | Completed | Cloud database | Q1 2022 | Q4 2022 | - | $30,000,000 | Data centers, Cloud servers |
| 3 | In Progress | Intraoral ultrasound probe | Q1 2024 | Q4 2024 | Dimensions of Ultrasound, Spatial resolution, Focal depth, Seconds/scan, SNR | $560,000 | Patent and probe R&D for intraoral use |
| 4 | Planned | Extraoral ultrasound probe | Q3 2030 | Q4 2032 | Seconds/scan, Spatial resolution, Focal depth, SNR | $10,000,000 | Patent and probe R&D for extraoral use |
| 5 | Planned | AI Software | Q1 2023 | Q1 2026 | - | $10,000,000 | Software engineers |
Regarding the development of the ultrasound, R&D trajectory enhances component-level technologies such as dimensions of the POC device, and the speed and accuracy of the scan. These advances will provide data to develop precise artificial intelligence algorithms capable of delivering real-time, high-resolution diagnostic images with objective prognostic information. All phases of R&D focus on ergonomic design, clinical testing, prototyping, and the development of user training programs.
Key Publications and Patents
The following search terms were used among other variations of the terms: “ultrasound” AND “periodontal”; “ultrasound” AND “periodontal” AND “point of care”
The patents and publications below highlight the relevance and potential of ultrasonography in dental imaging and diagnosis.
Key Patents
| Image | Patent Number and Title | Relevance from Patent Claims | CPC Number |
|---|---|---|---|
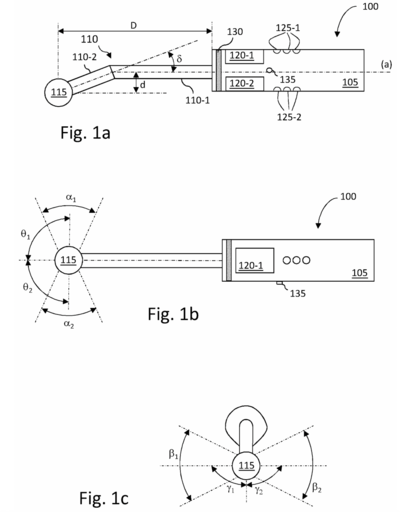
| US12082971B2 - Method for scanning material using an ultrasonic imaging probe |
|
A61B 8/08 and others | |
| US20240268937A1 - Ultrasonic probe for intraoral soft tissue imaging |
|
A61B 5/06 + others |
Key Publications
| # | Citation | Key Findings |
|---|---|---|
| 1 | Renaud M, Delpierre A, Becquet H, Mahalli R, Savard G, Micheneau P, Carayon D, Denis F.
Intraoral Ultrasonography for Periodontal Tissue Exploration: A Review. Diagnostics (Basel). 2023 Jan 18;13(3):365. doi:10.3390/diagnostics13030365. PMID: 36766470; PMCID: PMC9914868. |
|
| 2 | Chan HL, Wang HL, Fowlkes JB, Giannobile WV, Kripfgans OD.
Non-ionizing real-time ultrasonography in implant and oral surgery: A feasibility study. Clin Oral Implants Res. 2017;28(3):341-347. doi:10.1111/clr.12805. |
|
| 3 | Barootchi S, Tavelli L, Majzoub J, Chan HL, Wang HL, Kripfgans OD.
Ultrasonographic Tissue Perfusion in Peri-implant Health and Disease. J Dent Res. 2022;101(3):278-285. doi:10.1177/00220345211035684. |
|
| 4 | Galarraga-Vinueza ME, Barootchi S, Mancini L, et al.
Echo-intensity characterization at implant sites and novel diagnostic ultrasonographic markers for peri-implantitis. J Clin Periodontol. Published online April 1, 2024. doi:10.1111/jcpe.13976. |
|
| 5 | Tavelli L, Barootchi S, Rodriguez MV, et al.
Characterization of oral biomarkers during early healing at augmented dental implant sites. J Periodontal Res. Published online August 1, 2024. doi:10.1111/jre.13328. |
|
| 6 | Sinjab K, Kripfgans OD, Ou A, Chan HL.
Ultrasonographic evaluation of edentulous crestal bone topography: A proof-of-principle retrospective study. Oral Surg Oral Med Oral Pathol Oral Radiol. 2022;133(1):110-117. doi:10.1016/j.oooo.2021.07.006. |
|
Technology Statement
Our goal is to make dentistry less invasive and safer by developing a compact, non-invasive ultrasound device that eliminates patient exposure to ionizing radiation during routine dental check-ups. By 2034, we aim to replace traditional radiographic imaging for diagnosing soft tissue infections and inflammation, allowing clinicians to detect and monitor conditions such as periodontal disease in real-time. This technology will provide a preventive, patient-friendly alternative to current methods, improving diagnostic accuracy while promoting early intervention and better overall oral health outcomes. By 2040, our devices will be globally available, cost-effective, and widely adopted in dental clinics.
