Difference between revisions of "Autonomy in the Corn Production System"
| Line 38: | Line 38: | ||
==Financial Model== | ==Financial Model== | ||
==List of R&T Projects and Prototypes== | ==List of R&T Projects and Prototypes== | ||
Revision as of 23:16, 9 October 2021
Page Under Development
Technology Roadmap Sections and Deliverables
- 2ACP - Autonomy in the Corn Production System
This indicates that we are dealing with a “level 2” roadmap at the product level (see Fig. 8-5), where “level 1” would indicate a market level roadmap and “level 3” or “level 4” would indicate an individual technology roadmap.
Roadmap Overview
The working principle and architecture of solar-electric aircraft is depicted in the below.
Solar-electric aircraft are built from light-weight materials such as wood or carbon-fiber reinforced polymers (CFRP) and harvest solar energy through the photoelectric effect by bonding thin film solar cells to the surface of the main wings, and potentially the fuselage and empennage as well. The electrical energy harvested during the day is then stored in on-board chemical batteries (e.g. Lithium-Ion, Lithium-Sulfur etc…) and used for propelling the aircraft at all times, including at night. For the system to work there needs to be an overproduction of energy during the day, so that the aircraft can use the stored energy to stay aloft at night. The flight altitude of about 60,000-70,000 feet is critical to stay above the clouds and not to interfere with commercial air traffic. Depending on the length of day, i.e. the diurnal cycle which determines the number of sunshine hours per day, which itself depends on the latitude and time-of-year (seasonality) the problem is easier or harder. The reference case in the technology roadmap is an equatorial mission (latitude = zero) with 12 hours of day and 12 hours of night.
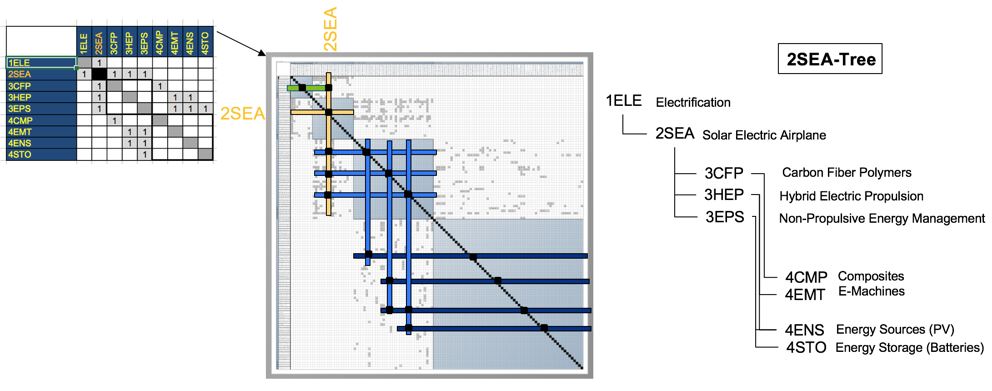
Design Structure Matrix (DSM) Allocation
The 2-SEA tree that we can extract from the DSM above shows us that the Solar-Electric Aircraft (2SEA) is part of a larger company-wide initiative on electrification of flight (1ELE), and that it requires the following key enabling technologies at the subsystem level: 3CFP Carbon Fiber Polymers, 3HEP Hybrid Electric Propulsion and 3EPS Non-Propulsive Energy Management (e.g. this includes the management of the charge-discharge cycle of the batteries during the day-night cycle). In turn these require enabling technologies at level 4, the technology component level: 4CMP components made from CFRP (spars, wing box, fairings …), 4EMT electric machines (motors and generators), 4ENS energy sources (such as thin film photovoltaics bonded to flight surfaces) and 4STO (energy storage in the form of lithium-type batteries).
Roadmap Model using OPM
We provide an Object-Process-Diagram (OPD) of the 2SEA roadmap in the figure below. This diagram captures the main object of the roadmap (Solar-Electric Aircraft), its various instances including main competitors, its decomposition into subsystems (wing, battery, e-motor …), its characterization by Figures of Merit (FOMs) as well as the main processes (Flying, Recharging).
An Object-Process-Language (OPL) description of the roadmap scope is auto-generated and given below. It reflects the same content as the previous figure, but in a formal natural language.
Figures of Merit
Alignment with Company Strategic Drivers
Positioning of Company vs. Competition
Technical Model
Financial Model
List of R&T Projects and Prototypes
In order to select and prioritize R&D (R&T) projects we recommend using the technical and financial models developed as part of the roadmap to rank-order projects based on an objective set of criteria and analysis. The figure below illustrates how technical models are used to make technology project selections, e.g based on the previously stated 2030 target performance and Figure 8-17 (see the Chapter 8 of the text) shows the outcome if none of the three potential projects are selected.
A roadmap shows the R&T/R&D projects and demonstrators that have been (completed), are being (active) and could be (proposed) undertaken in order to progress the technology at the component or system level towards the set targets/goal set by the higher or lower-level roadmap. Please add what is essentially a Gantt Chart with milestones.
Key Publications, Presentations and Patents
A good technology roadmap should contain a comprehensive list of publications, presentations and key patents as shown in Figure 8-19. This includes literature trends, papers published at key conferences and in the trade literature and trade press.
Technology Strategy Statement
A technology roadmap should conclude and be summarized by both a written statement that summarizes the technology strategy coming out of the roadmap as well as a graphic that shows the key R&D investments, targets and a vision for this technology (and associated product or service) over time. For the 2SEA roadmap the statement could read as follows and is displayed in an Arrow Chart:
