Difference between revisions of "Radar For Autonomous Vehicles Mobile Robots"
| Line 135: | Line 135: | ||
==List of Demonstrator Projects== | ==List of Demonstrator Projects== | ||
TBD | |||
==Key Publications, Presentations and Patents== | ==Key Publications, Presentations and Patents== | ||
Revision as of 21:39, 28 October 2023
Technology Roadmap Sections and Deliverables
- 3BOTRDR - Radar for Autonomous Vehicles and Mobile Robots
Roadmap Overview
This technology roadmap explores the application and use of radar sensors in autonomous vehicles (AV) and mobile robots. In a world where more of our everyday tasks are being automated and removing the need for human intervention, sensors (such as radars) are increasingly important to enable autonomous technological advancements. Mobile robots and autonomous vehicles alike need to sense objects and features in their surroundings to navigate and interact with the world; radar sensors can be used to accomplish this. This level 3 roadmap evaluates radar's interactions among level 2 functions such as power systems, control systems, and autonomous navigation, but will also introduce level 4 technologies within radar for further evaluation.
Radar within AVs and mobile robots works by emitting radio frequency waves into the environment. When the waves hit features in the scene, some energy is absorbed, some bounces away, and some bounces back toward the radar head. The radar head receives the reflected portions of the wave. By measuring the time-of-flight, doppler, and other attributes of the reflected wave, radars can estimate the distance to the object and its relative velocity. Some radar companies have developed unique algorithms to determine other attributes of features as well.
Radar is not the only option for exteroceptive sensing in robotics and autonomy; LiDARs and visible cameras are ubiquitous in the industry. Radar, however, has several advantages: long range, ability to accurately sense something’s relative velocity, low power consumption, and all-weather performance. Despite these advantages, radar has been a recent source of contention among the AV and ADAS developer community. Radar does not perform as well as other sensors when measured by traditional sensing FOMs, such as resolution and depth accuracy. The direct output of radars is often incompatible with many classical robotics detection algorithms, which makes it hard for many established firms to integrate with their systems. For these reasons, many AVs/ADASs use radar alongside sensor fusion or reject radar technology outright. This technology roadmap explores the benefits and opportunities to implement radars while achieving the goals of autonomous vehicles and mobile robots.
References
- https://www.radartutorial.eu
- https://www.researchgate.net/figure/Position-of-radar-on-a-robot-Radar-is-typically-located-at-a-height-hr-between-1m-and-3m_fig5_301273977
- https://man.fas.org/dod-101/navy/docs/es310/radarsys/radarsys.htm
Design Structure Matrix (DSM) Allocation
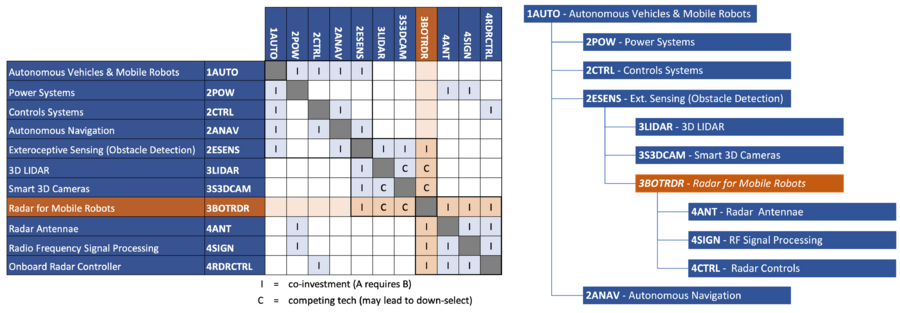
The DSM below shows the relationships between the 3RDRBOT technology roadmap and other roadmaps of interest. 3BOTRDR (radar for robotics & AVs) is a level 3 roadmap within the level 2 technology 2ESENS (exteroceptive sensing and obstacle detecting). The highest level initiative is 1AUTO: robotics & autonomous vehicles.
The roadmap hierarchy is shown to the right of the DSM from which it was extracted, below.
Roadmap Model using OPM
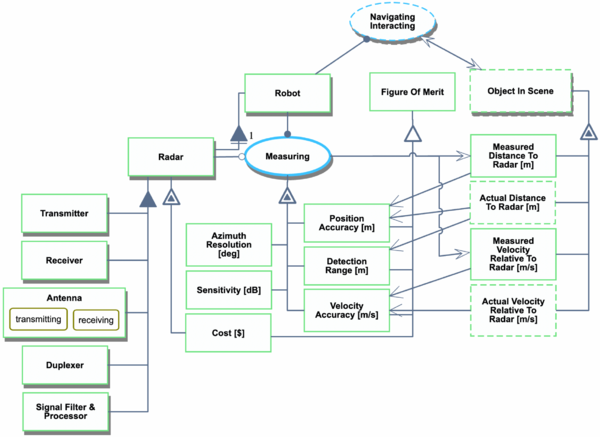
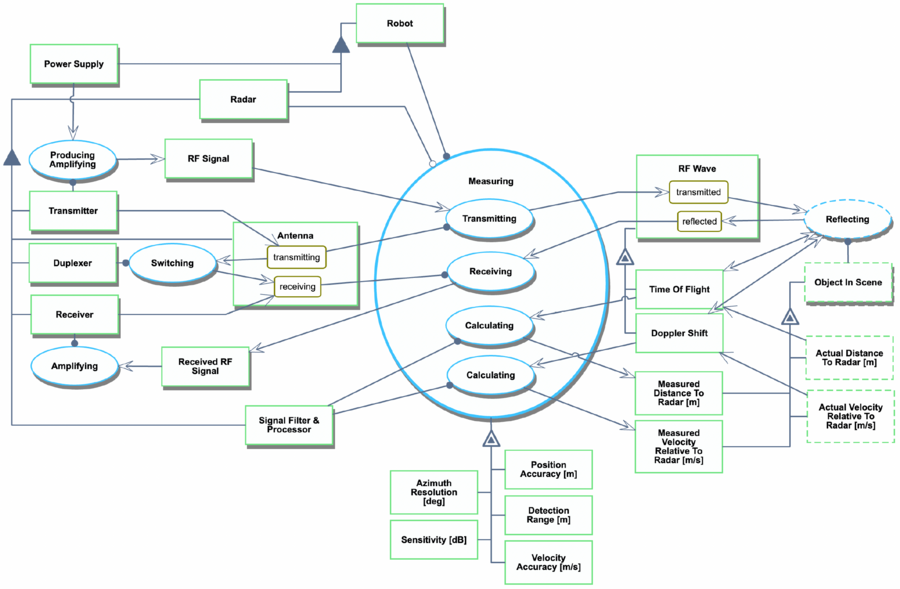
The Object-Process-Diagram (OPD) of the 3BOTRDR Radar for Robotics & AVs is provided in the figure below. This diagram captures the main object of the roadmap (Radar), its purpose, its various processes and instrument objects, and its characterization by Figures of Merit (FOMs).
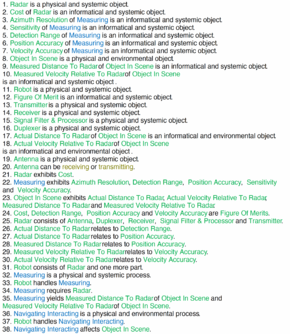
The autogenerated Object-Process-Language (OPL) is included (right) for clarity.
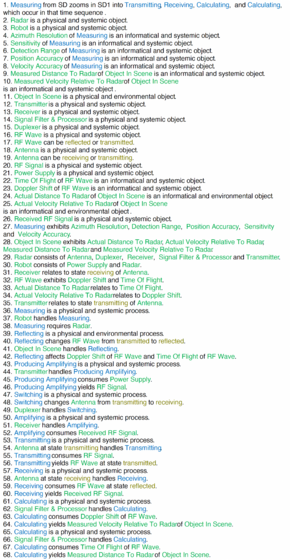
The "Measuring" Process is further detailed to show sub-processes and their instrument objects. Some objects, processes, and relationships are removed for clarity.
The autogenerated Object-Process-Language (OPL) is included (right) for clarity.
Figures of Merit
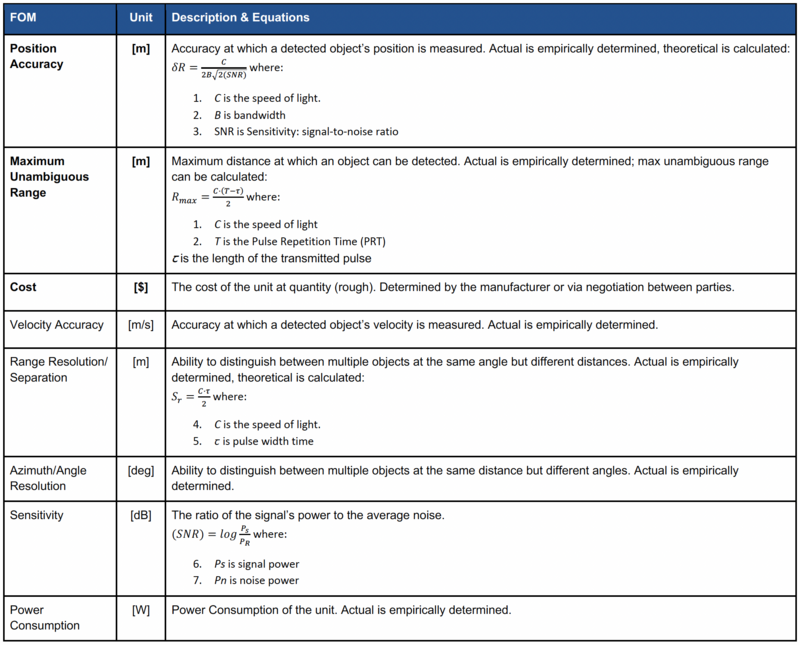
Primary and Secondary FOMs
The table below lists some Figures of Merit (FOMs) by which radar can be assessed. For exteroceptive sensing, primary FOMs for radar are shown in bold, followed by the FOMs that are currently considered secondary.
Governing Equations
The table below shows two governing equations showing how radar can be used to measure an object's relative distance and velocity.
Progress Over Time
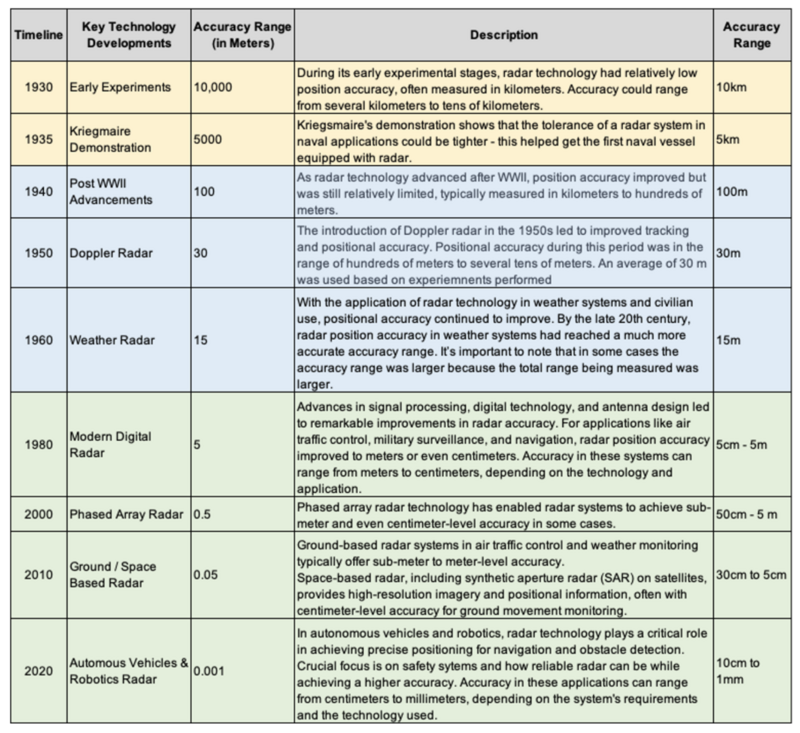
The history of radar is quite fascinating as its use case has evolved significantly over time. As this use case evolves, a higher measurement accuracy is achieved based on that sprint technology development. Below is a table with a high-level overview of radar’s Position Accuracy [m] performance improvements over time.
Model Rate of Improvement
During the analysis of the rate of improvement, we realized that there were three major innovation spurts for this technology. This development timeline has been plotted in the graph below, and a best-fit model rate was determined. Radar technology an excellent example of how the technology acceleration for development also can change over various periods in history based on the technology’s use case.
The first occurred during the initial development from 1930-1940 – shown in yellow. The second occurred post WWII, and there was an infusion of interest in the technology; the development trajectory exponentially increased – shown in blue. The third occurred in the 2000s when centimeter level accuracy was achieved and the technology use case was expanded to ground & space applications (prior it was more weather-focused) – shown in green.
Theoretical Limit
Several fundamental factors influence radar technology’s theoretical limit and accuracy. Based on the graphs above, we can achieve sub-millimeter accuracy with the current technology. This was determined using the best-fit line from the last graph (post-modern development).
However, this depends on the subsequent technology acceleration, as the overall technological environment constrains performance. As an example, radar right now is limited by the wavelength of the electromagnetic waves it uses. The radar’s ability to resolve objects depends on the wavelength, with shorter wavelengths allowing for finer resolution. However, as wavelengths become extremely short (e.g., X-rays or gamma rays), the radar’s ability to penetrate materials and provide helpful information may decrease.
Ultimately, the theoretical limit of radar accuracy is a complex concept that depends on many factors, and it is likely to continue improving as technology advances. As electronics and computing continue to decrease in size and increase in performance, this will jumpstart the next technology evolution. The projections based on the above best-fit lines, show that we can achieve sub-millimeter accuracy with reliable radar systems to help jumpstart a robotics technology evolution for autonomous solutions. On the traditional S-curve (shown in Figure 4.15), the technology is in its rapid progress stage. As the backend technologies continue to develop, they kickstart the takeoff phase. At this moment, it seems like we have finished an initial takeoff and are making rapid progress; however, the moment that electronic technology improves, we will likely go into another spiral of incubation.
The technology continues to develop in various applications – the latest developments are primarily occurring in the automotive space applications. This is because those industries are starting to rely on radar as a primary sensing method – as radar continues to evolve and become a more reliable/safe system, it will likely be expanded in its use case. For example, Radar technology is increasingly integrated into automotive applications for advanced driver-assistance systems and autonomous vehicles.b Automotive radar systems can provide high-precision positioning and object detection to enhance vehicle safety and automation, in which radar plays an important role. Similarly, advances in radar components, such as antennas, transmitters, and receivers, improve performance and accuracy in various radar systems, affecting multiple applications (automotive, space, weather, etc.)
References
- https://www.radartutorial.eu/
- https://www.tutorialspoint.com/radar_systems/radar_systems_doppler_effect.htm
- G. Galati and P. van Genderen, "History of radar: The need for further analysis and disclosure," 2014 11th European Radar Conference, Rome, Italy, 2014, pp. 25-28, doi: 10.1109/EuRAD.2014.6991198.
- Magosi ZF, Li H, Rosenberger P, Wan L, Eichberger A. A Survey on Modelling of Automotive Radar Sensors for Virtual Test and Validation of Automated Driving. Sensors (Basel). 2022 Jul 29;22(15):5693. doi: 10.3390/s22155693. PMID: 35957250; PMCID: PMC9370944.
- V. S. Chernyak and I. Y. Immoreev, "A Brief History of Radar," in IEEE Aerospace and Electronic Systems Magazine, vol. 24, no. 9, pp. B1-B32, Sept. 2009, doi: 10.1109/MAES.2009.5282288.
- https://www.britannica.com/technology/radar/History-of-radar
- https://www.kdcresource.com/insights/the-evolution-of-radar-systems-a-cornerstone-of-modern-technology/
- https://training.weather.gov/nwstc/NEXRAD/RADAR/Section1-1.html
Alignment with Company Strategic Drivers
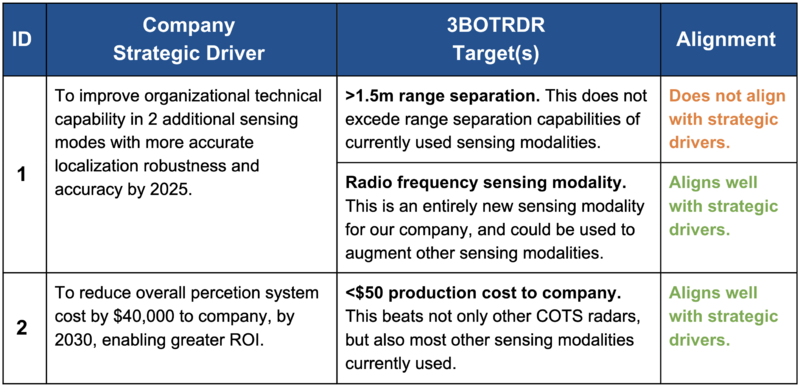
The “Company” is a privately held autonomous robotics company with a mission to bring to market the world’s safest mid-sized mobile robotics platform by 2030. To achieve this mission, we must consider technological advancements at multiple levels of 1AUTO. Improvement to the 3BOTRDR technology will improve the multi-modal sensing capabilities of our organization and allow more robust, safe operation at our highest level. The table below shows the two main strategic drivers, and their necessary alignment of the 3BOTRDR technology roadmap.
Positioning of Company vs. Competition
TBD
Technical Model
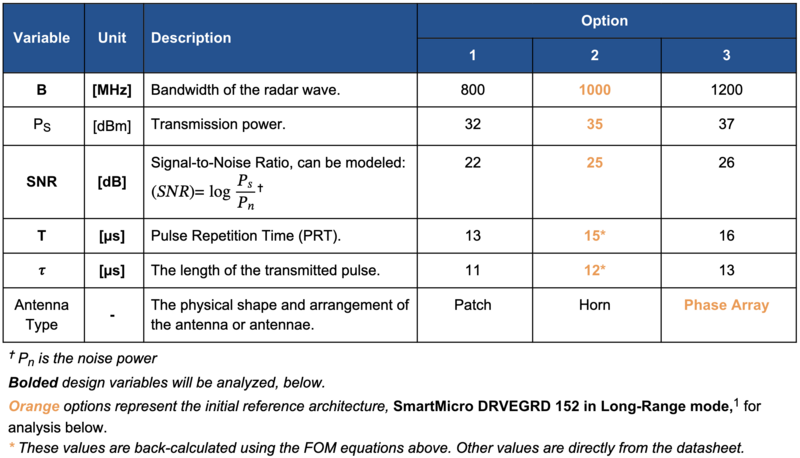
To better understand the feasibility of technology performance targets, we must understand the correlation between key FOMs and the technical/architectural design decisions that must be made.
Morphological Matrix (Design Variables)
Technical design variables/decisions for 3BOTRDR are described in the table below.
Sensitivity Analysis
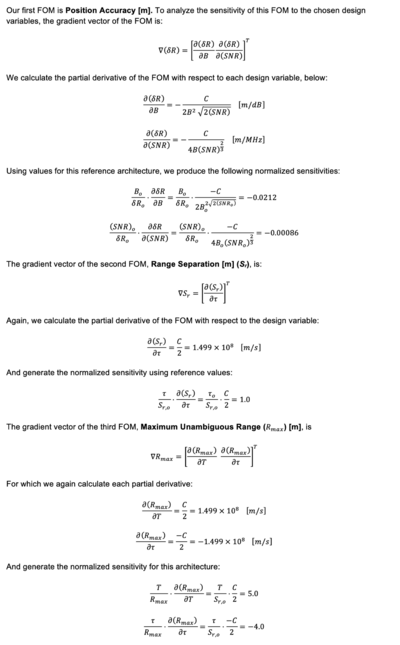
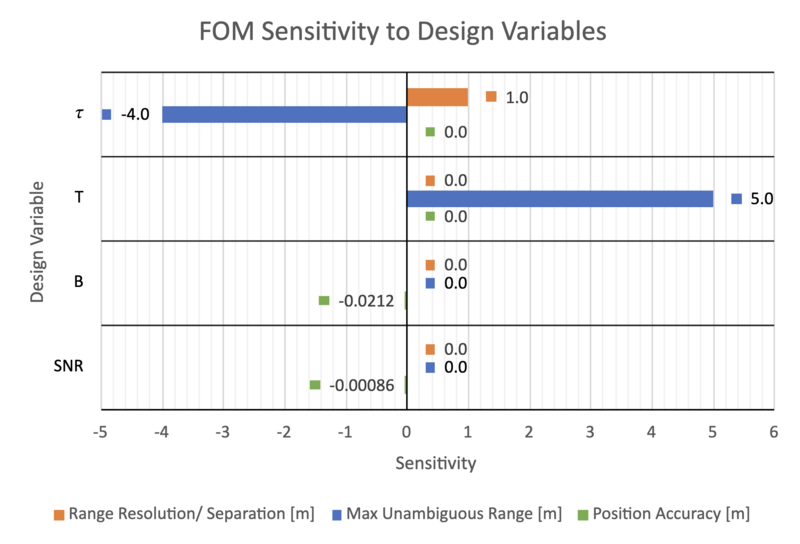
To understand the sensitivity of our three key FOMs to the relevant design variables, we analyze using the math shown in the thumbnail on the right. The results of the analysis are shown in the tornado chart below.
References
Financial Model
TBD
List of Demonstrator Projects
TBD

