Difference between revisions of "Sustainable Aviation Fuel"
| (One intermediate revision by the same user not shown) | |||
| Line 16: | Line 16: | ||
==Design Structure Matrix (DSM) Allocation== | ==Design Structure Matrix (DSM) Allocation== | ||
[[File:saf_tree.png|800px|]] [[File: | [[File:saf_tree.png|800px|]] [[File:saf_dsm2.png|500px|]] | ||
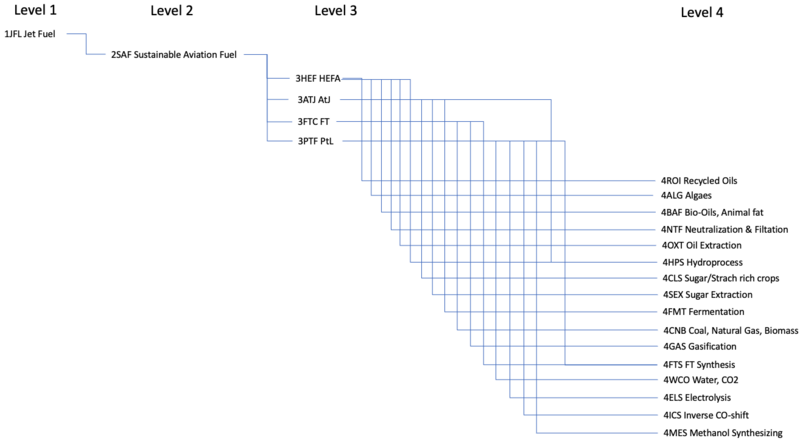
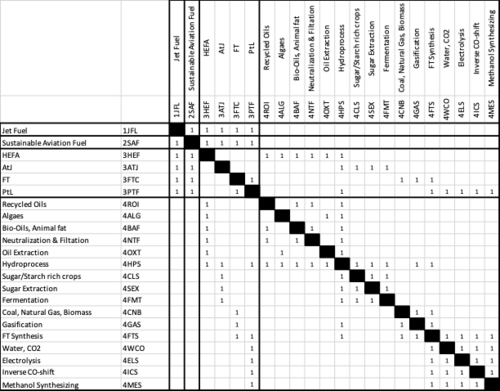
The above 2SAF tree shows the relationship between other technologies related to the SAF. Specifically, the enabling technologies to SAF, by key feedstocks and processes, are considered. The enabling of SAF with the use of existing feedstocks are indicated with the connection of 2SAF to 3HEF, 3ATJ, 3FTC, 3PTL, 4BAF, 4CLS, 4CNB, and 4WCO. The enabling of SAF through various processes are shown through 2SAF connections to 4ROI, 4NTF, 4HPS, 4SEX, 4FNT, 4GAS, 4FTS, 4ELS, 4ICS, and 4MES. The connections of SAF to Level 3 and 4 technologies are shown in the DSM. In the following section, further details on the SAF production architecture is presented using Object-Process-Model (OPM). | The above 2SAF tree shows the relationship between other technologies related to the SAF. Specifically, the enabling technologies to SAF, by key feedstocks and processes, are considered. The enabling of SAF with the use of existing feedstocks are indicated with the connection of 2SAF to 3HEF, 3ATJ, 3FTC, 3PTL, 4BAF, 4CLS, 4CNB, and 4WCO. The enabling of SAF through various processes are shown through 2SAF connections to 4ROI, 4NTF, 4HPS, 4SEX, 4FNT, 4GAS, 4FTS, 4ELS, 4ICS, and 4MES. The connections of SAF to Level 3 and 4 technologies are shown in the DSM. In the following section, further details on the SAF production architecture is presented using Object-Process-Model (OPM). | ||
| Line 82: | Line 82: | ||
The figure below shows the morphological matrix for our 2SAF roadmap. Each design choice is highly connected with the pathways: HEFA, AtJ, FT, and PtL. The connections of design choices are shown in the OPM. It is noted that, in SAF conversion, there are some shared choices between different pathways. Thus, those processes can be considered as the possibility of scaling even if we choose one pathway for the first step. | The figure below shows the morphological matrix for our 2SAF roadmap. Each design choice is highly connected with the pathways: HEFA, AtJ, FT, and PtL. The connections of design choices are shown in the OPM. It is noted that, in SAF conversion, there are some shared choices between different pathways. Thus, those processes can be considered as the possibility of scaling even if we choose one pathway for the first step. | ||
[[File: | [[File:mor_matrix1.png|800px|]] | ||
For the quantitative analysis, we consider three important models: cost, CO2 emission, and performance. The detailed explanation for each model is explained in the following subsections. | For the quantitative analysis, we consider three important models: cost, CO2 emission, and performance. The detailed explanation for each model is explained in the following subsections. | ||
Latest revision as of 02:21, 19 January 2024
Roadmap Creators: Daiki Terakado and Sean Hwang
Time Stamp: 5 December 2023
Technology Roadmap Sections and Deliverables
Our technology roadmap identifier is shown as:
- 2SAF - Sustainable Aviation Fuel
This indicates that we are dealing with a “level 2” roadmap at the product level, where “level 1” would indicate a market level roadmap and “level 3” or “level 4” would indicate an individual technology roadmap.
Roadmap Overview
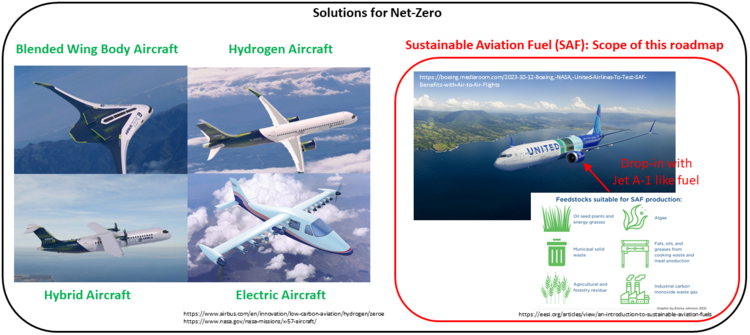
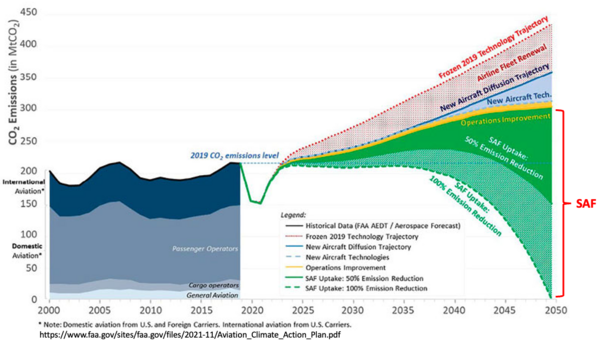
Sustainable aviation fuel (SAF) is a strong candidate to deal with global warming in the context of aviation, using low carbon footprint resources such as biomass, waste oil, CO2, and water. SAF has a good compatibility with the present aircraft. SAF has similar characteristics to the current jet fuel and can be mixed with it, so the architecture of aircraft does not need to change. On the other hand, another strong alternative for low carbon footprint fuel is hydrogen, which needs the rearchitecting of the aircraft because of its small density and temperature, affecting the vehicle size (see following figure left). The following right figure coming from FAA shows SAF is the key toward the ambitious goal of "net zero CO2 emissions" in aviation.
For producing SAF, there are several pathways depending on feedstock and the way of conversion from feedstock to SAF. However, each pathway has advantages and disadvantages such as cost, scalability, and technological readiness. This roadmap tries to identify the impactful technologies on the feasibility of SAF, and show their development plan.
Design Structure Matrix (DSM) Allocation
The above 2SAF tree shows the relationship between other technologies related to the SAF. Specifically, the enabling technologies to SAF, by key feedstocks and processes, are considered. The enabling of SAF with the use of existing feedstocks are indicated with the connection of 2SAF to 3HEF, 3ATJ, 3FTC, 3PTL, 4BAF, 4CLS, 4CNB, and 4WCO. The enabling of SAF through various processes are shown through 2SAF connections to 4ROI, 4NTF, 4HPS, 4SEX, 4FNT, 4GAS, 4FTS, 4ELS, 4ICS, and 4MES. The connections of SAF to Level 3 and 4 technologies are shown in the DSM. In the following section, further details on the SAF production architecture is presented using Object-Process-Model (OPM).
Roadmap Model using OPM
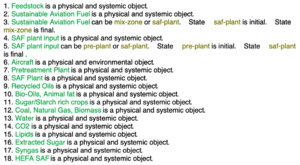
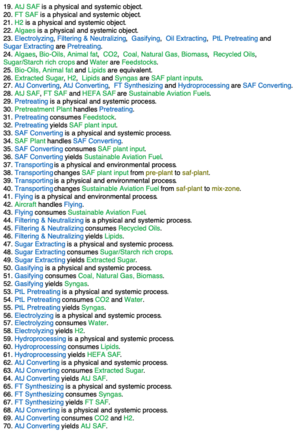
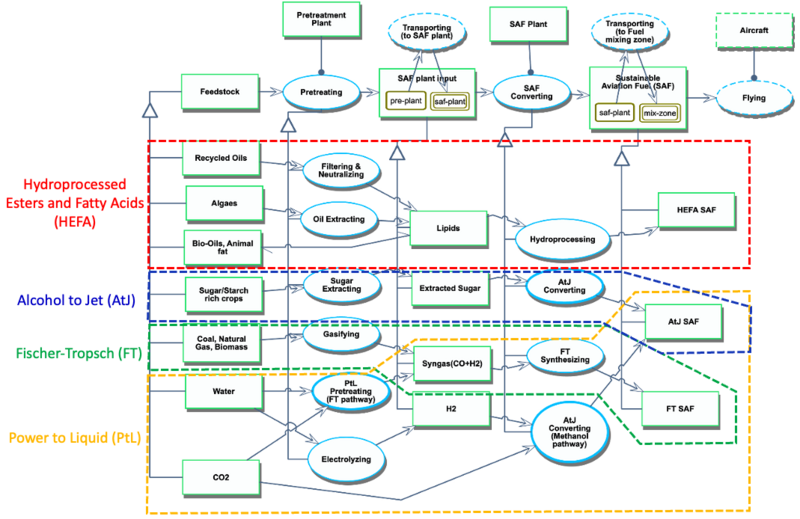
The Object-Process-Model (OPM) of the 2SAF - Sustainable Aviation Fuel roadmap is presented in the figure with the Object-Process-Language (OPL) below. This diagram shows the processes (Pretreating, and SAF Converting) for producing SAF with the representative pathways with different types of feedstocks. We include four different representative SAF producing categories: 1) Hydroprocessed Esters and Fatty Acids (HEFA) with recycled oils, alges, bio-oils, and animal fat, 2) Alcohol-to-Jet (AtJ) with Sugar/Strach rich crops, 3) Fischer-Tropsch (FT) with coal, natural gas, and biomass, and 4) Power-to-Liquid (PtL) with water and CO2.
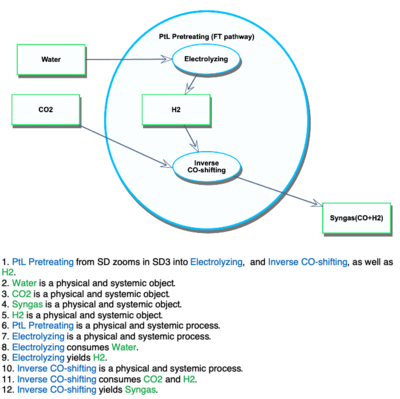
Three functional zoom-up views of the OPM are shown in the following figures.
PtL Pretreating (FT pathway)
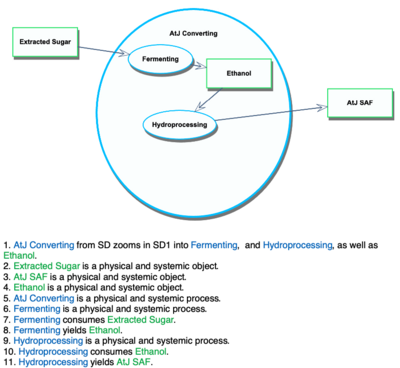
AtJ Converting
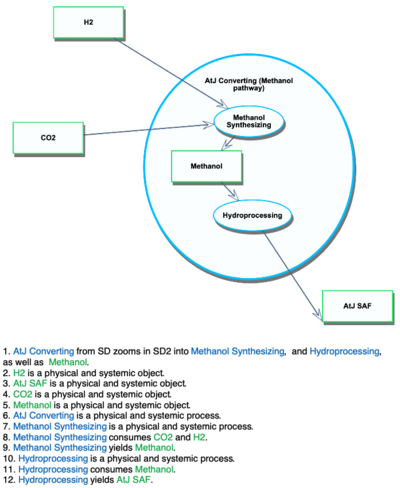
AtJ Converting(Methanol pathway)
Figures of Merit
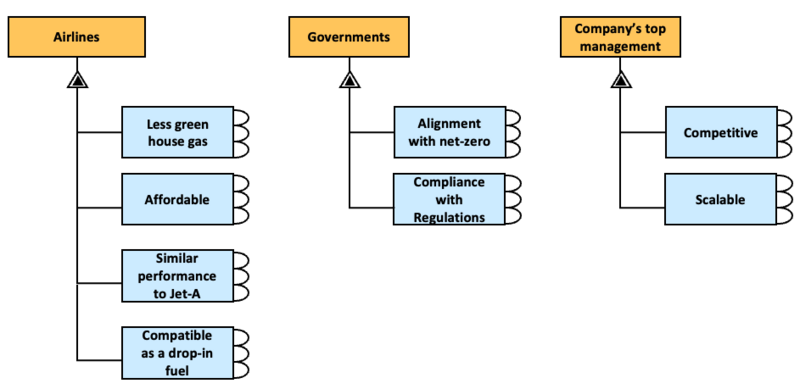
To begin with, we show the needs of stakeholders in the following figure. We identify three stakeholders; airlines, governments, and top management of companies.
With this in mind, we set FOMs for our roadmap to cover the satisfaction of the needs of stake holders. The first four (shown in bold) are identified as FoMs for our roadmap: SAF unit cost, fuel consumption, CO2-eq emission, and feedstock availability. We chose CO2-eq as an indicator of greenhouse gas emission since it includes not only CO2 but also other greenhouse gases. These are used for analyzing the trade-off of the technology choice of SAF production. The last one, the compliance to ASTM requirements is important, but is not dealt with in our current roadmap. This is because it is highly related to transportation strategy, which are currently out of scope due to the early phase of R&D. Those are potential topics to add for future roadmap updates.
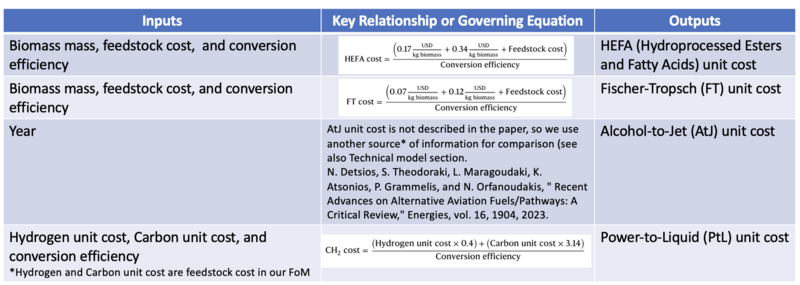
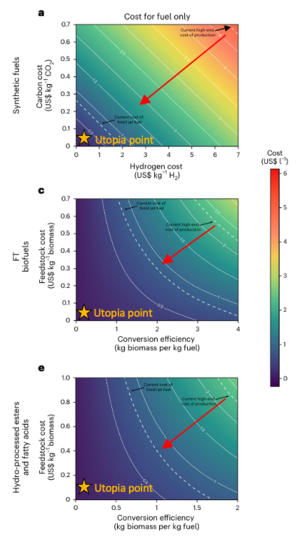
As mentioned in the selection of FoMs, the cost is a key to assess SAF. Here, we summarize the governing equations given in the literature[1]. The right figure is an example of the SAF cost with a)Power-to-Liquid (PtL) , c)Hydroprocessed Esters and Fatty Acids (HEFA), and e)Fischer-Tropsch (FT) [1]. As pointed with the black arrows, the SAF and current jet fuel costs place at up-right and upper-middle to bottom-left, respectively, where the utopia point is bottom-left. Thus, the direction of technology advancement of SAF with these figures goes from up-right to bottom-left, as shown in the red arrows.
Alignment with Company Strategic Drivers
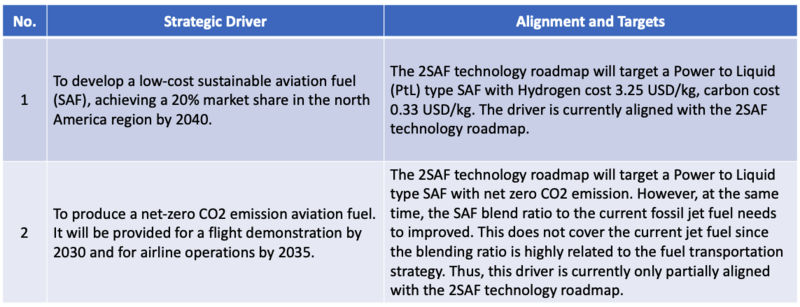
Our “company” is a SAF producer specializing in high-conversion Power to Liquid (PtL) type that is looking to enable net-zero CO2 emissions in aviation fuel. Specifically, our company is targeting a 20% market share of the north America SAF market, with plans on enabling airline operations with SAF by 2035. The details of the strategic driver, alignments, and targets are as presented below:
Positioning of Company vs. Competition
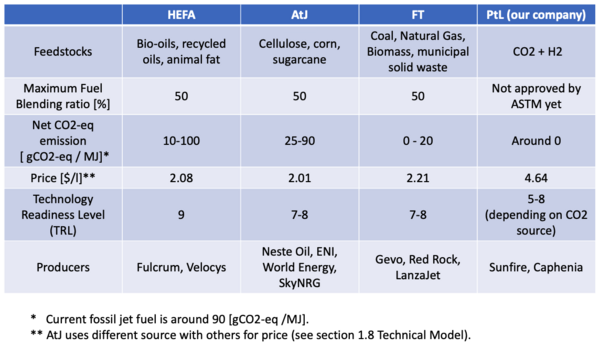
The following table shows the comparison between different SAFs. Our “company” is a Power to Liquid (PtL) type SAF producer. To create the table, different sources are referred: [2] for feedstocks and producers, [3] for feedstocks and fuel blending ratio, [4] for CO2-eq emission, AtJ price, and the technology readiness level, [1] for other prices. Our technology has a huge potential for the reduction of CO2, but the price is the most expensive and the technology readiness level is the lowest currently.
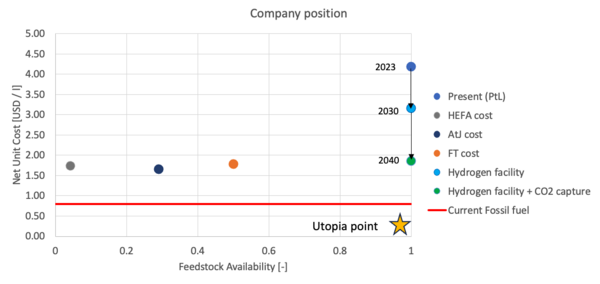
In the figure below, the company position in cost (price) v.s. conversion efficiency is shown. AtJ does not have data for the conversion efficiency, so it is represented with the dotted line. By reducing the feedstock costs and the conversion efficiency, the company will acquire the competitive position with higher conversion efficiency, leading high volume production. Note that there is a room of cost reduction much more than the other technologies as shown in [1].
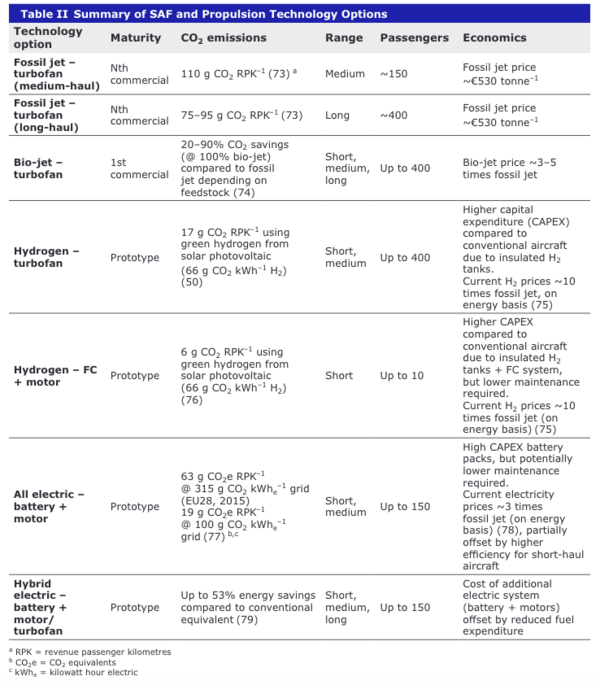
We should finally mention about the comparison with hydrogen and electric aircrafts options. The following table excerpt from [5] shows a comparison with those options, where Bio-jet-turbofun corresponds to SAF. We point out that hydrogen price is 10 times expensive and the electricity prices are ~3 times more expensive (for all electric aircrafts) than than that of the current fossil jet fuel. We also argue that both hydrogen and electric options are still prototype. So in the short term, SAF is the stronger candidate than hydrogen and electric ones.
Technical Model
The figure below shows the morphological matrix for our 2SAF roadmap. Each design choice is highly connected with the pathways: HEFA, AtJ, FT, and PtL. The connections of design choices are shown in the OPM. It is noted that, in SAF conversion, there are some shared choices between different pathways. Thus, those processes can be considered as the possibility of scaling even if we choose one pathway for the first step.
For the quantitative analysis, we consider three important models: cost, CO2 emission, and performance. The detailed explanation for each model is explained in the following subsections.
Unit cost model
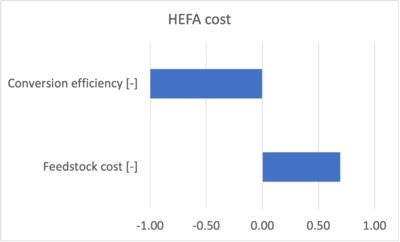
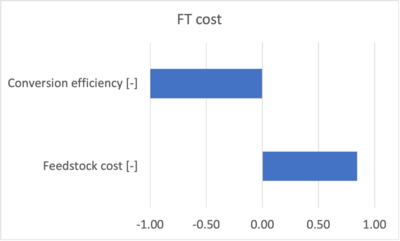
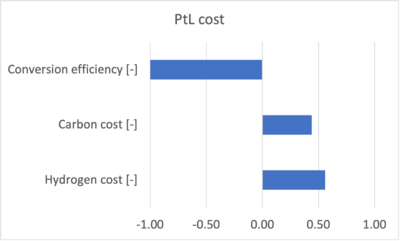
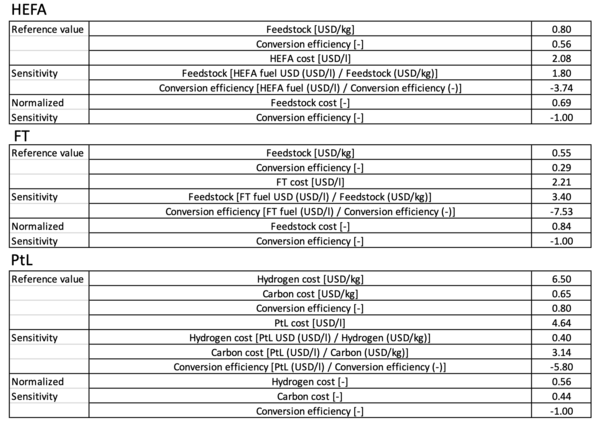
One of the biggest challenges for SAF is cost as explained in section 1.4: Figures of Merit. We use the cost equations shown in the governing equations in chapter 1.4. Based on the equations, the sensitivity of each parameter is assessed in the following figures.
The normalized tornado charts show that the same order of sensitivity between feedstocks and conversion efficiency, though latter has more impact. We show the reference values used for the sensitivity analysis set based on the current cost [1] in the following table.
For FT, we do not have an equation for this roadmap, so we refer the represented values for 2022 shown in [4]. The values are ranged in 1.6 - 2.6 USD/l, assuming 1Euro = 1.05USD.
CO2-eq emission model
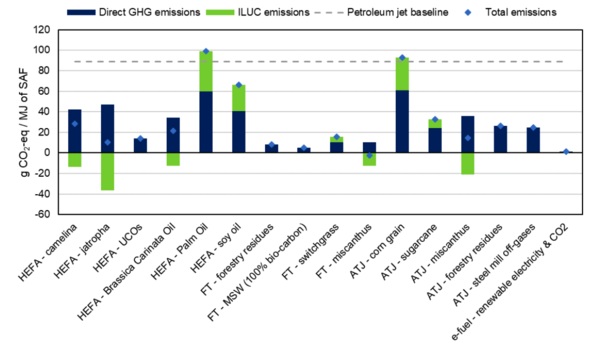
It is difficult to find an equation, which assesses the impact of each design parameter on CO2 emission between variety of pathways. However, [4] summarizes the impact of each pathway on the CO2 emission (see following figure, where the doted line shows the current fossil jet fuel). We use the values for our trade-off analysis, assuming those values will not change much in the future. This approach would be plausible, thinking about the technology readiness level is 9 for HEFA, 8-9 for FT and AtJ, and 5-8 for PTL shown in [4]. In the figure, FT and PtL are capable of large CO2 reduction compared with the current jet fuel.
Since August 2022, the U.S. government gives a credit of 1.25$ per gallon if the lifecycle greenhouse gas emission is reduced over 50% compared to the current jet fuel [6]. A supplemental credit of $0.01 per gallon is also given for each percent that exceeds 50%. We consider the tax credit for computing the net unit cost (see Technical model integration subsection at the bottom of this section).
Fuel consumption model
The impact of SAF on the performance is also important to be assessed. We choose the fuel consumption equation relative to the current fossil fuel of Jet A-1 shown in [7]. The equation is shown in the following figure. Once choosing a SAF, the fuel consumption relative to the Jet A-1 can be computed with the given properties of viscosity, density, and lower heating value. The equations are derived empirically with various types of SAF. The model shows a good agreement with the broad range of data used for its validation.
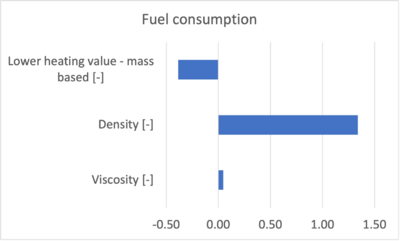
The tornado chart is shown as follows. The density is much smaller impact compared with the viscosity and the lower heating value.
As the reference, we choose HEFA in the source B(54) referred in [7]. The reference values are shown in the following table.
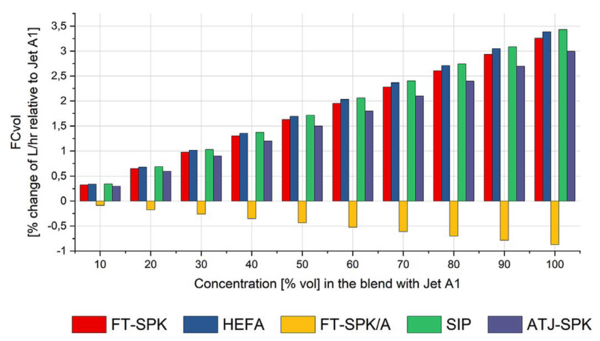
To show the sample computational results, the fuel consumption v.s. the blending ratio for the approved SAFs of HEFA, AtJ, FT, and SIP (out of scope in this roadmap) are shown in the following figure, excerpting from [7]. It should be noted that there is non-negligible impact up to 3.5% on the fuel consumption with 100% blending ratio assumed. Also, [7] reported that there is no clear trends between fuel properties and jet engine performance, so we assume the performance change occurs with thrust fixed.
Feedstock availability model
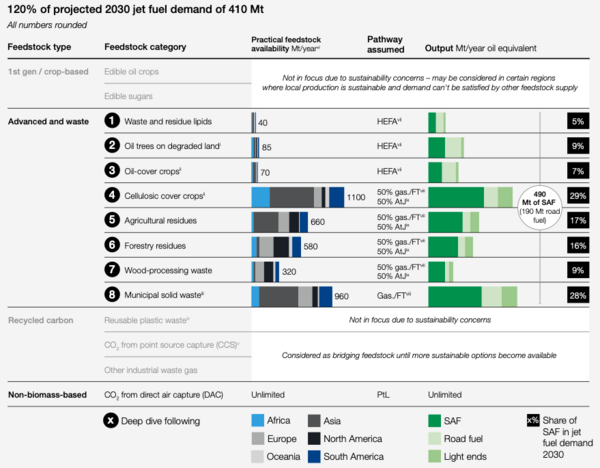
Feedstock availability is an essential factor to assess the scalability of SAF. We use the feedstock availability forecast data given by [8]. The excerpt data is shown in the following figure.
Since PtL has unlimited availability, a normalization is needed so we normalize the availability. First, the normalized value of PtL is set to 1. Second, FT is set to 0.5, resulting in the value of HEFA and AtJ with a liner interpolation assumed (see table below).
Technical model integration
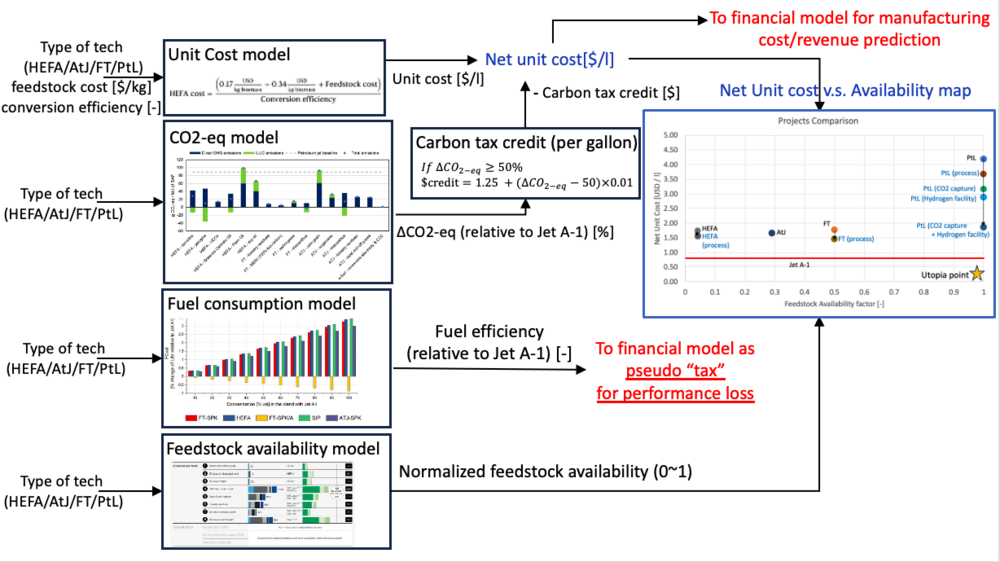
The figure below shows how to integrate the technical models shown above. First, the unit costs of each technology are calculated with feedstock costs and conversion efficiency. CO2 equivalent is computed, averaging the values given in the figure for each technology. To compute the available carbon credit, the value of CO2 equivalent is converted to the percentage relative to Jet A-1. Using the equation shown in the figure, carbon tax credit is computed. With the given unit cost and carbon credit, "Net" unit cost is given. As shown in the feedstock availability subsection, the feedstock availability is normalized from 0 to 1. With the given net unit cost and normalized feedstock availability, we make a trade-off figure for comparison between different type of projects.
Also, fuel efficiency relative to Jet A-1 is computed, using the value given in the figure, assuming 100% blend ratio. Note that the value of FT is averaged value of FT-SPK and FT-SPK/A. The value of PtL is the averaged value of FT-SPK FT-SPK/A and ATJ-SPK since PtL has capability to take both FT and ATJ conversion routes. If a SAF has lower fuel efficiency than Jet A-1, the SAF does not have the same value with Jet A-1, assuming no other performance impact. Thus, we consider this effect as "pseudo" tax in financial model (see 1.8 financial model section).
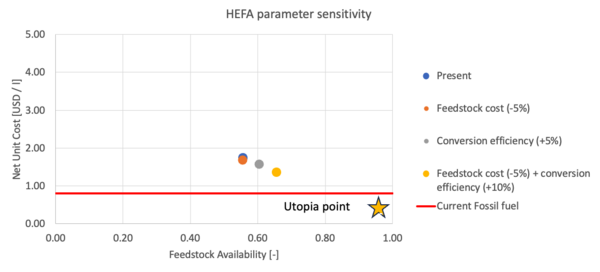
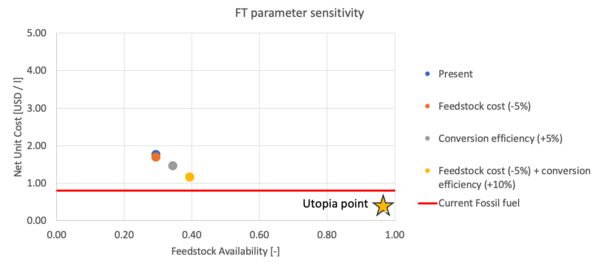
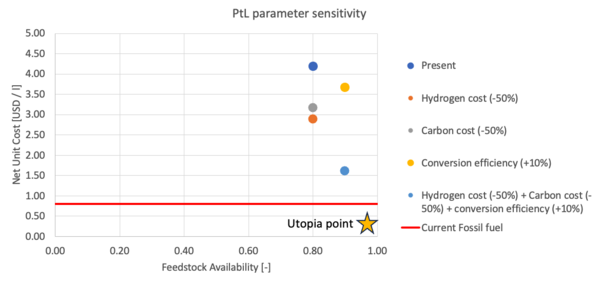
Using the integrated technical model, a sensitivity analysis of net unit cost v.s. feedstock availability is conducted and shown in the following figures. It is assumed that the drastic change for conversion efficiency is difficult since the conversion process has become matured. Also, for HEFA and AtJ, the the cost reduction capability of feedstocks such as bio-fuel, animal fat, and sugar are small, while the feedstocks of CO2 and H2 have a room for the cost reduction. With this figures, PtL is only capable of reducing the cost drastically, though significant effort is needed. We should also note that the cost of PtL becomes competitive with other SAFs when the 50% cost reduction of hydrogen and carbon cost, and 10% cost reduction of conversion efficiency is assumed.
Financial Model
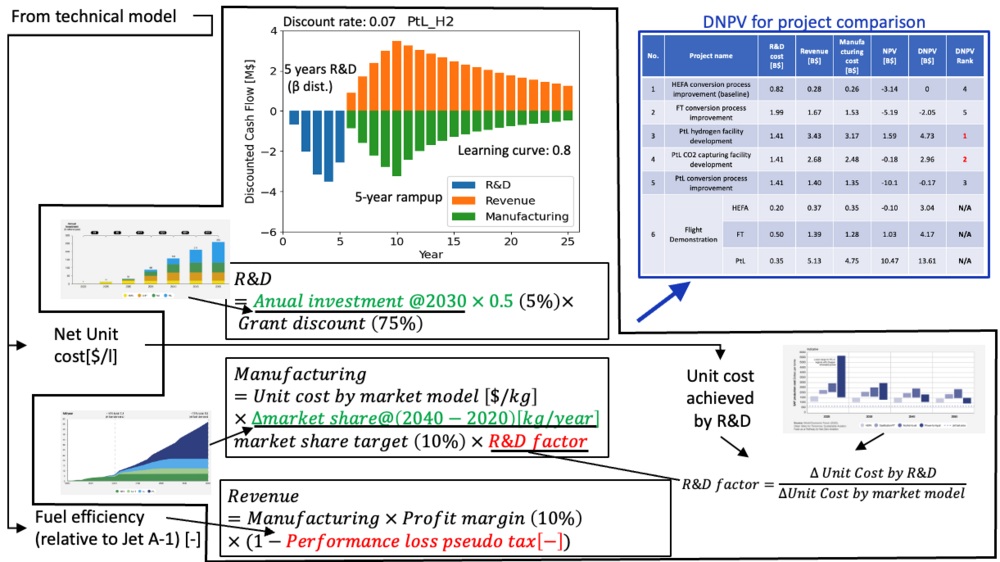
The overview of the financial model is shown in the follwowing figure.
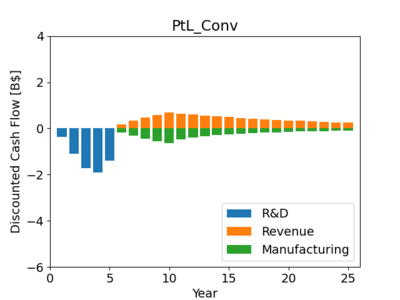
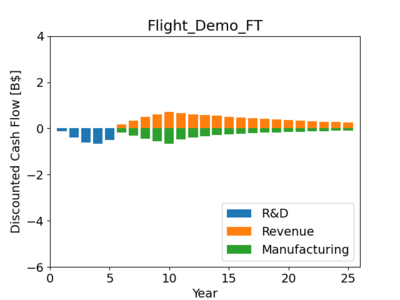
For financial assessment, we use the net present value (NPV) analysis. To compare the candidates of project, delta NPV (DNPV) analysis is conducted, reflecting the results given in section 1.8 technical model. The key assumptions are summarized here:
- For simplicity, the free cash flow is obtained with three categories: R&D, revenue, and manufacturing. For R&D phase, a beta distribution and five year is assumed. Also, the operation phase (for revenue an manufacturing) is set to be 20 years with 5-year linear ramp up. (Other detailed assumptions are shown later).
- The discount rate is set to 7% to compute the discounted cash flow and NPV.
- In manufacturing, the learning curve is set to 0.8.
Assumptions for cash flow computation
- R&D budget is computed with annual investment forecast in 2030 shown by [9]. We assume 5% of the investment can be used as the company's budget, considering our target market share of 10% of the north America. Also, a grant discount of 75% is assumed, referring a [10] in the U.S., where the total grant is $244.53M and up to 75% cost-share is accepted. It should be noted that the grant does not cover our R&D ranges, but we assume similar grant with larger amount will be provided in the near future due to the large interest on SAF.
- Peak manufacturing cost is also computed with the given data by [9]. Unit cost used for the market share forecast and 10% of market share increase (from 2020 to 2040), considering our 20% target market share after multiple projects are used for computation. To take the R&D effects into account, the ratio of unit cost reduction by R&D (given by 1.7 technical model) and expected cost reduction (from 2030 - 2020) in the forecast is multiplied to have final value.
- Peak revenue is computed, multiplying 10% profit margin considered to the manufacturing cost. Also, a performance loss penalty is considered as a "pseudo" tax, using the fuel efficiency relative to Jet A-1 given in section 1.8 technical model.
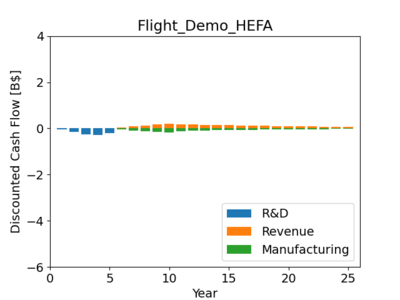
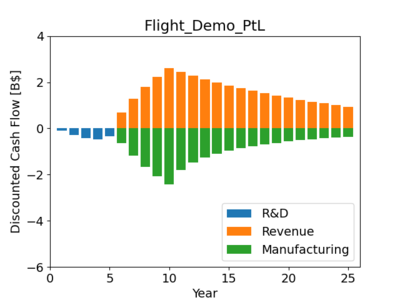
Note that the given forecast data is for Europe so that we modify the value using the difference of the predicted aviation market size in 2028 given by [11] and [12]. We should also note that we consider the flight demonstration project, collaborating with an aircraft manufacture. It is assumed to be led by the aircraft manufacturer, and the R&D budget is used for necessary testing and inspection requested by the manufacturer. Thus, NPV is computed with only R&D cost is reduced to be 25%. In addition, the flight demonstration does not affect the net unit cost reduction so we do not consider the R&D factor mentioned in the manufacturing computation. Full analysis results are shown in 1.9 List of R&D projects.
List of R&D Projects
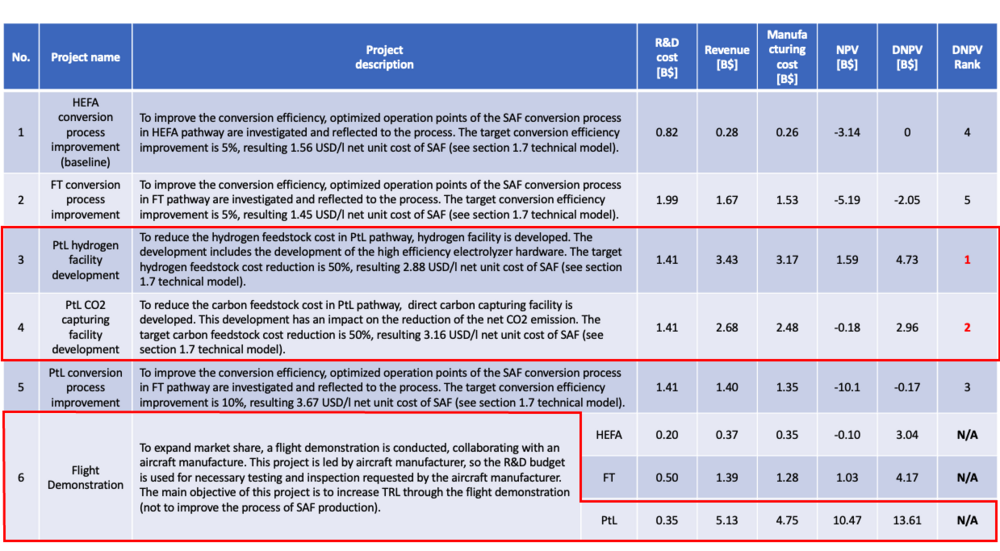
We pick up six candidates of the R&D project for the 2SAF roadmap. To select the projects for our roadmap, we asses them using DNPV analysis, reflecting the results of net unit cost given in section 1.8 technology model (see detailed assumptions in section 1.8 Financial Model). Also, we check the effects of project with the map of net unit cost v.s. feedstock availability.
The results are summarized in the table shown below. Based on the rank of DNPV analysis, we choose three projects of 1) PtL hydrogen facility development, 2) CO2 capturing facility development, and 3) flight demonstration. It should be noted that flight demonstration is not used for ranking of DNPV since the flight demonstration makes sense to have combination with other cost reduction projects. Although the NPV of 2) CO2 capturing facility development is minus, it would be covered with the positive NPVs for other two projects.
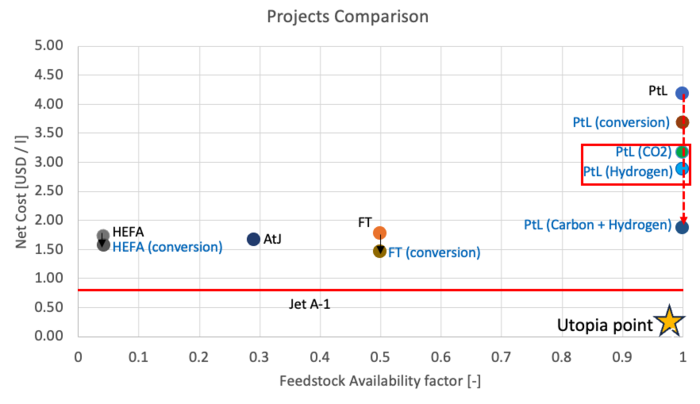
The following figure shows the map of net unit cost v.s. feedstock availability. Although the cost is still higher than the other technologies, HEFA, AtJ, and FT, it has highest feedstock availability with unlimited resources (CO2 and water). To consider the scalability potential, we evaluate the selected projects are fit for our roadmap.
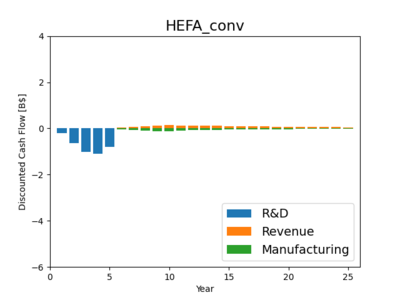
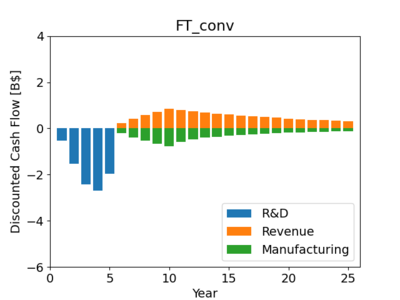
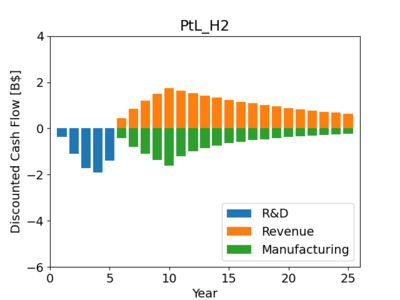
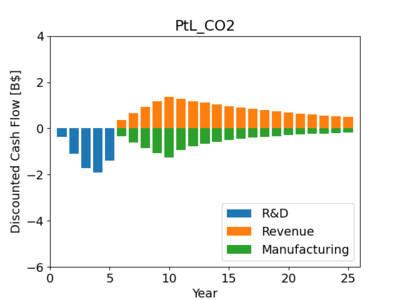
The time development of the discounted cash flow for each project is shown in the following figures.
Key Publications, Presentations and Patents
A thorough survey of literature available in the public domain has been perused to gauge the current progression of various available SAF technologies [13]. Published in 2019, the survey details and highlights the theory and the multiple pathways behind key SAF technologies[13]. Figure P1 is presented below to illustrate the extensive search results of research publications related to SAF since 1960.
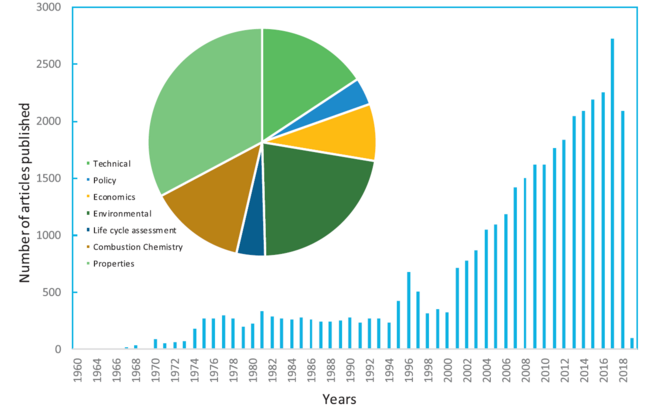
Figure P1. Web of Science data ( > 1960) of bio-aviation fuel publications, with bio-aviation (jet) fuel as main index, and ‘technical, policy, economics, environmental, LCA, combustion chemistry and properties as sub-indices [13]
One key enabling patent for the production of SAF that closely tracks the findings of the extensive literature survey from Figure P1 was granted in Jan 14, 2014 in the United States as Patent No. US8629310B2 (Classification:C10L1/06 and other 34 more classifications) [14]. Granted to associates from the Phillips 66 Company regarding “Transportation Fuels from Biomass Oxygenates", the patent describe a process through which “biocrude” or “oxygenate feedstocks derived from biomass” are converted into hydrocarbons through condensation/oligomerization and hydrodeoxygenation processes [14]. The key figure describing the patent processes are shown below in Figure P2:
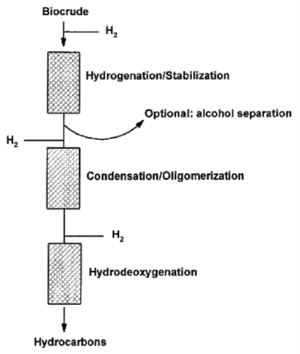
Figure P2. US8629310B2 Patent Process Highlight[14]
This patent is especially relevant to the SAF technology because it presents one of the key pathways for aviation fuels to be produced from non-fossil sources. Numerous research papers that have been published describing the “oxygenic precursors from carbohydrates” conversion into SAF, and many are outlined in [13]. While the patent provides only a summary and does not detail the entire process through which the hydrocarbons are generated, it is nonetheless useful to see that it leverages methods that have been published regarding pathways that have enabled the “production of bio-aviation fuel and precursors through an improved fatty acid and biosynthetic pathway” [13] while also touching upon elements of pathways that enable the “production of bio-aviation fuel and precursors through the alcohol biosynthetic pathway” [13] as an option. Further analysis of the “fatty acid pathways” are cited in [13], among which [15] and [16] are especially relevant for understanding the microbial production of alkanes, which is a key enabler for the technology behind the patent.
Another key patent is in the category of Direct Air Capture (DAC), which extracts CO2 directly from the atmosphere[17]. DAC recently receives a lot of attention as a source of the feedstock of power to liquid (PtL) type SAF, because it is capable of producing SAF, reducing the amount of CO2 in the atmosphere [18]. US20170106330A1 (Classification:B01D53/0423 and other 6 more classifications) [19] is a design for DAC chamber as shown in Figure P3. DAC is one of our main focus areas for the development in the 2SAF roadmap, so the DAC related patent is quite important to be examined.
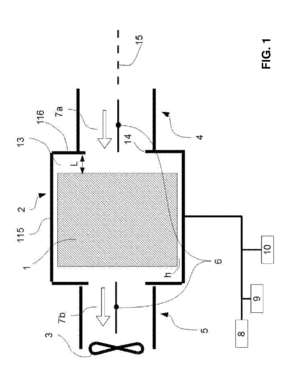
Figure P3. US20170106330A1 Direct Air Capture Device [19]
Technology Strategy Statement
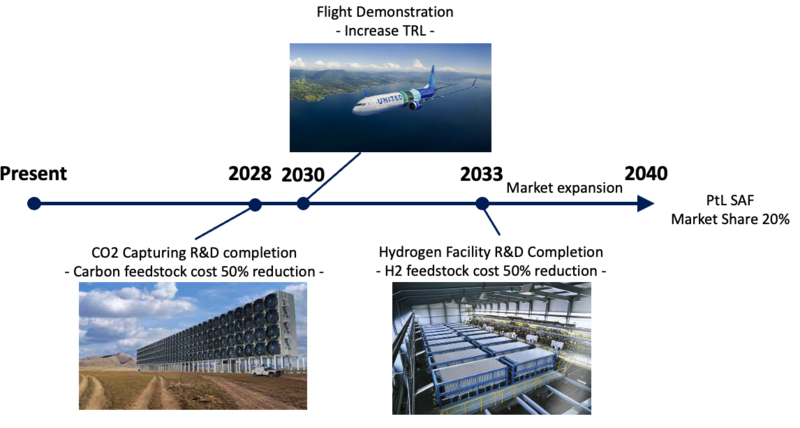
The technology strategy statement of the 2SAF roadmap is shown as follows: Our target is to achieve a 20% market share for the north America, using power to liquid (PtL) technology in the sustainable aviation fuel by 2040, resulting in large contribution to the green aviation. To achieve the goal, CO2 capturing facility development is conducted by 2028. CO2 capturing is a hot topic so the R&D is initiated as the first project to establish a position within the technology field. The target is 50% carbon feedstock unit cost reduction. Next, a flight demonstration, collaborating with aircraft industry is conducted to increase the technology readiness level (TRL) of our PtL technology by 2030. Finally, we will invest H2 facility development, targeting 50% hydrogen cost reduction by 2035. Those projects allow us to reach our technical and business targets for 2040.
References
[1] C. Bergero, G. Gosnell, D. Gielen, S. Kang, M. Bazilian and S. J. Davis, "Pathways to net-zero emissions from aviation," Nature Sustainability, vol. 6, no. 4, pp. 404-414, 2023.
[2] E. G. O'Rear, W. Jones, G. Bower, E. Wimberger and J. Larsen, "Sustainable Aviation Fuels: The Key to Decarbonizing Aviation," Rhodium Group, 2022.
[3] U.S. Department of Energy, "Alternative Fuels Data Center: Sustainable Aviation Fuel," U.S. Department of Energy, [Online]. Available: https://afdc.energy.gov/fuels/sustainable_aviation_fuel.html. [Accessed 1 December 2023].
[4] N. Detsios, S. Theodoraki, L. Maragou, K. Atsonios, P. Grammelis and N. G. Orfanoudakis, "Recent advances on alternative aviation fuels/pathways: A critical review," Energies, vol. 16, no. 4, p. 1904, 2023.
[5] B. Ausilio , N. Bitossi, L. German, A. Harris and K. Leow, "Sustainable Aviation Fuels : Status, challenges and prospects of drop-in liquid fuels, hydrogen and electrification in aviation," Johnson Matthey Technology Review, vol. 64, no. 3, pp. 263-278, 2020.
[6] Internal Revenue Service, "Sustainable Aviation Fuel Credit | Internal Revenue Service," Internal Revenue Service, 2023. [Online]. Available: https://www.irs.gov/credits-deductions/businesses/sustainable-aviation-fuel-credit#:~:text=Amount%20of%20Credit,that%20the%20reduction%20exceeds%2050%25.. [Accessed 1 December 2023].
[7] Y. Kroyan, M. Wojcieszyk, O. Kaario and M. Larmi, "Modeling the impact of sustainable aviation fuel properties on end-use performance and emissions in aircraft jet engines," Energy, vol. 255, p. 124470, 2022.
[8] C. Wolff and D. Riefer, "Clean skies for tomorrow: Sustainable aviation fuels as a pathway to net-zero aviation," in Proceedings of the World Economic Forum, Davos-Klosters, 2020.
[9] McKinsey, "Clean Skies for Tomorrow: Guidelines for a Sustainable Aviation Fuel Blending Mandate in Europe," 2021.
[10] grants.gov, "VIEW GRANT OPPORTUNITY," 25 September 2023. [Online]. Available: https://grants.gov/search-results-detail/350315. [Accessed 1 December 2023].
[11] Mordor Intelligence, "North American Aviation Market Size & Share Analysis," Mordor Intelligence, 2023.
[12] Mordor Intelligence, "European Airline Industry Size & Share Analysis - Growth Trends & Forecasts," Mordor Intelligence, 2023.
[13] M. Wang, R. Dewil, K. Maniatis, J. Wheeldon, T. Tan, J. Baeyens and Y. Fang, "Biomass-derived aviation fuels: Challenges and perspective," Progress in Energy and Combustion Science, vol. 74, pp. 31-49, 2019.
[14] E. Lotero, K. Fjare, T. Shi, S. Pansare and Y. Bao, "Transportation Fuels from Biomass Oxygenates". USA Patent US8629310B2, 14 January 2014.
[15] A. Schirmer, M. A. Rude, X. Li and S. B. Del Cardayre, "Microbial biosynthesis of alkanes," Science, vol. 329, no. 5991, pp. 559-562, 2010.
[16] Y. J. Choi and S. Y. Lee, "Microbial production of short-chain alkanes," Nature, vol. 502, no. 7472, pp. 571-574, 2013.
[17] K. Kackner, H-J Ziock and P. Grimes, "Carbon Dioxide Extraction from Air: Is It An Option?," InProceedings of the 24th Annual TechnicalConference on Coal Utilization&Fuel System, LA-UR-99-0583,1999.
[18] Y. J. Choi and S. Y. Lee, "Microbial production of short-chain alkanes," Energy Convers. Manag., vol. 292, 117427, 2023.
[19] C. Gebald, W. Meier, N. Repond, T. Ruesch, J. A. Wurzbacher, "Direct air capture device". USA Patent US20170106330A1, 20 April 2017.
