Difference between revisions of "User talk:SAF Brazil"
| Line 1: | Line 1: | ||
Roadmap Creators: [https://www.linkedin.com/in/gabriel-ruscalleda/ Gabriel Ruscalleda], [https://www.linkedin.com/in/emilia-ospina-arango-89586584/ Emilia Ospina Arango] and [https://www.linkedin.com/in/dawitdagnaw/ Dawit Dagnaw] | Roadmap Creators: [https://www.linkedin.com/in/gabriel-ruscalleda/ Gabriel Ruscalleda], [https://www.linkedin.com/in/emilia-ospina-arango-89586584/ Emilia Ospina Arango] and [https://www.linkedin.com/in/dawitdagnaw/ Dawit Dagnaw] | ||
Time Stamp: | Time Stamp: Updated 10 October 2024 | ||
=Technology Roadmap Sections and Deliverables= | =Technology Roadmap Sections and Deliverables= | ||
Our technology roadmap identifier is shown as: | Our technology roadmap identifier is shown as: | ||
* ''' | * '''2BSSAF - Brazil Solution - Sustainable Aviation Fuel''' | ||
This indicates that we are dealing with a “level | This indicates that we are dealing with a “level 2” roadmap at the product level, where “level 1” would indicate a market level roadmap, "level 2" would indicate our SAF Production and “level 3” or “level 4” would indicate an individual technology roadmap. | ||
==Roadmap Overview== | ==Roadmap Overview== | ||
( | |||
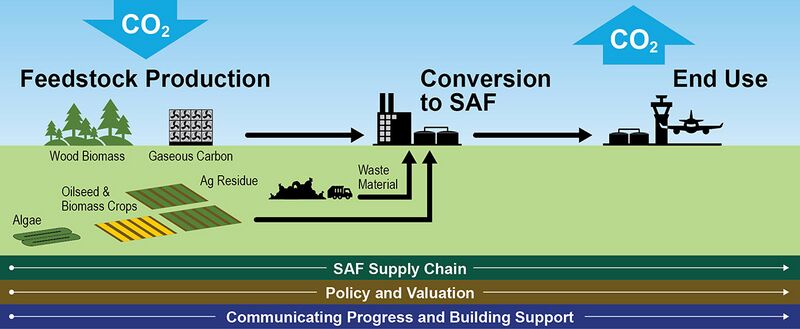
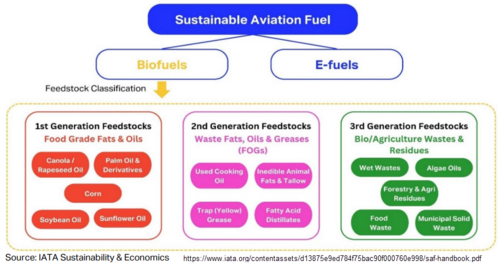
Sustainable aviation fuel (SAF) offers a promising solution for reducing the aviation industry’s carbon footprint, but scaling its production to meet global demand presents significant challenges. Brazil is often referred to as the “Saudi Arabia of sustainable fuels” due to its significant potential and advancements in renewable energy. | |||
This roadmap explores the dilemma of SAF scalability, focusing on two critical aspects: availability and affordability. The feedstock supply and production capacity is analyzed within the country, and innovative strategies are proposed to enhance scalability. Additionally, economic competitiveness of SAF will be evaluated and compared to conventional jet fuel, considering factors such as production costs, market incentives, and policy support in Brazil. | |||
[[File:Figure-2 SAF-roadmap.jpg|800px|left]] | [[File:Figure-2 SAF-roadmap.jpg|800px|left]] | ||
Revision as of 21:01, 7 October 2024
Roadmap Creators: Gabriel Ruscalleda, Emilia Ospina Arango and Dawit Dagnaw
Time Stamp: Updated 10 October 2024
Technology Roadmap Sections and Deliverables
Our technology roadmap identifier is shown as:
- 2BSSAF - Brazil Solution - Sustainable Aviation Fuel
This indicates that we are dealing with a “level 2” roadmap at the product level, where “level 1” would indicate a market level roadmap, "level 2" would indicate our SAF Production and “level 3” or “level 4” would indicate an individual technology roadmap.
Roadmap Overview
Sustainable aviation fuel (SAF) offers a promising solution for reducing the aviation industry’s carbon footprint, but scaling its production to meet global demand presents significant challenges. Brazil is often referred to as the “Saudi Arabia of sustainable fuels” due to its significant potential and advancements in renewable energy.
This roadmap explores the dilemma of SAF scalability, focusing on two critical aspects: availability and affordability. The feedstock supply and production capacity is analyzed within the country, and innovative strategies are proposed to enhance scalability. Additionally, economic competitiveness of SAF will be evaluated and compared to conventional jet fuel, considering factors such as production costs, market incentives, and policy support in Brazil.
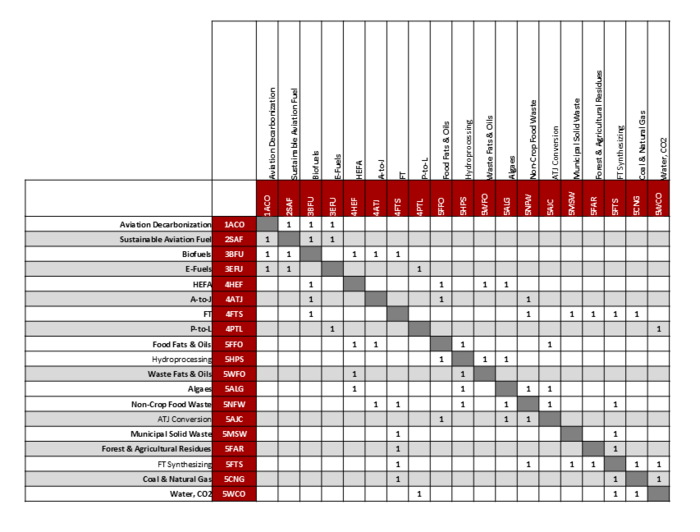
Design Structure Matrix (DSM) Allocation
(DESCRIBE THE DSM)
Roadmap Model using OPM
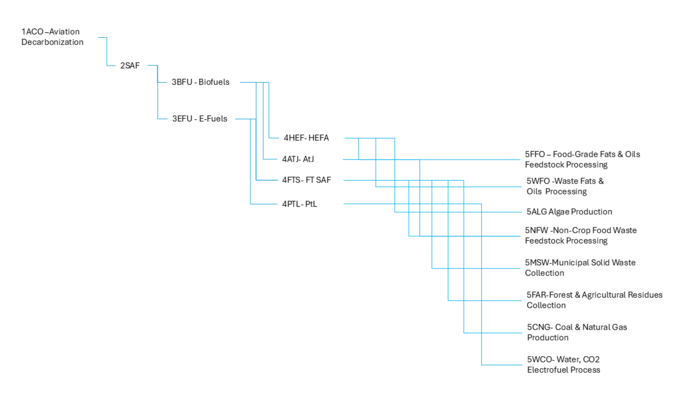
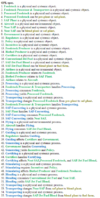
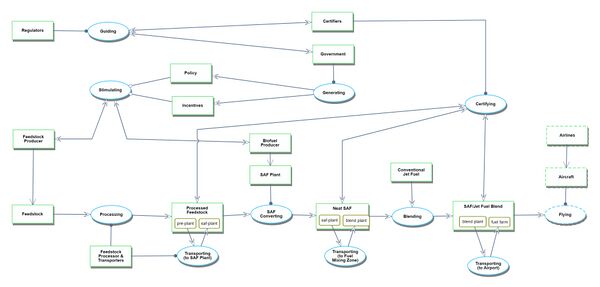
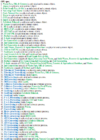
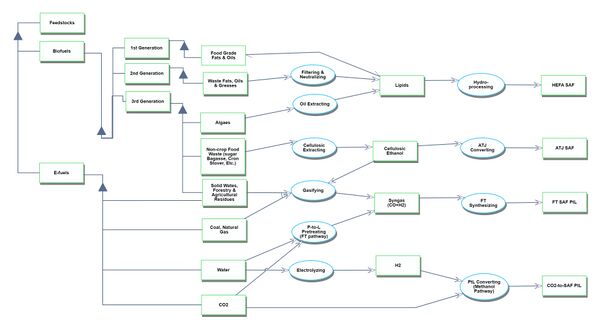
The Object-Process-Model (OPM) of the 3BSSAF - Brazil Solution - Sustainable Aviation Fuel roadmap is presented in the figure with the Object-Process-Language (OPL) below.
Level 1 OPM
Level 2 OPM
Figures of Merit
(ADD)
The table below shows a list of FOMs by which charging of electric vehicles can be quantified and compared
| Category | Figure of Merit | Units | Description |
|---|---|---|---|
| Competitiveness | SAF unit cost | [USD/MJ] | Market cost of SAF per unit of volume or energy |
| Competitiveness | Cost per reduced ton | [USD / tCO2e] | Incremental cost per ton of carbon equivalent reduced vs CAF |
| Competitiveness | Investment potential | [USD / tCO2e] | Financing opportunity per potential unit output of technology |
| Competitiveness | Installation cost per unit | [USD / Vol] | Cost of deploying SAF production infrastructure relative to capability |
| Efficiency | Energy efficiency | [%] | Energy input to produce SAF vs energy output in SAF |
| Productivity | Feedstock crop yield | [Ton / ha] | Crop yield in volume produced per unit area |
| Productivity | Feedstock availability | [Ton / year] | Crop availability in volume produced per year |
| Productivity | SAF conversion yield | [%] | SAF produced with relation to total refinery biofuel production |
| Performance | Energy density | [MJ/Vol] | Energy content per unit volume of fuel |
| Performance | Blend ratio of pathway/feedstock | [%] | Volume SAF relative to total volume of fuel after blend |
| Performance | Fuel consumption | [Vol/Time] | Fuel consumed per hour of flight to compare SAF vs CAF |
| Sustainability | Carbon savings potential | [tCO2e / MJ] | Potential reduction in emissions for use of SAF vs CAF as baseline |
| Sustainability | Carbon emissions | [tCO2e / MJ] | Life-cycle carbon equivalent emissions to generate unit of fuel |
| Sustainability | Emission reduction factor | [%] | Percentage reduction per equivalent unit of use of SAF |
Alignment with Company Strategic Drivers
Positioning of Company vs. Competition
Technical Model
CO2-eq emission model
Fuel consumption model
Feedstock availability model
Technical model integration
Financial Model
List of R&D Projects
Key Publications, Presentations and Patents
Technology Strategy Statement
References
[1] Reference 1 [2] Reference 2
