Difference between revisions of "Water Desalination"
| (16 intermediate revisions by the same user not shown) | |||
| Line 51: | Line 51: | ||
==[[Alignment with Company Strategic Drivers]]== | ==[[Alignment with Company Strategic Drivers]]== | ||
Our Membrane-based desalination technology focuses on developing advanced desalination systems to help solve the world's freshwater scarcity issues with energy-efficient and ecologically benign methods. Such systems will produce fresh water at a low specific energy consumption rate in line with the system's strategic objectives to reduce operational costs and energy dependence while ensuring durability and optimizing membrane lifespan. The technology is also targeted at achieving sustainable brine management with maximum recovery of freshwater with minimal environmental impacts. This aligns with the system requirement to provide appropriate brine disposal using methods such as injection wells, oceanic dispersion, and strict ecological standards. | |||
Efficiency and sustainability measures position this technology as a novel solution for communities and industries searching for dependable, eco-friendly freshwater sources. The aim is to address the most critical economic and ecological challenges to globally occurring drives for sustainable water solutions with our membrane-based desalination technology. Incorporating these emerging advances in membrane technology, energy recovery, and brine management will create new industry standards. | |||
[[File:Alignment with “Company” Strategic Drivers 2MBD.png|600px|]] | |||
==[[Position of Company vs. Competition]]== | ==[[Position of Company vs. Competition]]== | ||
[[File:Desalination position vs competition FOM.png|600px|]] | |||
[[File:Desalination position vs competition FOM 2.png|600px|]] | |||
The above table highlights the Cost of Freshwater ($/m3 Freshwater) and Capacity (m3/day) for 38 unique Desalination Facilities in operation between 1991 and 2008. The plant capacity in the sample set ranges between 9,840 m3/day to 1000000 m3/day. Additionally, the cost of freshwater ranges from $0.48/m³ to $2.27/m³ with an average cost of $0.90/m³ across all facilities. Between the 1990s and the 2000s, the average cost of freshwater decreased from $1.11/m³ to $0.89/m³, and the average facility capacity increased significantly from 32,800 m³/day to 186,000 m³/day, signifying a general shift towards higher-yielding plant architectures. | |||
==[[Technical Model: Morphological Matrix and Tradespace]]== | ==[[Technical Model: Morphological Matrix and Tradespace]]== | ||
| Line 60: | Line 71: | ||
The morphological matrix below details the architectural decisions that must be made when developing a membrane-based desalination system. An example specific system concept that represents an industry standard approach is highlighted in red. | The morphological matrix below details the architectural decisions that must be made when developing a membrane-based desalination system. An example specific system concept that represents an industry standard approach is highlighted in red. | ||
[[File:Morphological Matrix 2MBD.png|600px|Morphological Matrix]] | [[File:Morphological Matrix 2MBD.png|600px|Morphological Matrix]] | ||
| Line 65: | Line 77: | ||
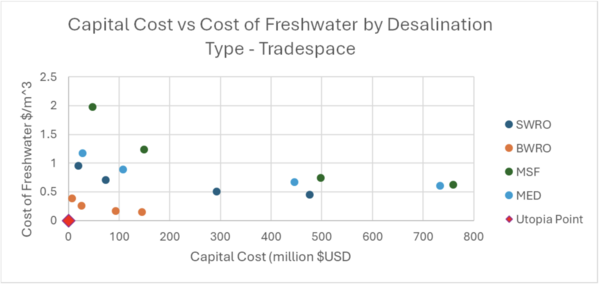
The trade-space below was constructed from data published in Desalination5 to outline the impact of two factors on specific cost of freshwater - membrane assisted desalination type (seawater RO, brackish water RO, multi-stage flash, and membrane enhanced distillation) and capital cost of facility construction. As we can see, the trade-space is dominated by brackish water reverse osmosis – as discussed in the sensitivity analysis above, decreasing concentration of soluble salts in feedwater has an outsized impact on cost of desalination, though is not an attribute that can be easily managed technologically. Cost of capital encompasses multiple other factors and FOMs, but larger plants can easily be made more efficient to decrease specific cost of freshwater. | The trade-space below was constructed from data published in Desalination5 to outline the impact of two factors on specific cost of freshwater - membrane assisted desalination type (seawater RO, brackish water RO, multi-stage flash, and membrane enhanced distillation) and capital cost of facility construction. As we can see, the trade-space is dominated by brackish water reverse osmosis – as discussed in the sensitivity analysis above, decreasing concentration of soluble salts in feedwater has an outsized impact on cost of desalination, though is not an attribute that can be easily managed technologically. Cost of capital encompasses multiple other factors and FOMs, but larger plants can easily be made more efficient to decrease specific cost of freshwater. | ||
[[File:Trade space 2MBD.png|600px|Tradespace]] | [[File:Trade space 2MBD.png|600px|Tradespace]] | ||
'''Technical Model Development''' | |||
Multiple attributes and FOMs are analyzed in the two sensitivity analyses below. First, to model our system comprehensively, we will provide a combined equation for the normalized operational cost of freshwater. Please note that this combines multiple FOMs and numerous variables to provide a thorough description of system financial efficiency with respect to freshwater production. This model does not include any amortized capital costs or levelized cost of capital, nor does it include operational expenses outside of energy consumption (expected to be uniform across implementations on a per m^3 freshwater basis.) | |||
[[File:Operational Cost of Freshwater calc 2MBD.png|600px|]] | |||
'''Example Calculation:''' | |||
To demonstrate this equation functionality, let us assume we have a membrane process requiring a fluid pressure of 530psig to achieve our desired flowrates. In addition, we are utilizing onsite reinjection of brine water for disposal at $0.84/bbl ($5.28/m^3)3. Energy recover devices have been partially installed in the facility, and we are realizing ~20% process efficiency overall from them. We generate 20% brine to 80% freshwater, and we are utilizing retail electricity at a cost of $0.15/kWhr. Pumps and motors are 80% and 90% efficient, respectively. We find that the operational cost to produce a cubic meter of freshwater with this system is $1.22. | |||
[[File:Example Calc 1 2MBD.png|600px|]] | |||
'''Finite Difference Implementation''': | |||
First, we identified a ‘standard’ value for the SOCF based on available data for normal factor ranges. Current installations will have varying setups, so reasonably average values were implemented. The baseline standard operational cost was determined to be $0.672/m^3. | |||
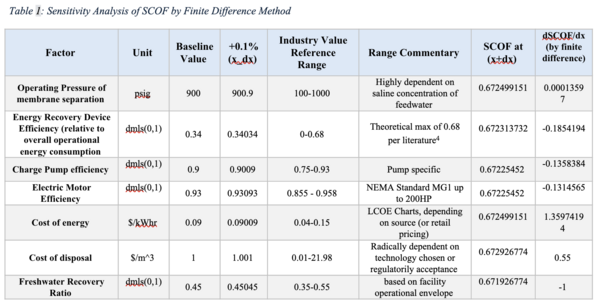
Next, we approximate the partial derivatives of the global SOCF function with respect to each of the variables shown below. This was completed using the finite difference method, in which the SOCF function was assessed at a small change in input value divided by the change in input value to provide a local slope approximation. This small input value change was assessed as a normalized percentage (in our case, 1/10th of 1% yielding normalized technological derivatives as shown in Figure below. The table below shows the values calculated at various steps of the process. From the values and the tornado diagram, we can clearly see that cost of energy will have the most significant normalized impact on SCOF, followed closely by freshwater recovery ratio. Please note that the magnitude is the key attribute representing sensitivity, while the directionality of the relationship is reflected by the sign. | |||
'''FOM#1 Sensitivity Analysis of Specific Operational Cost of Freshwater (SOCF):''' | |||
Note: This figure is a modification of the Specific Energy Consumption (SEC) FOM that combines multiple other FOMs and factors to produce a holistic financial assessment of plant technology and is the key model for this technology. | |||
Finite Difference Implementation: | |||
First, we identified a ‘standard’ value for the SOCF based on available data for normal factor ranges. Current installations will have varying setups, so reasonably average values were implemented. The baseline standard operational cost was determined to be $0.672/m^3. | |||
Next, we approximate the partial derivatives of the global SOCF function with respect to each of the variables shown below. This was completed using the finite difference method, in which the SOCF function was assessed at a small change in input value divided by the change in input value to provide a local slope approximation. This small input value change was assessed as a normalized percentage (in our case, 1/10th of 1% yielding normalized technological derivatives as shown in Figure below. The table below shows the values calculated at various steps of the process. From the values and the tornado diagram, we can clearly see that cost of energy will have the most significant normalized impact on SCOF, followed closely by freshwater recovery ratio. Please note that the magnitude is the key attribute representing sensitivity, while the directionality of the relationship is reflected by the sign. | |||
[[File:Membrane deslination normalized derivative 2MBD.png|600px|]] | |||
[[File:Scof difference method 2MBD.png|600px|]] | |||
'''FOM#2 Sensitivity Analysis of Minimum Osmotic Pressure Requirements:''' | |||
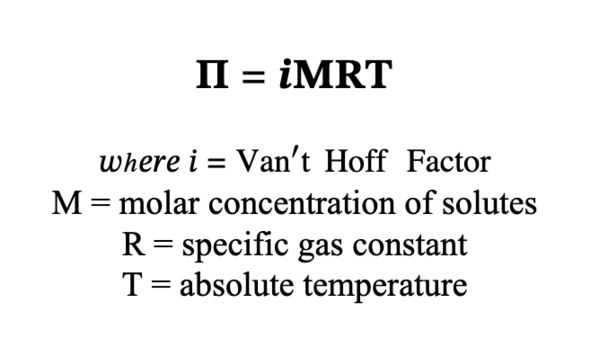
Note: Osmotic pressure is the minimum pressure that must be overcome to force reverse osmosis desalination processes to occur through a semi-permeable membrane. This factor is a critical driver of membrane selection, pump sizing, and power requirements, all of which directly contribute to the specific energy and cost of freshwater production. This factor is a driver of technology rather than a result of it, but because desalination plants can be sited and incorporated with other industrial processes to make use of varying feedwater salt concentrations, salt types, and ambient temperature, this factor necessary for a full system assessment. | |||
[[File:FOM sensitivity analysis 2MBD.png|600px|]] | |||
'''Finite Difference Implementation:''' | |||
The finite difference was implemented as before. For each variable, an empirically determined range available in global seawater supplies was established, as well as a baseline ‘standard’ value. A 1% change in available factor range was used to find the normalized derivative approximation. Sensitivities are shown accordingly in Figure 5 below. Table 2 shows tabulated values. As can be seen in both, the molar concentration of solute is the key driver for osmotic pressure requirements. That is, a desalination system that can minimize the salt concentration (brackish or lower saline seawater) can radically affect pumping pressures required to desalinate via membranes. | |||
[[File:Membrane desal Fig 4 & Tbl 2.png|600px|]] | |||
==[[Financial Model]]== | |||
The financial model of the desalination plant shows a well-structured project with substantial long-term possibilities. The financial model has some important assumptions: daily production capacity at 200,000 m³/day, construction during three years with staged investments of $300M ($120M, $105M, and $75M), and a 10-year operating life. The revenue model assumes a conservative ramp-up starting at 70% capacity in Year 3, reaching total capacity in Year 4-followed by steady 5% annual growth. The water price is approximately $3/m³, which should be competitive for the market. | |||
'''Market Position''' | |||
The revenue growth is solid, increasing from $280M in Year 3 to $537M in Year 10. This trend shows market acceptance and stability of operations. The cost structure stabilizes well after full capacity utilization is achieved: annual operating costs amount to $213M, while energy costs reach $8M, disposal costs amount to $191M, and maintenance costs stand at $14.5M. Indeed, operating margins improved from 65% to 45% over time, signaling enhanced efficiency in operations. | |||
[[File:2MBD market position.png|800px|Market Position]] | |||
'''NPV Analysis''' | |||
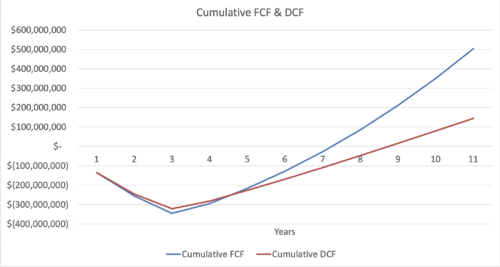
NPV analysis at a 9% discount rate yields a positive NPV of $144.5 M by Year 10. Besides, the cumulative DCF turns positive in Year 8, confirming value creation over and above the cost of capital. The discount rate selected seems sufficient for the risk profile of the project in existing market conditions. | |||
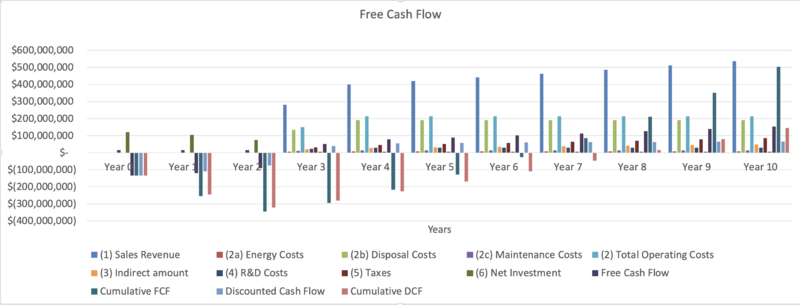
The free cash flow (FCF) analysis reveals a classic project J-curve with significant negative cash flows during the construction period (cumulative -$345M through Year 2), followed by consistently improving positive cash flows starting in Year 3 ($50.6M). The project achieves cumulative positive FCF in Year 7, demonstrating reasonable payback for infrastructure of this scale. By Year 10, the annual FCF reaches $153M with a cumulative FCF of $503M, validating the long-term financial viability of the project. | |||
[[File:2MBD NPV FCF table.png|800px|NPV FCF table]][[File:2MBD NPV FCF Chart.png|800px|NPV FCF table]][[File:2MBD NPV FCF & DCF.png|500px|NPV FCF table]] | |||
'''R&D Strategy''' | |||
The R&D strategy considers technological advancement and risk mitigation. Budget allocation is skewed to critical areas: 35% ($10.5M per year) for membrane research, 25% ($7.5M) for energy efficiency, 20% ($6M) for process optimization, 15% ($4.5M) for environmental management, and 5% ($1.5M) for digital systems. The R&D investment pattern has shown consistency, with $15M per year in annual investment during construction time, increasing to $30M during operation. | |||
[[File:2MBD R & D Strategy table.png|800px|Market Position]] | |||
[[File:2MBD R & D Strategy Chart.png |800px|Market Position]] | |||
==[[List of R&T Projects]]== | |||
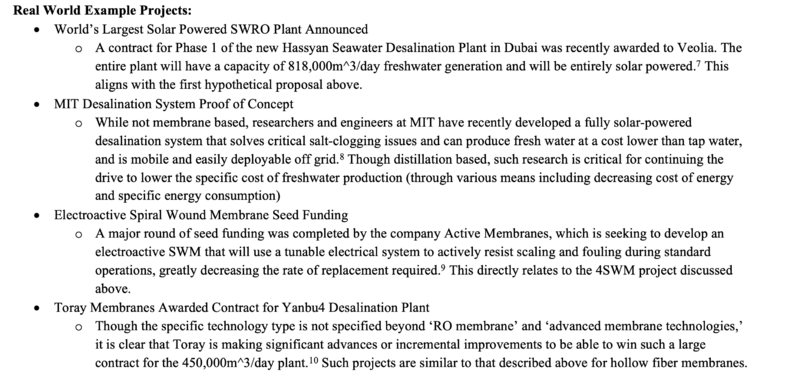
To enable the success of future membrane-based desalination implementations, the following enabling Level 4 technologies are key research project focus areas. Please note that for technologies with higher TRLs the intent of research and development efforts is to incrementally improve performance characteristics to support lower specific costs of freshwater production. Selection of these projects is based on the sensitivity analysis above – highest priorities are decreasing cost of energy for the plants and increasing the freshwater recovery ratio. The first is supported by 4ENS and 4ENH below and the latter is supported by 4HFM, 4SWM, and 4CNT. 4PXR directly minimizes energy consumption and is therefore directly tied to both sensitive characteristics. | |||
'''Proposed R&T Projects to Further Development of 2MBD''' | |||
[[File:2MBD R & T table 1.png|800px|Market Position]] | |||
[[File:2MBD R & T table 2.png|800px|Market Position]] | |||
[[File:2MBD rwe.png|800px|Market Position]] | |||
'''Citations''' | |||
Oirere, Shem. "Veolia Awarded $320M Contract for First Phase of UAE Desalination Project." Engineering News-Record, 2024, https://www.enr.com/articles/58826-veolia-awarded-320m-contract-for-first-phase-of-uae-desalination-project. Accessed 21 Nov. 2024. | |||
Chu, Jennifer. "Desalination System Could Produce Freshwater That Is Cheaper Than Tap Water." MIT News, 27 Sept. 2023, https://news.mit.edu/2023/desalination-system-could-produce-freshwater-cheaper-0927. Accessed 21 Nov. 2024. | |||
Chowdhry, Amit. "Active Membranes Secures Seed Funding to Develop Tech for Large-Scale Desalination Projects." Pulse 2.0, 9 July 2024, https://pulse2.com/active-membranes-secures-seed-funding/. Accessed 21 Nov. 2024. | |||
Kloosterman, Karin. "New Saudi Arabia Desalination Plant Powered by Clean Energy." Green Prophet, 29 Feb. 2024, https://www.greenprophet.com/2024/02/saudi-arabia-desalination-plant-powered-by-clean-energy/. Accessed 21 Nov. 2024. | |||
==[[Technology Strategy Statement]]== | |||
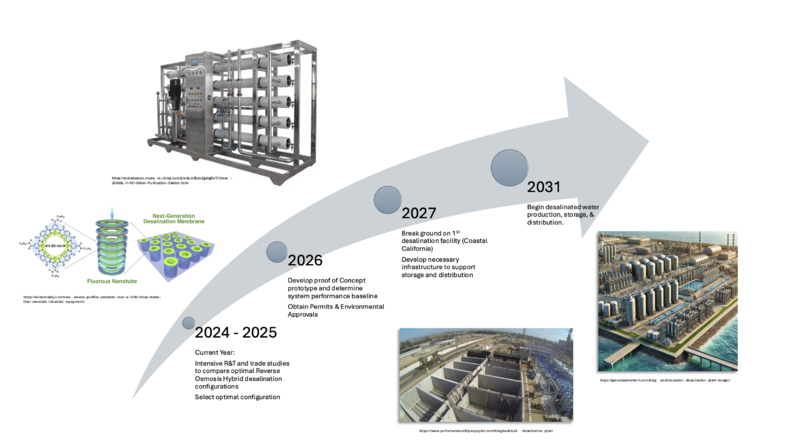
This roadmap aims to facilitate the development and operation of a hybrid reverse osmosis (RO) desalination plant that delivers high-quality potable water efficiently, sustainably, and cost-effectively while minimizing environmental impact and maximizing operational reliability. | |||
[[File:2MBD Swoosh.png|800px|Market Position]] | |||
==[[Key Publications and Patents ]]== | ==[[Key Publications and Patents ]]== | ||
Latest revision as of 16:46, 24 November 2024
Roadmap Overview
- 2MBD - Membrane Based Water Desalination
Jungbin Kim, Kiho Park, Dae Ryook Yang, Seungkwan Hong, “A comprehensive review of energy consumption of seawater reverse osmosis desalination plants”, Applied Energy, Volume 254, 2019, 113652, ISSN 0306-2619, https://doi.org/10.1016/j.apenergy.2019.113652(https://www.sciencedirect.com/science/article/pii/S030626191931339X)
Yang, C., Xu, X., & Guo, W. (2019). Predicting the energy consumption of buildings: A review of data-driven techniques. Applied Energy, 240, 123-136. https://www.filtnews.com/reverse-osmosis-for-desalination/
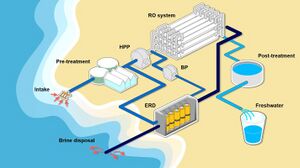
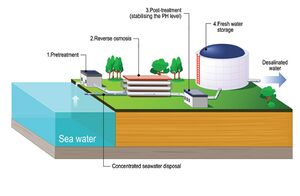
The world's present status on freshwater is progressively getting worse. The United Nations estimates that by 2030, the global demand for freshwater will be 40% higher than in previous years (Jaynes). Dwindling traditional sources of freshwater, population increase, and unpredictable climate change are gradually creating an unsustainable scenario. Given the development in membrane technologies such as reverse osmosis, desalination has been considered an essential means of supplementing freshwater supplies. The desalination process changes seawater into potable freshwater, creating a new and reliable source of freshwater independent of traditional sources. These solutions involve adopting efficient desalination technologies through membrane-based, reverse osmosis systems. These systems can ensure greater efficiency and less energy use than thermal desalination systems (Politano). It comprises several steps, intake, pre-treatment, and filtration through semi-permeable membranes, the procedure would provide drinkable water to sustain demand.
Several emerging technologies, such as Interface Solar Steam Generation and membrane-based desalination, are becoming the most promising developments in the desalination industry. ISSG utilizes solar energy to heat water into steam, which gets condensed into fresh water. It provides complementary technology that could reduce dependence on other energy resources in sunny areas. The technology continues to improve with innovations like hydrophobic graphene-based membranes that further improve salt rejection rates and energy economy (Cai). The second is membrane-based distillation, which couples the thermal process with membrane filtration, showing a very high purity of salient waters (Cai). These technologies address water shortages and meet environmental goals through reductions in carbon footprint and shifts towards renewable energy sources. Such advanced technologies could go a long way toward answering the world's increasing freshwater needs while maintaining ecological sustainability.
Citations
Jaynes, C. H. (n.d.). Global freshwater demand will exceed supply 40% by 2030, experts warn. World Economic Forum. https://www.weforum.org/agenda/2023/03/global-freshwater-demand-will-exceed-supply-40-by-2030-experts-warn/
Antonio Politano et al 2024 J. Phys. Energy 6 021502
Cai, Y., Wu, J., Shi, S. Q., Li, J., & Kim, K.-H. (2023). Advances in desalination technology and its environmental and Economic Assessment. Journal of Cleaner Production, 397, 136498. https://doi.org/10.1016/j.jclepro.2023.136498
Design Structure Matrix (DSM) Allocation
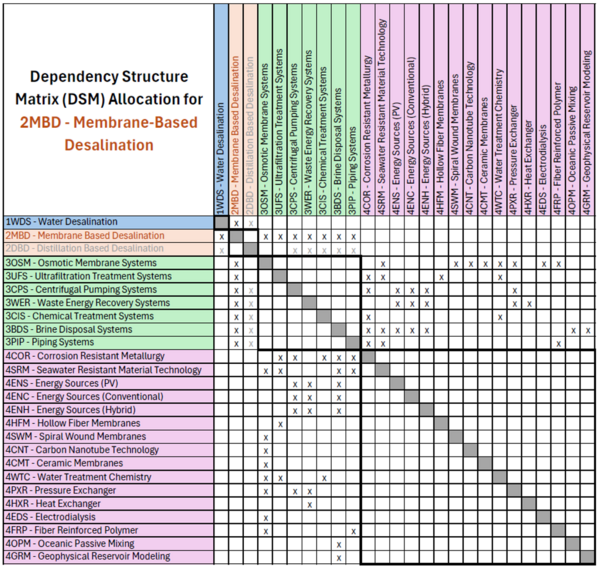
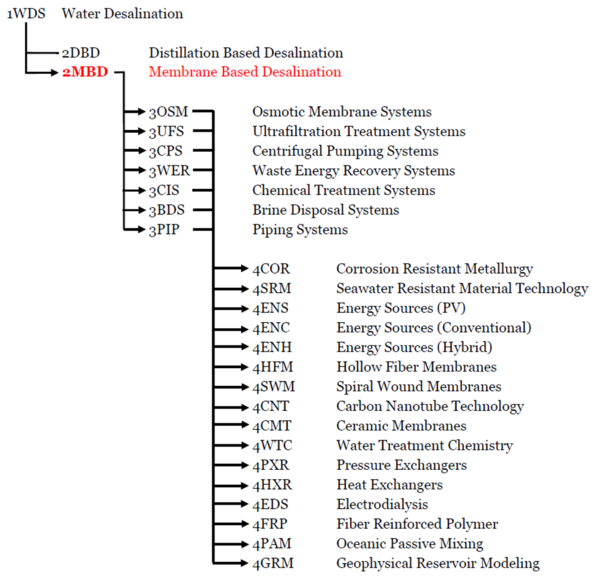
The 2MBD DSM matrix and tree above show the numerous technologies that comprise current membrane-based desalination technology and will contribute to the continued development of highly efficient and lower energy intensive desalination operations of the future. Membrane-based desalination is part of the wider industry initiative pursuing all forms of desalination, including distillation-based desalination (shown above in DSM for reference). The tree clarifies the key enabling technologies necessary for the continued development of 2MBD at the sub-system level including 3OSM (core membrane technology for actively removing salt ions from saltwater), 3UFS (pretreatment and solids removal), 3CPS (providing fluid power to enable process), 3WER (enabling incremental efficiency improvement), 3CIS (allowing for critical chemical treatment processes including coagulation and flocculation), 3BDS (to dispose of brine, the toxic byproduct of desalination, efficiently) and 3PIP (to enable fluid processes and optimize facilities lifespan. These system technologies in turn require the component level technologies shown in the table/tree.
Object Process Diagram - OPD
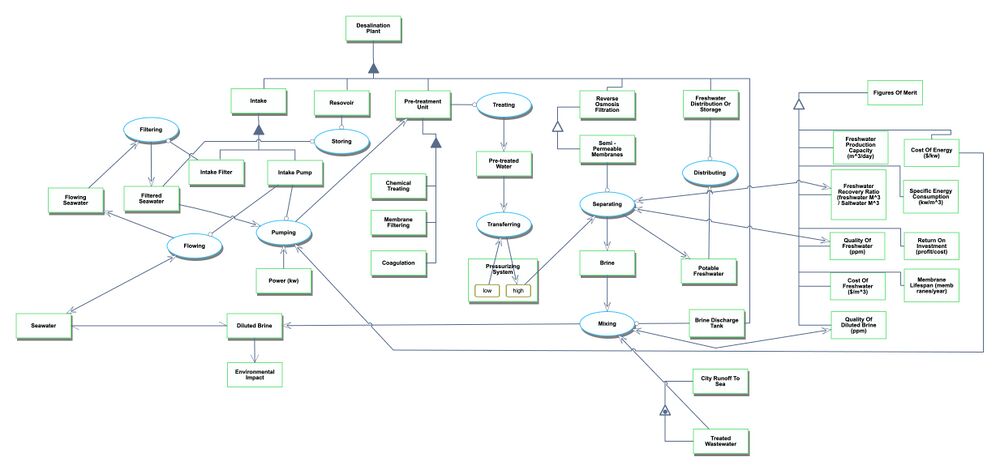
The Object Process Diagram (OPD) for the 2MBD Membrane-Based Desalination roadmap subject and its decomposition is provided in the figure below. This diagram highlights the core 2SEA product level technology and its associated value-related operand (sea/saltwater) as well as the value related processes required for its transformation. The diagram also portrays the necessary and alternative technological subsystems for the various implementations of 2SEA that enable the value processes, as well as the key Figures-of-Merit (FOMs) by which they are qualified.
An Object-Process-Language (OPL) description of the OPD is displayed below.
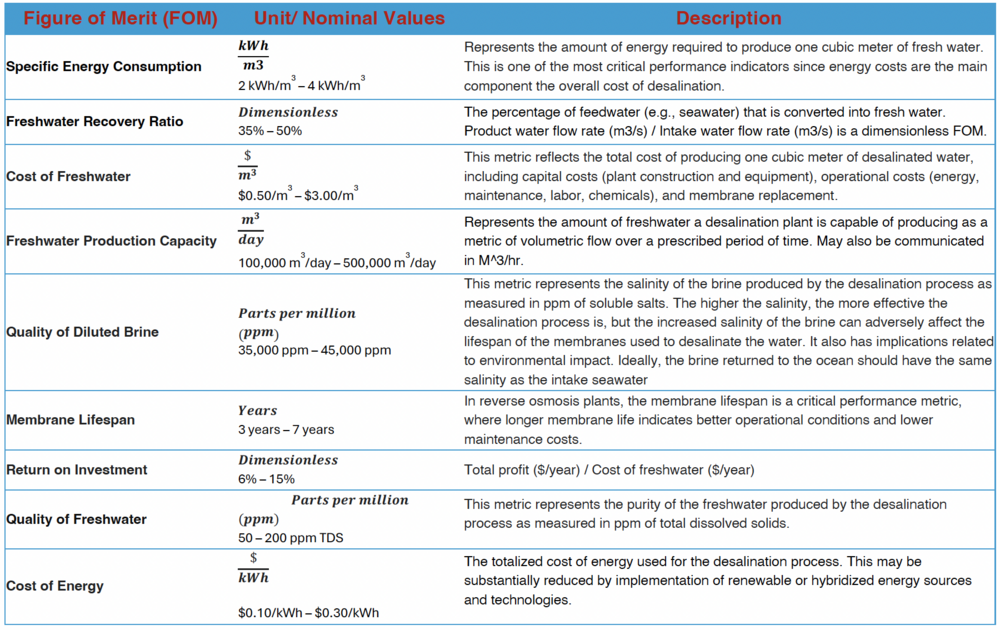
Figures of Merit (FOM)
Alignment with Company Strategic Drivers
Our Membrane-based desalination technology focuses on developing advanced desalination systems to help solve the world's freshwater scarcity issues with energy-efficient and ecologically benign methods. Such systems will produce fresh water at a low specific energy consumption rate in line with the system's strategic objectives to reduce operational costs and energy dependence while ensuring durability and optimizing membrane lifespan. The technology is also targeted at achieving sustainable brine management with maximum recovery of freshwater with minimal environmental impacts. This aligns with the system requirement to provide appropriate brine disposal using methods such as injection wells, oceanic dispersion, and strict ecological standards.
Efficiency and sustainability measures position this technology as a novel solution for communities and industries searching for dependable, eco-friendly freshwater sources. The aim is to address the most critical economic and ecological challenges to globally occurring drives for sustainable water solutions with our membrane-based desalination technology. Incorporating these emerging advances in membrane technology, energy recovery, and brine management will create new industry standards.
Position of Company vs. Competition
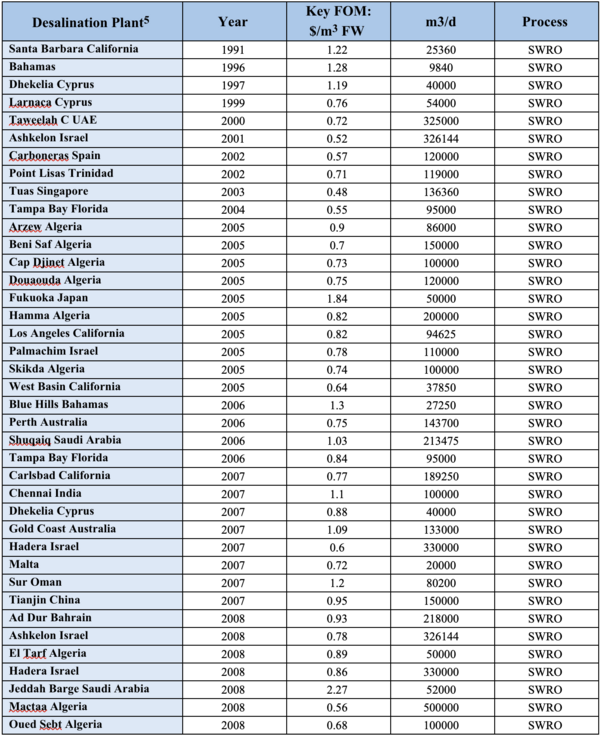
The above table highlights the Cost of Freshwater ($/m3 Freshwater) and Capacity (m3/day) for 38 unique Desalination Facilities in operation between 1991 and 2008. The plant capacity in the sample set ranges between 9,840 m3/day to 1000000 m3/day. Additionally, the cost of freshwater ranges from $0.48/m³ to $2.27/m³ with an average cost of $0.90/m³ across all facilities. Between the 1990s and the 2000s, the average cost of freshwater decreased from $1.11/m³ to $0.89/m³, and the average facility capacity increased significantly from 32,800 m³/day to 186,000 m³/day, signifying a general shift towards higher-yielding plant architectures.
Technical Model: Morphological Matrix and Tradespace
Morphological Matrix
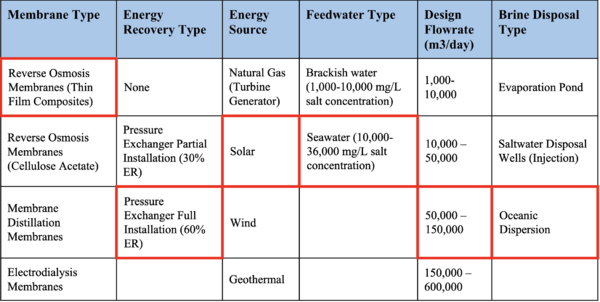
The morphological matrix below details the architectural decisions that must be made when developing a membrane-based desalination system. An example specific system concept that represents an industry standard approach is highlighted in red.
Trade Space
The trade-space below was constructed from data published in Desalination5 to outline the impact of two factors on specific cost of freshwater - membrane assisted desalination type (seawater RO, brackish water RO, multi-stage flash, and membrane enhanced distillation) and capital cost of facility construction. As we can see, the trade-space is dominated by brackish water reverse osmosis – as discussed in the sensitivity analysis above, decreasing concentration of soluble salts in feedwater has an outsized impact on cost of desalination, though is not an attribute that can be easily managed technologically. Cost of capital encompasses multiple other factors and FOMs, but larger plants can easily be made more efficient to decrease specific cost of freshwater.
Technical Model Development
Multiple attributes and FOMs are analyzed in the two sensitivity analyses below. First, to model our system comprehensively, we will provide a combined equation for the normalized operational cost of freshwater. Please note that this combines multiple FOMs and numerous variables to provide a thorough description of system financial efficiency with respect to freshwater production. This model does not include any amortized capital costs or levelized cost of capital, nor does it include operational expenses outside of energy consumption (expected to be uniform across implementations on a per m^3 freshwater basis.)
Example Calculation:
To demonstrate this equation functionality, let us assume we have a membrane process requiring a fluid pressure of 530psig to achieve our desired flowrates. In addition, we are utilizing onsite reinjection of brine water for disposal at $0.84/bbl ($5.28/m^3)3. Energy recover devices have been partially installed in the facility, and we are realizing ~20% process efficiency overall from them. We generate 20% brine to 80% freshwater, and we are utilizing retail electricity at a cost of $0.15/kWhr. Pumps and motors are 80% and 90% efficient, respectively. We find that the operational cost to produce a cubic meter of freshwater with this system is $1.22.
Finite Difference Implementation:
First, we identified a ‘standard’ value for the SOCF based on available data for normal factor ranges. Current installations will have varying setups, so reasonably average values were implemented. The baseline standard operational cost was determined to be $0.672/m^3.
Next, we approximate the partial derivatives of the global SOCF function with respect to each of the variables shown below. This was completed using the finite difference method, in which the SOCF function was assessed at a small change in input value divided by the change in input value to provide a local slope approximation. This small input value change was assessed as a normalized percentage (in our case, 1/10th of 1% yielding normalized technological derivatives as shown in Figure below. The table below shows the values calculated at various steps of the process. From the values and the tornado diagram, we can clearly see that cost of energy will have the most significant normalized impact on SCOF, followed closely by freshwater recovery ratio. Please note that the magnitude is the key attribute representing sensitivity, while the directionality of the relationship is reflected by the sign.
FOM#1 Sensitivity Analysis of Specific Operational Cost of Freshwater (SOCF):
Note: This figure is a modification of the Specific Energy Consumption (SEC) FOM that combines multiple other FOMs and factors to produce a holistic financial assessment of plant technology and is the key model for this technology.
Finite Difference Implementation:
First, we identified a ‘standard’ value for the SOCF based on available data for normal factor ranges. Current installations will have varying setups, so reasonably average values were implemented. The baseline standard operational cost was determined to be $0.672/m^3.
Next, we approximate the partial derivatives of the global SOCF function with respect to each of the variables shown below. This was completed using the finite difference method, in which the SOCF function was assessed at a small change in input value divided by the change in input value to provide a local slope approximation. This small input value change was assessed as a normalized percentage (in our case, 1/10th of 1% yielding normalized technological derivatives as shown in Figure below. The table below shows the values calculated at various steps of the process. From the values and the tornado diagram, we can clearly see that cost of energy will have the most significant normalized impact on SCOF, followed closely by freshwater recovery ratio. Please note that the magnitude is the key attribute representing sensitivity, while the directionality of the relationship is reflected by the sign.
FOM#2 Sensitivity Analysis of Minimum Osmotic Pressure Requirements:
Note: Osmotic pressure is the minimum pressure that must be overcome to force reverse osmosis desalination processes to occur through a semi-permeable membrane. This factor is a critical driver of membrane selection, pump sizing, and power requirements, all of which directly contribute to the specific energy and cost of freshwater production. This factor is a driver of technology rather than a result of it, but because desalination plants can be sited and incorporated with other industrial processes to make use of varying feedwater salt concentrations, salt types, and ambient temperature, this factor necessary for a full system assessment.
Finite Difference Implementation:
The finite difference was implemented as before. For each variable, an empirically determined range available in global seawater supplies was established, as well as a baseline ‘standard’ value. A 1% change in available factor range was used to find the normalized derivative approximation. Sensitivities are shown accordingly in Figure 5 below. Table 2 shows tabulated values. As can be seen in both, the molar concentration of solute is the key driver for osmotic pressure requirements. That is, a desalination system that can minimize the salt concentration (brackish or lower saline seawater) can radically affect pumping pressures required to desalinate via membranes.
Financial Model
The financial model of the desalination plant shows a well-structured project with substantial long-term possibilities. The financial model has some important assumptions: daily production capacity at 200,000 m³/day, construction during three years with staged investments of $300M ($120M, $105M, and $75M), and a 10-year operating life. The revenue model assumes a conservative ramp-up starting at 70% capacity in Year 3, reaching total capacity in Year 4-followed by steady 5% annual growth. The water price is approximately $3/m³, which should be competitive for the market.
Market Position
The revenue growth is solid, increasing from $280M in Year 3 to $537M in Year 10. This trend shows market acceptance and stability of operations. The cost structure stabilizes well after full capacity utilization is achieved: annual operating costs amount to $213M, while energy costs reach $8M, disposal costs amount to $191M, and maintenance costs stand at $14.5M. Indeed, operating margins improved from 65% to 45% over time, signaling enhanced efficiency in operations.
NPV Analysis
NPV analysis at a 9% discount rate yields a positive NPV of $144.5 M by Year 10. Besides, the cumulative DCF turns positive in Year 8, confirming value creation over and above the cost of capital. The discount rate selected seems sufficient for the risk profile of the project in existing market conditions.
The free cash flow (FCF) analysis reveals a classic project J-curve with significant negative cash flows during the construction period (cumulative -$345M through Year 2), followed by consistently improving positive cash flows starting in Year 3 ($50.6M). The project achieves cumulative positive FCF in Year 7, demonstrating reasonable payback for infrastructure of this scale. By Year 10, the annual FCF reaches $153M with a cumulative FCF of $503M, validating the long-term financial viability of the project.
R&D Strategy
The R&D strategy considers technological advancement and risk mitigation. Budget allocation is skewed to critical areas: 35% ($10.5M per year) for membrane research, 25% ($7.5M) for energy efficiency, 20% ($6M) for process optimization, 15% ($4.5M) for environmental management, and 5% ($1.5M) for digital systems. The R&D investment pattern has shown consistency, with $15M per year in annual investment during construction time, increasing to $30M during operation.
List of R&T Projects
To enable the success of future membrane-based desalination implementations, the following enabling Level 4 technologies are key research project focus areas. Please note that for technologies with higher TRLs the intent of research and development efforts is to incrementally improve performance characteristics to support lower specific costs of freshwater production. Selection of these projects is based on the sensitivity analysis above – highest priorities are decreasing cost of energy for the plants and increasing the freshwater recovery ratio. The first is supported by 4ENS and 4ENH below and the latter is supported by 4HFM, 4SWM, and 4CNT. 4PXR directly minimizes energy consumption and is therefore directly tied to both sensitive characteristics.
Proposed R&T Projects to Further Development of 2MBD
Citations
Oirere, Shem. "Veolia Awarded $320M Contract for First Phase of UAE Desalination Project." Engineering News-Record, 2024, https://www.enr.com/articles/58826-veolia-awarded-320m-contract-for-first-phase-of-uae-desalination-project. Accessed 21 Nov. 2024.
Chu, Jennifer. "Desalination System Could Produce Freshwater That Is Cheaper Than Tap Water." MIT News, 27 Sept. 2023, https://news.mit.edu/2023/desalination-system-could-produce-freshwater-cheaper-0927. Accessed 21 Nov. 2024.
Chowdhry, Amit. "Active Membranes Secures Seed Funding to Develop Tech for Large-Scale Desalination Projects." Pulse 2.0, 9 July 2024, https://pulse2.com/active-membranes-secures-seed-funding/. Accessed 21 Nov. 2024.
Kloosterman, Karin. "New Saudi Arabia Desalination Plant Powered by Clean Energy." Green Prophet, 29 Feb. 2024, https://www.greenprophet.com/2024/02/saudi-arabia-desalination-plant-powered-by-clean-energy/. Accessed 21 Nov. 2024.
Technology Strategy Statement
This roadmap aims to facilitate the development and operation of a hybrid reverse osmosis (RO) desalination plant that delivers high-quality potable water efficiently, sustainably, and cost-effectively while minimizing environmental impact and maximizing operational reliability.
Key Publications and Patents
Publications
1. Park, K., Kim, J., Yang, D. R., & Hong, S. (2020). “Towards a low-energy seawater reverse osmosis desalination plant: A review and theoretical analysis for future directions.” Journal of Membrane Science, 595, 117607.
This comprehensive review paper analyzes strategies to reduce energy consumption in seawater reverse osmosis (SWRO) desalination plants. The authors examine three main approaches for improving energy efficiency: Minimizing irreversible work of high-pressure pumps. Decreasing osmotic pressure of feed water. Recovering osmotic energy from RO concentrate.
It is closely related to the development of membrane-based desalination technology since the energy topic remains one of the hurdles for the significant acceptance of SWRO. The authors perform theoretical analyses and evaluate possible methods for energy savings calculation. For example, in a two-stage RO configuration, the specific energy consumption is predicted to be reduced by 0.34 kWh/m3 compared to single-stage RO. The review also critically assesses emerging technologies, such as batch and semi-batch reverse osmosis processes, forward osmosis-RO hybrids, and pressure-retarded osmosis for energy recovery, while giving balanced assessments of the associated benefits and practical limitations. From one broad perspective, this paper presents tremendous work to understand the state-of-the-art SWRO energy reduction strategies and detect the most promising ways to focus future research and further develop and realize a more energy-efficient membrane desalination system.
2. Saleem, H., Abounahia, N., Siddiqui, H. R., & Zaidi, S. J. (2023). “Qatar desalination research: An overview.” Desalination, 564, 116802.
The present review paper aims to outline efforts in research and development in desalination within Qatar, which depends heavily on seawater desalination for freshwater supply. In the present paper, the peculiar features of the Arabian Gulf and its influence on desalination are discussed, together with the history of Qatar's adoption of technology in desalination and the current desalination facilities and technologies utilized. This paper is relevant to membrane-based desalination in light of Qatar's recent shift towards more RO capacity incorporation into its desalination portfolio. The authors discuss how newer plants, like Ras Abu Fontas A3 and Umm Al Houl, use large-scale RO to improve energy efficiency and environmental impacts compared to traditional thermal desalination methods. The review covers continuing research conducted at institutions located in Qatar on several membrane technologies that include RO, forward osmosis, electrodialysis, and membrane distillation. It covers efforts to develop novel membranes, enhance processes, and integrate desalination with renewable energy sources. This is an exciting source of information regarding research priorities and challenges unique to Qatar in terms of desalination and water-scarce challenges facing others in regions with severe feed-water conditions.
3. Ahmed, F., Hashaikeh, R., Hilal (2020). “Hybrid technologies: The future of energy efficient desalination - A review.” Desalination, 495, 114659.
This paper addresses hybrid desalination technologies as one of the most promising approaches to reducing energy consumption and enhancing overall performance compared to stand-alone systems. This paper is very relevant to the development of membrane-based desalination technology because it covers various hybrid configurations involving well-established membrane processes like reverse osmosis (RO) and emerging membrane technologies like forward osmosis (FO) and membrane distillation (MD). The authors review how hybridization can help overcome the limitations of individual membrane processes. Coupling RO with electrodialysis, for example, can result in higher overall recovery rates than could be achieved by RO alone. The article discusses new integrated module designs for hybrid membrane systems, potentially allowing more compact and efficient desalination. It also identifies the prospect of combining the technologies of salinity gradient power with membrane desalination, such as pressure retarded osmosis, for further improvement in energy efficiency. This review pinpoints critical areas needing additional research to optimize hybrid membrane configurations, such as developing drawing solutions for FO hybrids and analyzing energy consumption for emerging combinations. This paper provides wide-based insight into the current state and future potential of these hybrid technologies at work in reducing energy consumption and improving performance in membrane-based desalination processes. As a comprehensive review, the hybrid configurations discussed are relevant for future research and development
Patents
1. Casimiro, Sergio Miguel Alegria. System and Method for Monitoring Performance of Membranes in Reverse Osmosis (RO) System. Patent Application Publication US 2024/0327246 A1. 3 Oct. 2024.
Patent Discussion and Relevance to Membrane Desalination Development: As discussed in Problem Set #2, one of the key figures of merit for membrane-based desalination technology is tied to the costs associated with membrane replacement and membrane degradation. Membranes are extremely expensive for a consumable component, so more frequent replacement can substantially impact the operating expenses for a plant. In addition, as membranes degrade and become less efficient, they require higher pumping pressures to achieve the same permeate throughput. This directly increases power consumption and associated costs. One mitigating technology to extend membrane lifespan and performance is through automated cleaning systems that backwash and chemically treat membranes to remove scaling and fouling.
This patent application details a specific method of monitoring membrane performance on an individual membrane basis. It involves embedded sensors on permeate tubes within each separator housing to monitor pH, temperature, salinity, and pressure. As certain changes in flow characteristics are observed, a control system can assess each membrane status individually, and suggest specifically targeted cleanings or interventions. By allowing for earlier identification of degradation issues and targeting cleaning processes, the system performance can be maintained at a higher level for the duration of its lifespan and membrane lifespan can be extended. Furthermore, by individually assessing membrane, interventions can be accomplished in a manner that keeps the overall desalination system online, allowing for constant production rates. Finally, by identifying individually problematic membranes, replacement scopes can be minimized to extract the full value from each membrane, rather than replacing all of them on a matching time cycle.
2. Aljundi, Isam Hassan. Doubly Porous Multi-Layer Desal Membrane. U.S. Patent 12,121,868 B2. 22 Oct. 2024
Patent Discussion and Relevance to Membrane Desalination Development:
Another significant driver of industrial membrane-based desalination system performance is the characteristics of the implemented membranes themselves. Based on many complex characteristics and attributes, membranes can have different pressure differential requirements, different water flux and salt rejection properties, different chemical weakness and resistances, and different manufacturability aspects that can drive cost and lifespan. Each of these aspects will have a significant impact on the specific cost of freshwater production associated with a desalination system.
This specific patent details a unique type of membrane intended specifically for desalination use. This membrane has multiple layers, including a mixed polyamide layer deposited on a porous polysulfone layer. This membrane can allow a water flux of 53-300L/m^2/hr over a membrane dP of 5-60bar, rejecting 30-75% of chloride salts and 70-99.6% of sulfate salts. Several proposed fabrication methods are included in the patent (phase inversion and interfacial polymerization), as is a description of a possible implementation in a desalination system. This particular membrane technology would be highly relevant for any desalination system installed in a context where feedwater may be particularly high in sulfate salts, or where sulfate salts are extremely restricted based on downstream use cases for the water.
3. Lehner, Daniela, et al. Fluid Exchanger Devices, Pressure Exchangers, and Related Methods. U.S. Patent 10,309,426 B2. 4 June 2019.
Patent Discussion and Relevance to Membrane Desalination Development:
As discussed previously, one of the key cost drivers for membrane-based desalination is the energy consumption required to force water through membrane separators at high pressure. One of many avenues for reducing this energy consumption (and therefore reducing the cost of freshwater) is via waste energy recovery. While the vast majority of previous thermofluidic research and development efforts have been focused on heat exchangers for waste recovery, this is not relevant for the low temperature processes for most membrane-based desalination. However, given the high pressures membrane separators operate at (often >500psi), waste brine/filtrate streams exit at significant pressures. In order to recover this energy, pressure exchangers may be used. Featuring rotating components that allow columns of filtrate to come in contact with feedwater brine, entrance pressure may be raised without the need for excessive powered pumping equipment.
In this patent, we can see one novel version of a pressure exchanger described. As compared to some commonly used devices with rotating fluid contact ducts/columns, this technology design implements rotating valve assemblies and stationary ducting. The advantages of this approach as described in the patent include an improved efficiency due to minimized cavitation and vibration as compared to traditional pressure recovery devices, as well as straightforward scalability for larger industrial systems due to the high-risk leakage components (ducts) allowing high flow volumes without increasing risk. Though in the context of membrane-based desalination this device would only represent an incremental improvement in energy efficiency, these developments are critical to the continuous increasing efficiency and applicability of desalination.
Sources
Jaynes, C. H. (n.d.). Global freshwater demand will exceed supply 40% by 2030, experts warn. World Economic Forum. https://www.weforum.org/agenda/2023/03/global-freshwater-demand-will-exceed-supply-40-by-2030-experts-warn/
Antonio Politano et al 2024 J. Phys. Energy 6 021502
Cai, Y., Wu, J., Shi, S. Q., Li, J., & Kim, K.-H. (2023). Advances in desalination technology and its environmental and Economic Assessment. Journal of Cleaner Production, 397, 136498. https://doi.org/10.1016/j.jclepro.2023.136498
International Filtration News. (2019, October 11). Reverse osmosis for desalination. International Filtration News. Retrieved from https://www.filtnews.com/reverse-osmosis-for-desalination/
Yang, C., Xu, X., & Guo, W. (2019). Predicting the energy consumption of buildings: A review of data-driven techniques. Applied Energy, 240, 123-136. https://doi.org/10.1016/j.apenergy.2019.01.123
