Difference between revisions of "User talk:SAF Brazil"
m (Ddawit moved page User talk:Rusca02 to User talk:SAF Brazil) |
|||
| (28 intermediate revisions by 2 users not shown) | |||
| Line 1: | Line 1: | ||
Roadmap Creators: [https://www.linkedin.com/in/gabriel-ruscalleda/ Gabriel Ruscalleda], [https://www.linkedin.com/in/emilia-ospina-arango-89586584/ Emilia Ospina Arango] and [https://www.linkedin.com/in/dawitdagnaw/ Dawit Dagnaw] | Roadmap Creators: [https://www.linkedin.com/in/gabriel-ruscalleda/ Gabriel Ruscalleda], [https://www.linkedin.com/in/emilia-ospina-arango-89586584/ Emilia Ospina Arango] and [https://www.linkedin.com/in/dawitdagnaw/ Dawit Dagnaw] | ||
Time Stamp: Updated | Time Stamp: Updated 3 December 2024 | ||
=Technology Roadmap Sections and Deliverables= | =Technology Roadmap Sections and Deliverables= | ||
| Line 34: | Line 34: | ||
[[File:Figure-2 SAF-roadmap.jpg| | [[File:Figure-2 SAF-roadmap.jpg|900px|]] | ||
| Line 73: | Line 73: | ||
===Level 1 OPM: Main Stakeholders=== | ===Level 1 OPM: Main Stakeholders=== | ||
[[File:SAF OPL level1 updated2.png |200px |thumb| right | ]] | [[File:SAF OPL level1 updated2.png |200px |thumb| right | ]] | ||
[[File:SAF OPD level1 updated 2.jpeg | | [[File:SAF OPD level1 updated 2.jpeg |800px|]] | ||
===Level 2 OPM: Feedstock and Pathways=== | ===Level 2 OPM: Feedstock and Pathways=== | ||
[[File:SAF OPL level2.png |200px |thumb|]] | [[File:SAF OPL level2.png |200px |thumb|]] | ||
[[File:SAF OPD level2.jpeg | | [[File:SAF OPD level2.jpeg |800px|]] | ||
==Figures of Merit (FOM)== | ==Figures of Merit (FOM)== | ||
| Line 283: | Line 283: | ||
==Technical Model== | ==Technical Model== | ||
The morphological matrix for our SAF roadmap. As in the OPM, the connection of each design to the pathways | The morphological matrix for our SAF roadmap. As in the OPM, the connection of each design to the pathways is shown in the table. Out of the different pathways, the HEFA pathway is suitable for co-processing, providing advantages with scalability. The morphological matrix further highlights different feedstocks in each pathway. Feedstocks in the AtJ pathway are the most cost-competitive for Brazil according to the unit cost (figures of merit) highlighted. | ||
===Morphological Matrix for SAF Feedstocks=== | ===Morphological Matrix for SAF Feedstocks=== | ||
| Line 343: | Line 343: | ||
{| class="wikitable" | {| class="wikitable" | ||
|+ Key Relationships and Governing Equations | |+ Key Relationships and Governing Equations | ||
|- | |- | ||
! Inputs !! Key Relationship or Governing Equation !! Outputs | ! Inputs !! Key Relationship or Governing Equation !! Outputs | ||
|- | |- | ||
| Biomass mass, feedstock cost, and conversion efficiency || [[File:SAF HEFA Equation.PNG]] || HEFA (Hydroprocessed Esters and Fatty Acids) unit cost | | Biomass mass, feedstock cost, and conversion efficiency || [[File:SAF HEFA Equation.PNG| 400px]] || HEFA (Hydroprocessed Esters and Fatty Acids) unit cost | ||
|- | |- | ||
| Biomass mass, feedstock cost, and conversion efficiency || [[File:SAF FT Equation.PNG]] || Fischer-Tropsch (FT) unit cost | | Biomass mass, feedstock cost, and conversion efficiency || [[File:SAF FT Equation.PNG| 400px]] || Fischer-Tropsch (FT) unit cost | ||
|- | |- | ||
| Alcohol feedstock (ethanol and iso-butanol) || [[File:SAF AtJ Equation.PNG]] || Alcohol-to-Jet (AtJ) unit cost | | Alcohol feedstock (ethanol and iso-butanol) || [[File:SAF AtJ Equation.PNG| 400px]] || Alcohol-to-Jet (AtJ) unit cost | ||
|- | |- | ||
| Hydrogen unit cost, Carbon unit cost, and conversion efficiency || [[File:SAF PtL Equation.PNG]] || Power-to-Liquid (PtL) unit cost | | Hydrogen unit cost, Carbon unit cost, and conversion efficiency || [[File:SAF PtL Equation.PNG| 400px]] || Power-to-Liquid (PtL) unit cost | ||
|- | |||
| Carbon Intensity (CI) is measured as lifecycle greenhouse gas (GHG) emissions per unit energy of SAF fuel || [[File:CI saf.jpg | 400px]] || GBG emissions components [[File:CI saf comp.jpg | 400px]] | |||
|} | |} | ||
To determine emissions reduction from using SAF, we can compare its carbon intensity to that of conventional jet fuel, which is typically around 89 gCO2e/MJ. | |||
===Sensitivity analysis: Tornado Chart=== | ===Sensitivity analysis: Tornado Chart=== | ||
The normalized tornado charts below show the sensitivity between feedstock production cost and carbon intensity. Considering the cost of feedstock, the 'company' will prioritize ATJ pathway for SAF production. As feedstock production costs improve, we will start producing from sources with less carbon intensity ideally PtL. | |||
[[File: | [[File:Tornado Chart - Sensitivity Analysis.jpg | 1000px]] | ||
===Tradespace for SAF Feedstock Types=== | ===Tradespace for SAF Feedstock Types=== | ||
Feedstock carbon intensity and production costs are two key figures of merit (FOM) analyzed comparing different SAF pathways and feedstocks. While PtL has the highest production cost, it has the lowest carbon intensity. It has great potential to move to Utopia Point with more technological advancements and cost-efficiency improvements. HEFA continues to lower cost, making it scalable, but it has a relatively higher carbon intensity than the other feedstocks. | Feedstock carbon intensity and production costs are two key figures of merit (FOM) analyzed comparing different SAF pathways and feedstocks. While PtL has the highest production cost, it has the lowest carbon intensity. It has great potential to move to Utopia Point with more technological advancements and cost-efficiency improvements. HEFA continues to lower cost, making it scalable, but it has a relatively higher carbon intensity than the other feedstocks. Based on the tradespace, the AtJ pathway and the associated feedstocks are Brazil's most competitive options in terms of unit cost. | ||
Tradespace for SAF feedstock types along a two-dimensional Pareto front (Carbon Intensity and Feedstock production cost). | Tradespace for SAF feedstock types along a two-dimensional Pareto front (Carbon Intensity and Feedstock production cost). | ||
[[File:SAF Tradespace Feedstock2.png]] | [[File:SAF Tradespace Feedstock2.png |900px]] | ||
==Financial Model== | ==Financial Model== | ||
| Line 474: | Line 477: | ||
===Feedstocks: Financial Analysis=== | ===Feedstocks: Financial Analysis=== | ||
[[File:SAF Financial Chart Ethanol.PNG| | [[File:SAF Financial Chart Ethanol.PNG|1000px]] | ||
[[File:SAF Financial Chart IsoBuLow.PNG| | [[File:SAF Financial Chart IsoBuLow.PNG|1000px]] | ||
[[File:SAF Financial Chart IsoBuHigh.PNG| | [[File:SAF Financial Chart IsoBuHigh.PNG|1000px]] | ||
| Line 559: | Line 562: | ||
[[File:SAF RD PtoL OXEFUEL.PNG]] | [[File:SAF RD PtoL OXEFUEL.PNG | 1000px]] | ||
==Key Publications, Presentations and Patents== | ==Key Publications, Presentations and Patents== | ||
| Line 825: | Line 828: | ||
==Technology Strategy Statement== | ==Technology Strategy Statement== | ||
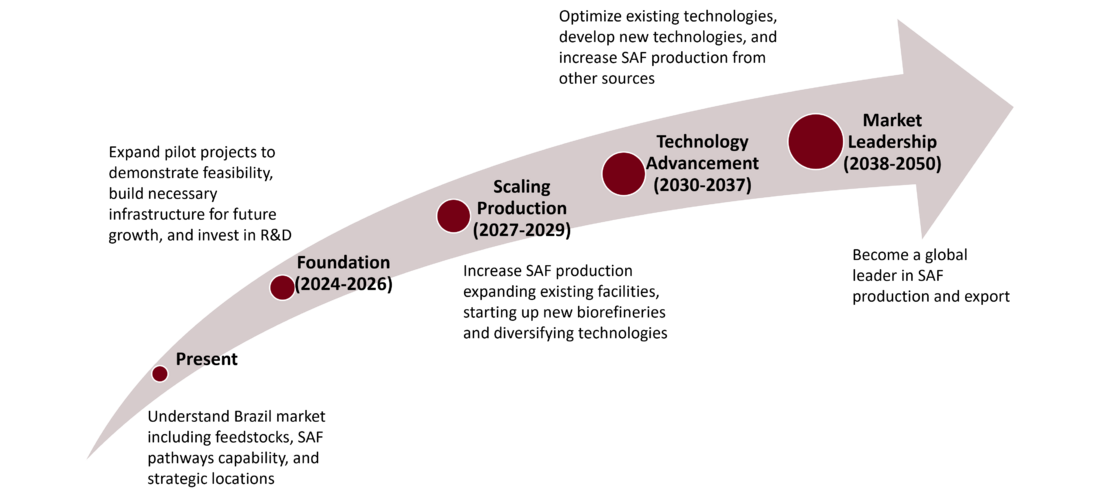
The technology strategy statement of the Brazil Sustainable Aviation Fuel (SAF) production roadmap is to become global leader in SAF by 2050, leveraging its abundant agricultural resources, biofuels expertise, supportive policies and strategic partnerships. The roadmap emphasizes mapping and optimizing feedstock availability, including sugarcane residues, wood residues, and used cooking oil, while expanding research into alternative feedstocks like agave and eucalyptus. Early stages (2024-2026) will focus on scaling first-generation SAF production using HEFA | The technology strategy statement of the Brazil Sustainable Aviation Fuel (SAF) production roadmap is to become global leader in SAF by 2050, leveraging its abundant agricultural resources, biofuels expertise, supportive policies and strategic partnerships. The roadmap emphasizes mapping and optimizing feedstock availability, including sugarcane residues, wood residues, and used cooking oil, while expanding research into alternative feedstocks like agave and eucalyptus. Early stages (2024-2026) will focus on scaling first-generation SAF production using AtJ and HEFA technologies and investing in second-generation ethanol (E2G) from sugarcane bagasse, straw and other agricultural waste. By 2027-2029, Brazil aims to bring new biorefineries online, diversify conversion technologies, and expand existing facilities. The long-term strategy (2030-2037) prioritizes optimizing and scaling up technologies while exploring innovative approaches like CO-rich gas fermentation and PtL. By 2038-2050, Brazil seeks to lead the global SAF market through continuous investment in biorefinery expansion, international collaborations, and cutting-edge technologies, ensuring a sustainable and competitive SAF industry. | ||
[[File:SAF SwooshChart.png| | [[File:SAF SwooshChart.png|1100px|]] | ||
Latest revision as of 04:04, 4 December 2024
Roadmap Creators: Gabriel Ruscalleda, Emilia Ospina Arango and Dawit Dagnaw
Time Stamp: Updated 3 December 2024
Technology Roadmap Sections and Deliverables
Our technology roadmap identifier is shown as:
- 2BSSAF - Brazil Solution - Sustainable Aviation Fuel
This indicates that we are dealing with a “level 2” roadmap at the product level, where “level 1” would indicate a market level roadmap, "level 2" would indicate our SAF Production and “level 3” or “level 4” would indicate an individual technology roadmap.
Roadmap Overview
The aviation industry, currently responsible for approximately 800-850 million tons of CO2 equivalent emissions annually, faces a significant challenge as demand for air transportation services is projected to double in the coming decades.[1] Despite the inherent difficulties of decarbonizing its fossil-fuel-dependent business model, the global airline industry has committed to achieving net-zero emissions by 2050. [1] The primary source of these emissions is the combustion of Conventional Aviation Fuel (CAF), also known as Jet Fuel, which powers aircraft engines. In response to this challenge, Sustainable Aviation Fuels (SAFs) have emerged as a crucial milestone in the sector's decarbonization path. According to the U.S. Department of Energy, low-carbon alternative fuels derived from sustainable feedstocks and production processes could potentially reduce emissions by up to 94% compared to CAF, which has an emission factor of 89 gCO2e/MJ.[6] The potential impact of SAFs is substantial, with estimates suggesting they could contribute up to 65% of industry-wide emission reduction targets, [1] making them a key component in the aviation sector's efforts to achieve sustainability and meet its ambitious climate goals.
Brazil's abundant natural resources position it as a key player in the future global sustainable fuel economy, particularly in Sustainable Aviation Fuel (SAF) production. [3] The country's strengths align with multiple decarbonization levers,[3]. including:
- Nature Based Solutions in reforestation of vast degraded/deforested lands to produce 1st or 3rd generation feedstock
- Sustainable Agriculture for production of 1st and 3rd generation feedstock using Regenerative Agriculture practices
- Renewable Energies to power production with clean energy matrix, offering SAF with higher emission reduction potential
Global SAF production is expected to reach 1.9 billion liters in 2024, three times the production capacity of 2023 estimated at ~600 million liters per year. [8] In a decade, this is forecasted to evolve so that Brazil and US produce equal amounts of SAF (50 B L/year each). [7] While Brazil's domestic SAF demand is estimated at 8 billion liters per year, the US is expected to require 120 billion liters annually, positioning Brazil in a unique position to become a supplier for the global market with its substantial production surplus.[7]
Considering Brazil's agricultural strengths and competitive advantages, [3] the most promising short-term SAF production pathways are HEFA and ATJ, leveraging well-established ethanol infrastructure, while long-term prospects (subject to technological progress) include hydrogen and e-fuels produced with renewable energy. The development of Brazil's SAF ecosystem will largely depend on public policy, with positive signals from Brazil’s government through the approval of "Lei do Combustível do Futuro," which mandates increased use of biofuels and aims for a 10% reduction in airline emissions by 2037. [4]
This roadmap explores the dilemma of SAF scalability in Brazil, focusing on two critical aspects: availability and affordability. The feedstock supply and production capacity are analyzed within the country, and innovative strategies are proposed to enhance scalability. Additionally, economic competitiveness of SAF will be evaluated and compared to conventional jet fuel, considering factors such as production costs, market incentives, and policy support in Brazil.
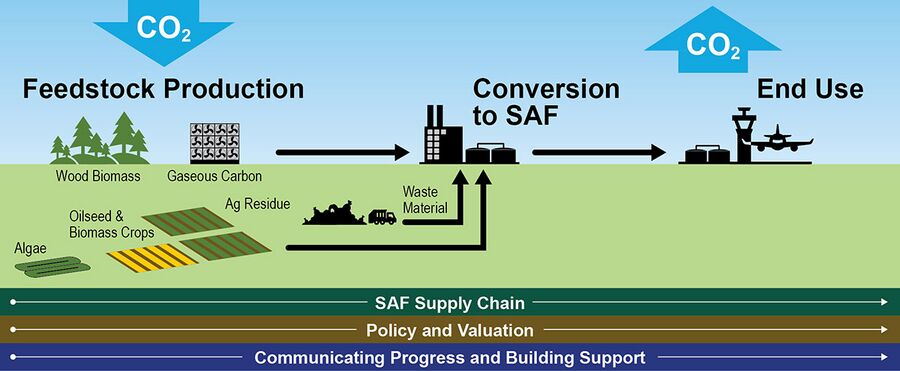
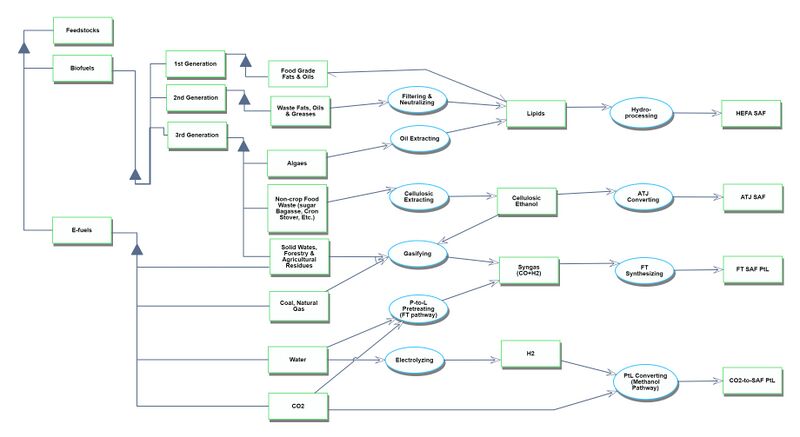
The figure below contains graphic representation of the SAF supply chain from the SAF Grand Challenge Roadmap
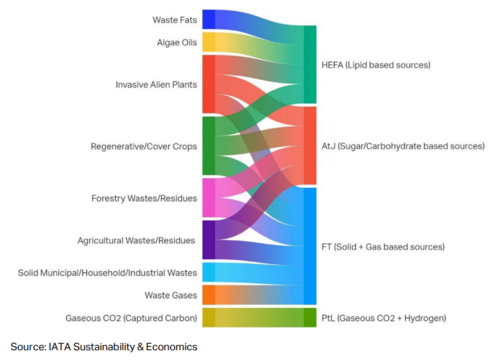
Sustainable Aviation Fuel (SAF) can be produced through various technological pathways using diverse feedstock combinations, resulting in different types of SAF. Currently, more than 11 production pathways and multiple feedstocks are under active research, with new methods and potential materials expected to emerge in the coming years. Several pathways have successfully produced drop-in fuels that meet quality standards and are compatible with existing aircraft, airplane systems, and pipeline infrastructure. Although successful test flights have been conducted using 100% SAF (neat SAF), current usage primarily involves blending SAF with conventional jet fuel in varying proportions, partly due to supply constraints. The aviation industry continues to explore and refine SAF production methods, focusing on expanding viable feedstocks, improving production efficiency, and increasing SAF yield and quality. For a comprehensive understanding of feedstocks and their associated pathways, refer to the illustration provided below.
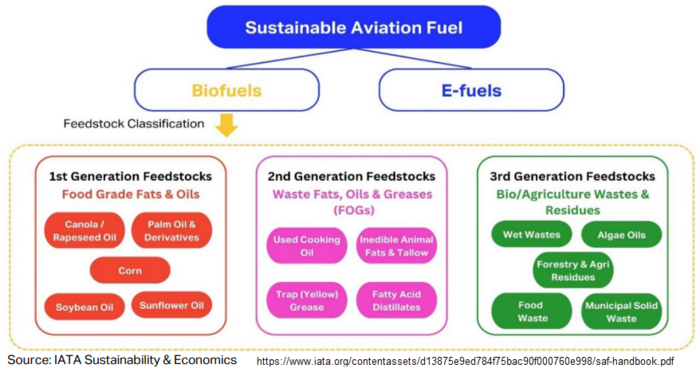
Three generations of feedstocks are defined on the IATA SAF Handbook based on their usage chronology, emission reduction potential, sustainability criteria, environmental impact, and availability:
1. First Generation (1G): Includes food-grade fats and oils like canola, palm, and soybean. While technologically mature and commercially scalable, they pose sustainability issues such as competing with food supply and high land usage.
2. Second Generation (2G): Comprises waste fats, oils, and greases (FOGs) like used cooking oil and inedible animal fats. These are more sustainable than 1G due to higher emission reduction and no additional land usage, but are more expensive due to limited supply.
3. Third Generation (3G): Encompasses biological/agricultural wastes and energy crops from degraded land, including municipal solid waste, forestry residues, and algae oils. They offer the most positive environmental impact and cost benefits but require advanced processing technologies.
Design Structure Matrix (DSM) Allocation
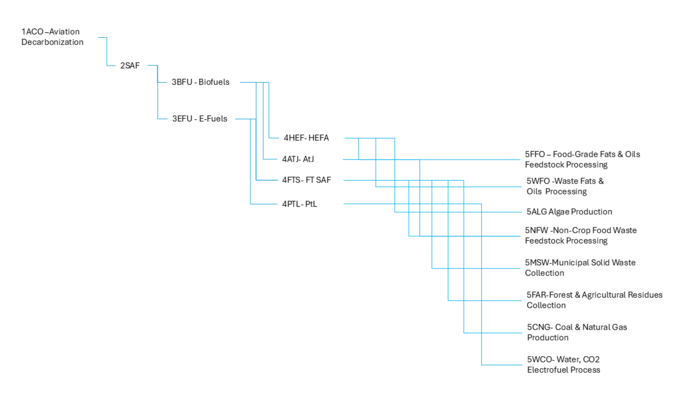
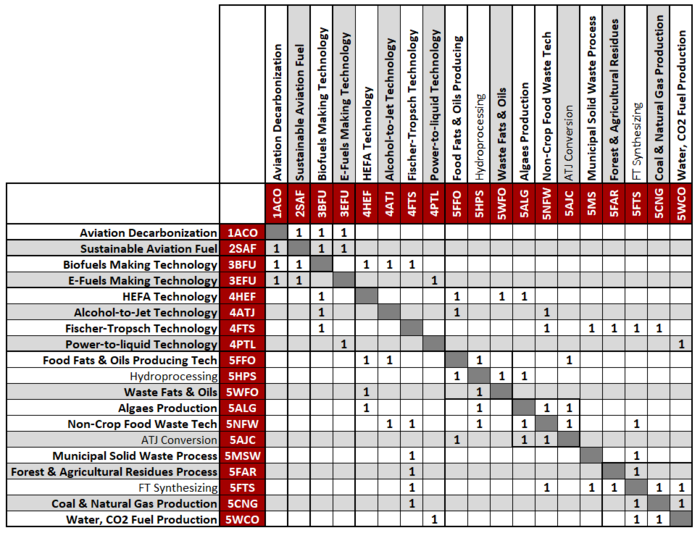
The tree below shows the relationship between other technologies related to the SAF. It is focus on the enabling technologies to SAF, considering key feedstocks and processes. Starting from our main goal to decarbonize aviation (1ACO), 2SAF plays an important role and can be decomposed in multiple technologies. Focusing on feedstock classification, SAF can be made out of two main technologies including Biofuels (3BFU) making technologies and e-fuels (3FU) making technologies such as 4HEF, 4ATJ, 4FTS and 4PTL. These technologies possess a dependency with specific feedstock technologies and processes such as 5FFO, 5HPS, 5WFO, 5ALG, 5NFW, 5AJC, 5MSW, 5FAR, 5CNG and 5WCO.
The DSM below shows the connections of SAF to Level 3, 4 and 5 technologies. These connections will be presented in more detailed in the next section using Object-Process-Model (OPM).
Roadmap Model using OPM
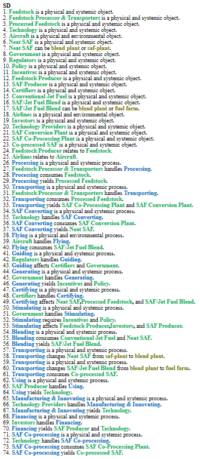
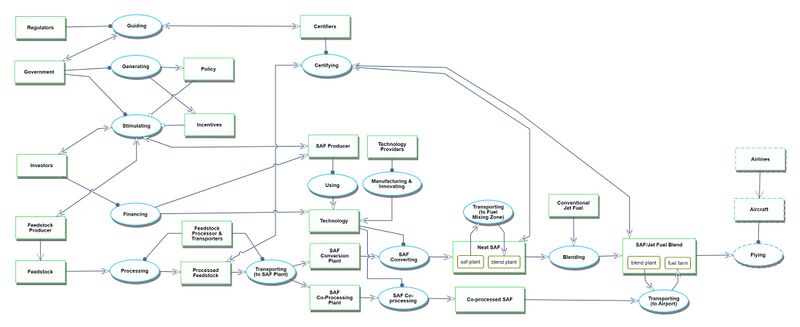
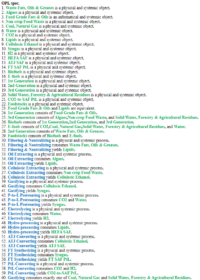
The Object-Process-Model (OPM) of the 2BSSAF - Brazil Solution - Sustainable Aviation Fuel roadmap is presented in the figures with the Object-Process-Language (OPL) below. The OPM was divided in two OPMs: Level 1 and Level 2. Level 1 focuses on the main stakeholders including the Feedstock Producer, Fuel Producers, Government (policy, guidelines, sponsorship), Regulators and Certifiers while Level 2 focuses on the feedstocks and SAF making technologies.
Level 1 OPM: Main Stakeholders
Level 2 OPM: Feedstock and Pathways
Figures of Merit (FOM)
Multiple FOMs illustrate the full extent of SAF as a technology, however the roadmap focuses on two that are essential to delivering its value proposition:
FOM# 1 - SAF cost per comparable unit of energy
Cost is what will eventually determine the adoption and scalability of SAF. Today SAF is 2.8x more expensive than Jet-A and is therefore one of the causes that slows the movement of the industry to SAF based blends. The evolution of cost and its eventual reduction as TRL for the pathways increases, will dictate the pace of transition.
FOM #12 - Carbon intensity
Life cycle carbon emissions are a key metric of SAF quality and therefore of its value add for costumers and producers alike. Generating large volumes of SAF at the expense of its quality, measured as gCO2e/MJ, would render its positive externality and its contribution to sustainability efforts obsolete.
The table below shows a list of FOMs focus on productivity, scalability, accessibility & cost of pathways for evaluation of SAF’s production ecosystem.
| Category | # | Figure of Merit | Units | Description |
|---|---|---|---|---|
| Competitiveness | 1 | SAF cost per comparable unit of energy | [$/L] | Market price of SAF per unit of volume or energy - enables comparison vs reference technology Jet A |
| 2 | Cost per reduced ton | [$ / tCO2e] | Incremental cost per ton of carbon equivalent reduced vs CAF | |
| 3 | Investment potential | [$ / tCO2e] | Financing opportunity per potential unit output of technology | |
| 4 | Installation cost per unit | [$ / L] | Cost of deploying SAF production infrastructure relative to capability | |
| Efficiency | 5 | Energy efficiency | [%] | Energy input to produce SAF vs energy output in SAF |
| 6 | Feedstock crop yield | [Ton / ha] | Crop yield in volume produced per unit area | |
| Productivity | 7 | Feedstock availability | [Ton / year] | Crop availability in volume produced per year |
| 8 | SAF conversion yield | [%] | SAF produced with relation to total refinery biofuel production | |
| Performance | 9 | Energy density | [MJ/L] | Energy content per unit volume of fuel |
| 10 | Blend ratio of pathway/feedstock | [%] | Volume SAF relative to total volume of fuel after blend | |
| Sustainability | 11 | Carbon savings potential | [%] | Potential reduction in emissions for use of SAF vs CAF as baseline |
| 12 | Carbon intensity | [gCO2e / MJ] | Life-cycle carbon equivalent emissions to generate unit of fuel |
Alignment with Company Strategic Drivers
Step 1 - Identification of Key Stakeholders To SAF production ecosystem
| Inside system boundary: | Outside system boundary: |
|---|---|
| 1. Feedstock Supplier | 1. Airports |
| 2. Fuel Producers | 2. Aircraft OEMs |
| 3. Technology Providers | 3. Engine OEMs |
| 4. Airlines | 4. Research Institutions (R&D) |
| 5. Brazil Government (policy, guidelines, sponsorship) | 5. End-consumer (passenger) |
| 6. Regulators | |
| 7. Certifiers | |
| 8. Investors |
Step 2 - Identification of strategic drivers of key stakeholders inside boundary
| Internal Stakeholder | Strategic Drivers |
|---|---|
| Fuel Producer (our “company”) |
|
| Feedstock Suppliers |
|
| Technology Providers |
|
| Airlines |
|
| Regulators |
|
| Certifiers |
|
| Investors |
|
| Brazil Government |
|
| Number | Strategic driver | Alignment & Targets |
|---|---|---|
| 1 |
|
The 2BSSAF technology roadmap will target SAF that has a Carbon Intensity [FOM #12] of at most 50 gCO2e/MJ, guaranteeing a reduction of at least 55% emissions vs Jet-A. |
| 2 |
|
The 2BSSAF technology roadmap will prioritize pathways that maintains the SAF cost per comparable unit of energy [FOM #1] at maximum 2.2x cost of conventional Jet-A. |
| 3 |
|
The 2BSSAF technology roadmap will target feedstock with availability [FOM #7] at least 80% of the year or with alternative ways of storage that guarantees 360-day operation |
Step 3 - Identification of strategic drivers for potential sponsors for our "company"
Why is SAF at the core of Embraer's future? While manufacturing aircraft is what Embraer does best, becoming enablers of the air service industry’s decarbonization journey, as well as Brazil’s own role in it, is a central element of its identity, purpose, and strategy. From a SAF perspective, the priority is increasing SAF production capacity at a competitive price and through sustainable practices, betting on the substantial effect that a sustainable fuel source can have towards building industry resilience and guaranteeing long-term stability of business.
What are Embraer’s main goals in the SAF Production Ecosystem?
- Articulate ecosystem to accelerate the sustainable, scalable & financially viable production of SAFs
- Develop new value-generating business lines. Disrupt their own business before 3rd parties do it first, without adopting a producer role but exploring avenues for investment or development of tangential business opportunities
- Stimulate the economy of their home country
- Contribute to fulfillment of Embraer’s Scope 1, 2, & 3 decarbonization commitments
- Enable customers to fulfill their own Scope 1 & 2 decarbonization commitments
- Attract resources from external (skeptical) investors towards SAF Ecosystem by adopting a proactive role in it
- Develop alliances and strategic partnerships with stakeholders in Ecosystem
- Evolve and inform strategic decisions as to where will Embraer’s “right-to-play” in the SAF Ecosystem
Positioning of Company vs. Competition
Brazil is emerging to become a dominant player in the global Sustainable Aviation Fuel (SAF) market, leveraging its vast agricultural resources, well-established ethanol industry, and strong government support. As the world's second-largest ethanol producer, Brazil offers abundant feedstocks for SAF production, including sugarcane and corn, with lower carbon intensity compared to other sources. The Brazilian government's commitment to SAF development, coupled with established biofuel policies, provides a strong foundation for growth. It is suggested that Brazil could produce up to 50 billion liters of SAF annually by 2030, rivaling US production potential. This trend can be seen in the Table and Bar Chart below when comparing current production and future projections for top SAF Producers against Brazil producers. While facing competition from the United States and European countries, Brazil's lower production costs and abundant feedstock supply could give it an advantage. Local producers like Raízen, BP Bunge, and Petrobras are driving the industry's future, focusing on both domestic production and export markets. Major international players such as Shell and BP are also investing in Brazilian SAF production, indicating strong market confidence.
| Producer | Production | Product | Partnership | Innovation |
|---|---|---|---|---|
| Acelen (BR) | 1 BL | SAF & Renewable Diesel | Government of Bahia, Honeywell, Embrapa | Honeywell's Ecofining technology, utilizing the macaúba palm |
| Petrobras (BR) | 1.2 BL | SAF and Renewable Diesel | MOU with Mubadala Capital for biorefinery projects | Honeywell UOP’s HEFA technology |
| Raizen (BR) | 3.3 BL | Ethanol for SAF production | Embraer | First global certification for SAF production from ethanol |
| BBF (BR) | 0.63 BL | SAF | Vibra Energia | HydroFlex & H2Bridge for HVO |
| Neste (FIN) | 1.5 BL* | SAF | Partnerships with United Airlines and Air New Zealand | Development of NEXBTL™ technology for SAF production |
| Aemetis (US) | 0.340 BL* | SAF, Renewable Diesel | American Airlines, Delta Air Lines, Cathay Pacific, 10 airlines total | Utilizes Alcohol-to-Jet (ATJ) to produce SAF and has developed specific processes for converting ethanol into olefins |
| Gevo (US) | 0.227 BL* | SAF | American Airlines, Delta Airlines, Trafigura, Kolmar, British Airways, Alaska Airlines, etc. | Utilizes Alcohol-to-Jet (ATJ) to produce SAF and has developed specific processes for converting ethanol into olefins |
| Shell PLC (UK) | 2.5 BL* | SAF, Renewable Diesel | Lufthansa, JetBlue, Emirates, SkyNRG | Investing in HEFA technology for SAF production and enhancing supply chain capabilities |
| LanzaJet (US) | 0.038 BL* | SAF | Breakthrough Energy | Ethanol-based alcohol-to-jet technology |
| SkyNRG (NL) | ~1 BL* | SAF | Boeing, KLM Royal Dutch Airlines | Investing in HEFA technology for SAF production and enhancing supply chain capabilities |
| World Energy (US) | 0.318 BL* | SAF | Air Products, Honeywell UOP | HEFA technology, extensive capacity expansion including a $2 billion project |
| Total Energies (FR) | 1.9 BL* | SAF | Partnership with Sinopec for SAF production in China; Air France-KLM for supply of 1.5 million tons of SAF annually by 2030. | Investing in the Grandpuits site conversion into a zero-crude platform primarily for SAF from circular feedstock. |
| ENEOS (JAP) | 0.4 BL* | SAF | TotalEnergies, Japan Airlines | Integrated SAF supply chain, in-house manufacturing. |
Technical Model
The morphological matrix for our SAF roadmap. As in the OPM, the connection of each design to the pathways is shown in the table. Out of the different pathways, the HEFA pathway is suitable for co-processing, providing advantages with scalability. The morphological matrix further highlights different feedstocks in each pathway. Feedstocks in the AtJ pathway are the most cost-competitive for Brazil according to the unit cost (figures of merit) highlighted.
Morphological Matrix for SAF Feedstocks
| Pathway | SAF Production Pathway | Decision Variable | Feedstock | Feedstock Generation | Production Scalability | Carbon Intensity (g CO₂/MJ) | Production Cost ($/L) | Yield Percentage (%) |
|---|---|---|---|---|---|---|---|---|
| HEFA | Hydro-processed Esters and Fatty Acids (HEFA) | 1 | Brassica carinata | 1st | Medium | ~25-40 | 0.80 - 1.20 | ~95% |
| 2 | Palm oil – open pond | 1st | High | ~25-40 | 0.85 - 1.10 | ~70% | ||
| 3 | Palm oil – closed pond | 1st | High | ~45 | 0.85 - 1.10 | ~80% | ||
| 4 | Camelina | 1st | Low | ~50 | 1.20 - 1.60 | ~70% | ||
| 5 | Rapeseed oil | 1st | Medium | ~30-50 | 0.80 - 1.20 | ~70% | ||
| 6 | Soybean oil | 1st | Medium | ~30-50 | 0.80 - 1.20 | ~85% | ||
| 7 | Corn oil | 1st | Medium | ~20-30 | 1.30 - 1.80 | ~85% | ||
| 8 | Palm fatty acid distillate (PFAD) | 1st | Low | ~15-25 | 0.90 - 1.40 | ~85% | ||
| 9 | Used cooking oil | 1st | Low | ~15-25 | 0.90 - 1.40 | ~95% | ||
| 10 | Tallow | 1st | Low | ~15-25 | 0.90 - 1.40 | ~95% | ||
| ATJ | Alcohol-to-Jet (ATJ) Ethanol | 11 | Switchgrass – integrated | 2nd | Medium | ~20-40 | 1.20 - 1.50 | ~70% |
| 12 | Miscanthus – integrated | 2nd | Medium | ~20-40 | 1.20 - 1.50 | ~70% | ||
| 13 | Forest residues – integrated | 2nd | Low | ~20-30 | 1.40 - 1.80 | ~70% | ||
| 14 | Agricultural residues – integrated | 2nd | Low | ~20-30 | 1.40 - 1.80 | ~70% | ||
| Alcohol-to-Jet (ATJ) Iso-butanol | 15 | Corn grain | 1st | Medium | ~45 | 0.80 - 1.20 | ~45% | |
| 16 | Sugarcane | 2nd | High | ~20-30 | 0.80 - 1.20 | ~60% | ||
| 17 | Molasses | 2nd | High | ~25-40 | 0.90 - 1.30 | ~65% | ||
| FT | Fischer-Tropsch (FT) | 23 | Herbaceous energy crops | 2nd | Medium | ~15-30 | 0.90 - 1.40 | ~85% |
| 24 | Short-rotation woody crops | 2nd | Medium | ~15-30 | 0.90 - 1.40 | ~85% | ||
| 25 | MSW, O% Non-biogenic carbon | 3rd | High | ~15-25 | 0.90 - 1.40 | Varies | ||
| 26 | Forestry residues | 2nd | Medium | 15–35 | $0 .90–$140 | Varies |
Governing Equations & Data
SAF feedstock inputs for each category of the four key pathways is included in the table above. The equations governing the feedstock production costs are based on conversion efficiency and input cost of feedstock. The higher conversion efficiency for Power-to-Liquid will potentially make it economical as it has the lowest carbon intensity of all the four pathways. Unit costs of hydrogen and carbon sources coupled with low renewable electricity costs are key for scalability.
To determine emissions reduction from using SAF, we can compare its carbon intensity to that of conventional jet fuel, which is typically around 89 gCO2e/MJ.
Sensitivity analysis: Tornado Chart
The normalized tornado charts below show the sensitivity between feedstock production cost and carbon intensity. Considering the cost of feedstock, the 'company' will prioritize ATJ pathway for SAF production. As feedstock production costs improve, we will start producing from sources with less carbon intensity ideally PtL.
Tradespace for SAF Feedstock Types
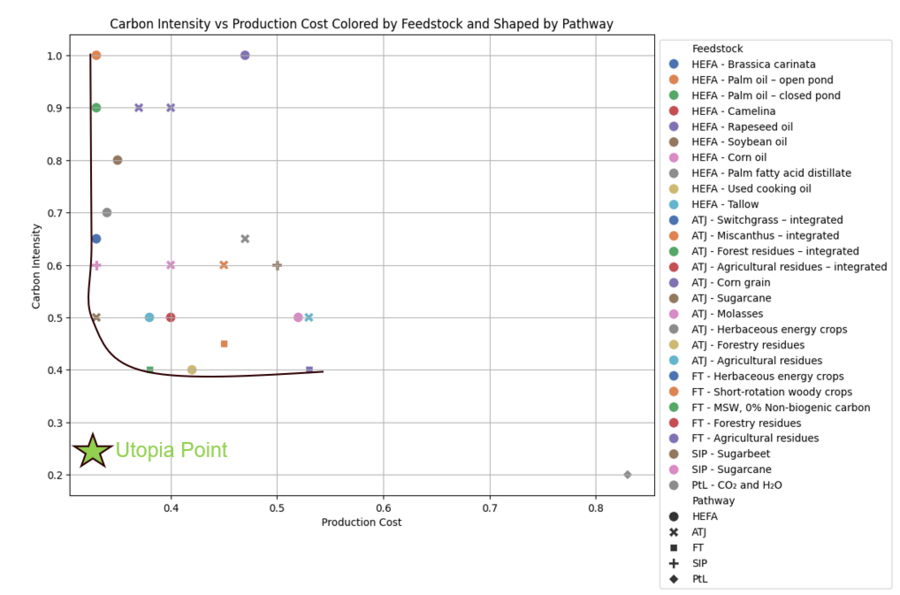
Feedstock carbon intensity and production costs are two key figures of merit (FOM) analyzed comparing different SAF pathways and feedstocks. While PtL has the highest production cost, it has the lowest carbon intensity. It has great potential to move to Utopia Point with more technological advancements and cost-efficiency improvements. HEFA continues to lower cost, making it scalable, but it has a relatively higher carbon intensity than the other feedstocks. Based on the tradespace, the AtJ pathway and the associated feedstocks are Brazil's most competitive options in terms of unit cost.
Tradespace for SAF feedstock types along a two-dimensional Pareto front (Carbon Intensity and Feedstock production cost).
Financial Model
Considering the literature review, and the extent of Brazil’s Ethanol based bio-fuels infrastructure, the "Company" has decided to develop a pioneer facility for SAF using the ATJ pathway. The financial modelling centers on an initial lower-scale plant that could eventually be scaled subject to proven viability and future demand, as well as when a sufficient level of expertise and baseline capabilities have been developed.
Considering its strategic drivers, the “Company” is not interested in developing feedstock processing facilities at an initial stage but rather leveraging preprocessed feedstock in the form of sugarcane Ethanol or Isobutanol, leveraging broad number of suppliers and existing economies of scale for the input. Three potential feedstocks, with varying assumptions and input values, are modelled separately to be able to compare economics and address initial question of exploring best pathway and feedstock in Brazil’s specific context.
The "pioneer” plant input values and assumptions have been determined in line with ICAO’s benchmark and thumb rules. For this initial plant, lifetime is assumed to be 20 years, with a 3 years construction and 3-year ramp-up in increments of 25% at a time. Depreciation is modeled as linear and through out 10 years. All funding is assumed to come from investors, no debt is acquired and therefore no outstanding interests are paid. Given the relevance of investing in R&D in the early stages of the business to be able to move up on the TRL scale and eventually scale production to larger volumes or other pathways, R&D spending is determined to be 5% of resulting CashFlow, subject to it being positive. Capitalization beyond the Total Capital Investment is required to fund operating expenses in the initial ramp-up period. Once commercialization of SAF and by-products begin, the capitalization requirements are lessened through the revenue incomes. A discount rate of 10% is determined as the minimum opportunity cost required for the investors considering alternative investment opportunities.
Table: Project Financial Assumptions
| Project Financial Assumptions | ||
|---|---|---|
| Parameter | Unit | Value |
| General | ||
| Project Lifespan | Years | 20 |
| Construction time | Years | 3 |
| Depreciation | Years | 10 |
| Depreciation method | Linear | |
| Ramp-up timeline | Years | 3 |
| Ramp-up values | % | 25% |
| [Target] Discount Rate | % | 10% |
| Taxes | % | 21% |
| Debt | USD | $0.00 |
| R&D Reinvestment | % | 5% |
| Conversion Rates | ||
| Ton to L conversion JetA | L/tonne | 1250 |
| Gallon to L Conversion | L/Ga | 3.78 |
| Green Diesel | $/Gallon | 5.37 |
| Green Diesel | $/L | 1.42 |
| Green Naphta | $/tonne | 1800 |
| Green Naphta | $/L | 1.44 |
| Relation of Wk to TCI | % | 15% |
| Production | ||
| Distillate Capacity | Million L/year | 100 |
| SAF Capacity | Million L/year | 70 |
| SAF in Distillate | % | 70% |
| Green Diesel in Distillate | % | 20% |
| Green Naphta in Distillate | % | 10% |
Table: ATJ Feedstock Alternatives
| ATJ Feedstock Alternatives | ||||
|---|---|---|---|---|
| Parameter | Units | Ethanol / Agr. Residues | Isobutanol low | Isobutanol high |
| Yield | ton distillate/ton feedstock | 0.6 | 0.75 | 0.75 |
| Pre processed Price | $/L | 0.41 | 0.89 | 1.2 |
| Capital Cost | $/L Distillate | 1.7 | 0.9 | 1.1 |
| Total Capital Investment | USD M | 170 | 94 | 110 |
| Min. Selling Price (MSP) | $/L | 2.5 | 1.5 | 1.9 |
| LCA Emissions | gCO2e/MJ | 32.15 | 33.1 | 33.1 |
| Abatement Cost | $/tCO2e | 1050 | 500 | 730 |
Feedstocks: Financial Analysis
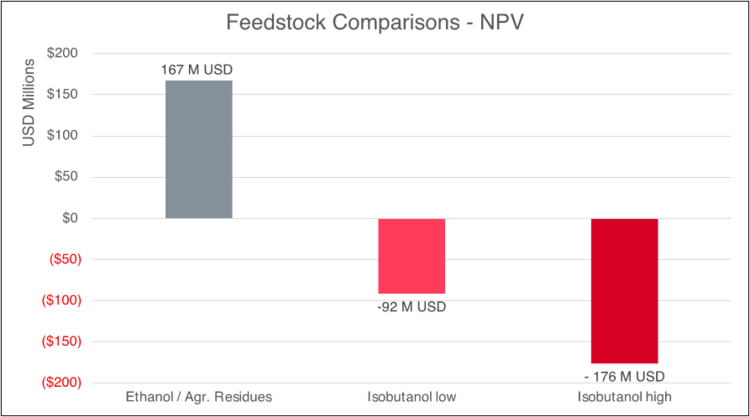
When comparing the NPV for all feedstocks in question, as well as its Free Cash Flow and Discounted Cash Flow evolution, it is possible to see that at the scale of the current pioneer plant and with the macroeconomics context of its development, Ethanol (Sugar Cane) / agricultural Residues, emerge as the most financially viable alternatives.
Even if the capital investment required is higher for this feedstock vs Isobutanol alternatives, its overall lower cost, along with substantially higher Minimum Selling Price results in more favorable economic outcomes. The NPV associated to an ethanol-based pioneer plant is +167 M USD considering the 20-year lifespan, while it is -92 M USD or -176 M USD for Isobutanol low and high respectively.
Further exploration of financial viability would require recalibrating model with specific information for candidate providers in Brazil and expanding model into increased volumetric production scenarios.
List of R&D Projects
To enable the success of SAF production and adoption, five R&D projects on SAF pathway have been selected for the roadmap to improve SAF conversion efficiency to optimize cost. These R&D projects have been prioritized based on their impact on lowering carbon emissions and production costs to scale and replace conventional aviation fuel. PtL one-step conversion is the most prominent early-stage technology with vast potential to lower production cost (discussed in the figure below). In addition, R&D of flight demonstration with SAF is essential for continued success in SAF adoption. The table below summarizes the list of R&D projects essential for SAF to be successful.
| R&D Project | R&D Project Description | TRL | Carbon Intensity (gCO2e/MJ) | Production Cost ($/L) | Rank |
|---|---|---|---|---|---|
| PtL One-Step Conversion | Development of a one-step catalytic process to directly convert CO2 and green H2 into a sustainable aviation fuel using a noble multi-functional iron catalyst. | 4-5 (Pilot) | 0 | N/A
50% less capital |
1 |
| PtL Conversion Process Improvement | Pilot-scale production of ASTM-compliant e-SAF using CO2 and green hydrogen, advancing hydrocracking and isomerization. | 6-7 | 0 | 1.5 – 2.5 | 2 |
| HEFA Conversion Process Improvement | Focuses on optimizing the HEFA pathway by lowering quality feedstocks and enhancing catalyst performance to enhance SAF yield and process sustainability. | 8-9 | 15-35 | 0.8 – 1.2 | 3 |
| AtJ Conversion Improvement | Optimization of Alcohol-to-Jet pathways by developing more efficient catalysts and processes for converting ethanol and other alcohols into jet fuel, aiming to reduce costs and improve scalability. | 7-9 | 25-40 | 1.2 – 2.0 | 4 |
| FT Conversion Improvement | Increasing selectivity for jet fuel range hydrocarbons and integrating biomass gasification processes to enhance efficiency. | 6-8 | 30-40 | 1.8 – 2.5 | 5 |
| Flight Demonstration | Demonstrating SAF feasibility through flight trials with various PtL, FT, HEFA, and AtJ SAF blends. | 7-8 | N/A | N/A | N/A |
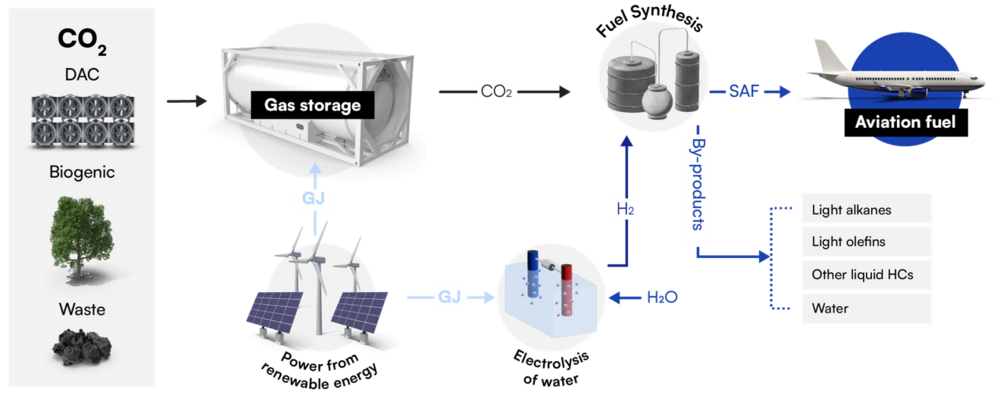
Among the R&D projects, OXEFUEL™ by OXCCU has been selected to show its prototype. The technology “developed a novel, robust iron-based catalyst and process to directly convert CO₂ and green H₂ from water into fuels and chemicals in one step.” This is an advanced and promising SAF technology with “high conversion efficiency and selectivity, creating a cost-effective and scalable solution for producing aviation fuel.”
High Selectivity Productivity gains from novel iron-based catalyst enabling higher carbon efficiencies and selectivity.
Low CAPEX Up to 50% less CAPEX due to simplified and modular flowsheet
Key Publications, Presentations and Patents
Article 1. Cost and emissions pathways towards net-zero climate impacts in aviation
Authors: Dray, Lynnette, Andreas W. Schäfer, Carla Grobler, Christoph Falter, Florian Allroggen, Marc E. J. Stettler, and Steven R. H. Barrett
Source: Nature Climate Change 12, no. 10 (October 2022): 956–62. https://doi.org/10.1038/s41558-022-01485-4
Highlights:
Aviation emissions are not on track to meet Paris Climate Agreement goals, but fuel pathways such as synthetic fuels from biomass, green hydrogen and atmospheric CO2, and direct use of green liquid hydrogen could reduce lifecycle aviation CO2 emissions by 89-94% compared to 2019 levels, despite a 2-3x growth in demand by 2050.
These pathways would require investments of $0.5-2.1 trillion over 30 years, leading to ticket price increases of no more than 15% and demand suppression of less than 14%. However, they only reduce aviation's overall CO2-equivalent emissions by 46-69%, so more action is still needed to mitigate non-CO2 climate impacts.
Analysis:
Difficulty of decarbonizing aviation lies in “high growth rates, long-lived assets, non CO2 impacts of similar magnitude to CO2, and no commercially available scalable carbon neutral technology”. The overarching equation that describes the aviation's contribution to CO2 emissions is described as follows:
Where RTK:
Represents demand in the form of Revenue per Tonne-Km. RTK is forecasted to grow 2x or 3x by 2050 however increase in costs from tangential decarbonization measures will have demand feedbacks captured by this term. No explicit demand restrictions or prohibitions are contemplated.
Energy/RTK:
Represents energy intensity of air transportation system, considering operational efficiency, utilization of existing capacity and aircraft fuel efficiency. It is therefore addressed through new aircraft architectures or operational optimization measures. It is unlikely to be a major driver of reductions considering heavy dependence on natural attrition cycles of existing aircrafts, which have a life cycle of 20-30 years and a long lead time between purchase and delivery.
CO2e/Energy:
Represents climate intensity of fuels and is therefore addressed through the incorporation of alternative fuels with lower fuel GHG emissions, in the form of biofuels or e-fuels.
Offsets:
Represents purchase of reductions in other sectors, or carbon sequestration alternatives when reduction of own footprint is not accomplished.
Considering limitations of impact driven by both RTK and Energy/RTK, as well as potential doubts regarding reduction effectiveness and verification of offset schemes, the article centers on CO2e/Energy as the main lever the industry has left to action on:
• Drop-in fuels, in the form of biofuels or e-fuels, produced from sequestered carbon atoms through pathways at different degrees of technological readiness. Most viable in the short term but subject to biomass supply constrains
• Non-drop in fuels in the form of cryogenic, hydrogen or electricity, despite substantial investments required in aviation and aircraft infrastructure that limit scale-up before 2030. Others like ammonia or liquid natural gas are excluded from publication considering toxicity or low energy availability.
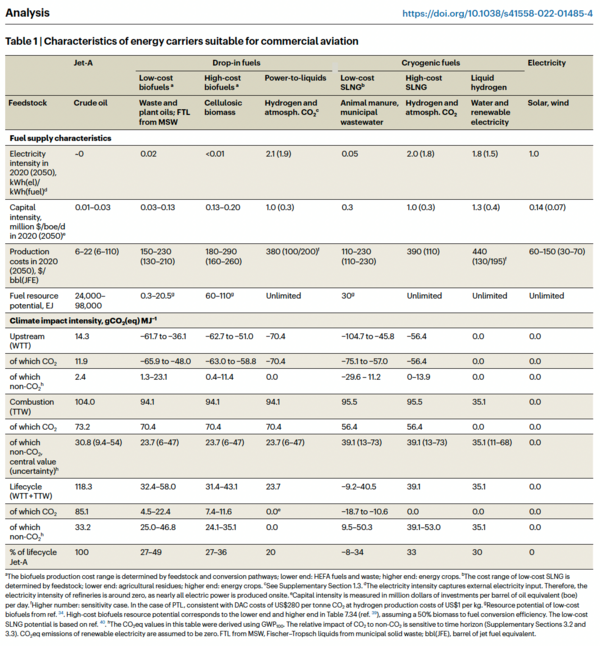
Main characteristics of possible energy carriers are detailed in Table 1.
Conclusions:
Synthetic low carbon fuels are a key element to achieve net zero emissions in aviation, and though fuel efficiency can contribute with 25% of overall emissions, it is imperative to adopt alternative fuel sources such as biofuels, power-to-liquid or liquid hydrogen for further reductions.
Though biofuels will most likely play an important role in the near term, the scarcity of biomass for their production limits their long term effect. To enable a more stable transition, it is essential to leverage renewable electricity for production of power-to-liquid and liquid hydrogen.
Impacts beyond fuel will contribute to abatement but require substantial investments in research and technology to overcome technical and operational challenges. And all of this will come at a cost that will need to be counterbalanced through cost-saving measures in efficiency that help keep airfare increases for the final consumer between 10% - 15%.
Article 2. Techno-Economic and Environmental Assessment of Renewable Jet Fuel Production in Integrated Brazilian Sugarcane Biorefineries
Authors: Bruno Colling Klein, Mateus Ferreira Chagas, Tassia Lopes Junqueira, Mylene Cristina Alves Ferreira Rezende, Terezinha de Fátima Cardoso, Otavio Cavalett, Antonio Bonomi
Source: *Applied Energy*, 209, 290–305 (January 1, 2018). https://doi.org/10.1016/j.apenergy.2017.10.079
Highlights:
- Study sponsored by Embraer, The Boeing Company, and CTBE compares routes for SAF production in integrated sugarcane biorefineries in Brazil, from an economic and environmental performance.
- All biorefineries are assumed to be self-sufficient with no reliance on external energy sources and benchmarked against a base case that comprises an ethanol distillery operating during the sugarcane season.
- 8 scenarios with sugarcane mills are annexed to 3 ASTM-approved SAF technologies evaluated for a series of eligible feedstock in the Brazilian context:
* HEFA
   * Palm Oil
   * Macauba Oil
   * Soybean Oil
 * FT Gasification
   * Sugarcane straw and bagasse
   * Eucalyptus lignocellulosic material
 * ATJ
   * Ethanol 1G
   * Ethanol 2G
   * Isobutanol
- Main conclusions:
o HEFA based biorefineries yielded highest production capacity of SAF (267 M L/y)
o FT produced SAF at the most competitive cost however with low levels of output and heavily dependent of feedstock and process configuration
o All routes enable an overall positive climate change impact of ~70% when compared to conventional Jet Fuel
Detailed overview:
The study considers a "self-sufficient" biorefinery that operates out of a variety of biomass feedstock and does not require external supply of electricity, natural gas or others for operations. Energetic requirements of plant are met by burning bagasse and straw (occasionally) in Cogeneration of Heat and Power units to produce steam and electricity, where excess electricity is sold to the grid
Sugarcane production in Brazil follows one of three plant configurations:
- Autonomous Ethanol Distillery: Y: 100% Ethanol
- Sugar factory: 100% Sugar
- Sugar factory with annexed ethanol distillery: Both Ethanol and Sugar
Study focuses on Autonomous Ethanol Distillery as host plants for production of SAF.
- Main output: hydrous ethanol (93% w/w)
- Differentiating factor: Use of 50% of recovered straw through second-pass straw harvesting process increases power output vs mills that dont
Conventional way of addressing and studying SAF's impact and feasibility often center in standalone production plants. The article explores the potential for risk-mitigation and reduction of the MJSP as a result of establishing an integrated biorefinery configuration. Though some previous studies have evaluated similar hypothesis for ATJ, the research extends the hypothesis to also cover FT and HEFA pathways in the Brazilian context.
HEFA Route:
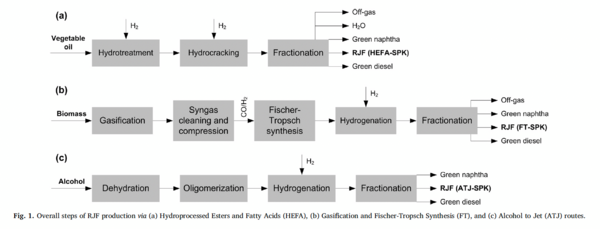
- Explored 3 types of vegetable oils through the process illustrated in Fig 1.a. to evaluate their hydrocarbon production potential. This is mainly determined by the degree of unsaturation of fatty acids which has a direct effect on the amount of hydrogen needed for the conversion into liquid hydrocarbon.
- Consumption was found to be most efficient for Palm Oil (31.7 kg H2/ton Oil) followed by Macauba Oil (33.3 kg H2/ton Oil) and finally Soybean Oil (37.7 kg H2/ton Oil)
- Plant capacity is determined by surplus electricity as limiting factor for H2 production, as supplied from annexed sugar cane mill
FT Route:
- Explores lignocellulosic material from two sources: sugarcane and Eucalyptus. Both biomass have a similar chemical composition and are of significant importance in Brazil's energy sources
- Output of FT process is heavily reliant on scale of plant, process configuration and feedstock type/composition
- Given the sensibility of the process to the initial state of the biomass, development of efficient pretreatment options is a key factor in allowing for a financially viable scaling
- Process has a series of byproducts including large volumes of Green Naphtha and energy, in the form of steam from high-temperature process in the thermochemical plant that can act as energy sources for annexed sugarcane mill
- Plant capacity is determined by amount of biomass produced, considering seasonality and availability of feedstock
ATJ:
- Explores 1G and 2G Ethanol with the hope of leveraging existing ethanol-producing infrastructure in Brazil as well as Isobutanol as a result of fermentation of sugarcane juice
- Process has a series of byproducts including Green Naptha and Green Diesel
- Plant capacity is determined by alcohol availability as produced by sugarcane mill, reserving a proportion of it to continue operating the plant in off-season
Both HEFA and ATJ routes require hydrogen as an input for SAF production. Considering the self-sufficiency aspect of the biorefinery in question, multiple methods for its in-situ synthesis are mentioned, ultimately postulating Water Electrolysis as the most adequate in the context of Brazilian sugarcane mills. Other methods such as methanol/ethanol steam reforming exhibited short comings such as excessive reliance on fossil fuels, low cost-efficiency or required proximity to the natural gas grid. The authors highlight further the attractiveness of the Water Electrolysis process when considering the generation of ethanol as byproduct and its importance for the Brazilian biofuel economy.
Technoeconomic assessment:
- Production costs of the different biomasses are contemplated, leveraging information from comprehensive databases of agricultural production
- Minimum selling prices of oil are determined considering all the revenues of coproducts from processing and extraction of grains/seeds/fruits into oil under a predetermined IRR for the plant, as well as including capital and transportation costs.
- Similarly, green Diesel produced as byproduct is assumed to be recirculated to meet demands from agricultural production process, estimated at 4L diesel/ton of sugarcane, helping lower overall biomass production costs and lowering associated environmental impacts.
- HEFA and FT biorefineries replace 100% of the fossil fuels required as input with green diesel byproduct, ATJ still requires external fuel to some extent
- Liquid hydrocarbon output increases when biorefinery operates with multiple types of biomass and larger volumes, rather than off a single one
- Land use and direct occupation of agricultural land are also evaluated, concluding that ATJ requires the least extension, followed by Macauba and Palm HEFA routes which produce higher volumes of SAF with less area than their Soybean counterpart.
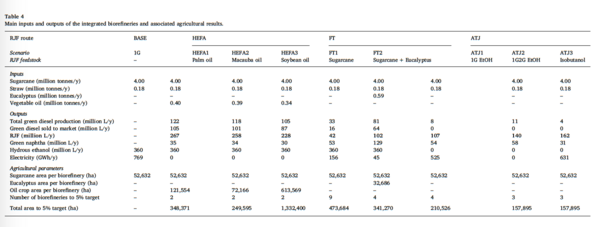
The main inputs and outputs of the technoeconomic assessment for the 8 pathways are described below in Table 4. The series on underlying assumptions are discussed in detail in the article:
Environmental assessment:
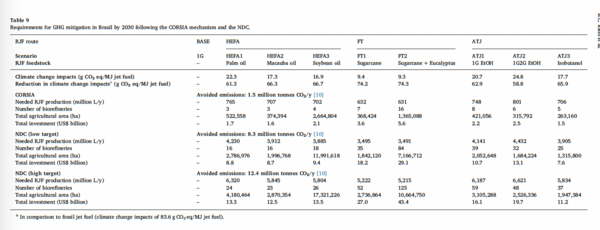
- All SAFs routes explored offer a reduction to global environmental impact of across 70% when compared to alternative conventional jet fuels. Specific reduction is heavily dependent on specific production path, as presented in Table 9 below.
- However, at a local scale they have adverse impacts, particularly related to toxicity, acidification of land and land occupation inherently related with agricultural production chain of feedstock.
- Between the 8 scenarios analyzed, FT routes exhibit best environmental performance, followed by ATJ's performance which is heavily impacted by low conversion yields and fewer coproducts to share the environmental impact. Lastly, HEFA exhibits the least favorable scenario due to the large volume of input required and the heavy use of fertilizers associated to them.
Patent 1 . US 12060531 B1
Name: Production of Fuels from Hydroprocessed Esters and Fatty Acids, Low Carbon Hydrogen and Carbon Dioxide in an integrated HEFA and E-Fuels plant
Applicant: Infinium Technology, LLC, Sacramento, CA (US)
Inventors: Robert Schuetzle, Sacramento, CA (US); Harold Wright, Menomonee Falls, WI (US); Benjam
Date: 2024-08-13
Need addressed:
Environmental impact of fossil fuels in transportation sectors, particularly aviation and heavy transport considering difficulties in electrification.
Invention:
Process for producing synthetic jet fuel and/or diesel fuel through integration of production facilities for HEFA, low-carbon hydrogen and electric fuels (E Fuels).
Background:
- Combustion of fossil fuel in engines of transportation vehicles produces carbon dioxide, and other gases that have been linked to adverse climate change effects. This has led to increasing pressure for decarbonization of the sector, either through renewable energy or electrification of vehicles. However, electrification has limitations either in terms of cost or feasibility, making efficient and economical production of diesel and sustainable aviation fuel essential to attain meaningful reductions in transportation sector emissions.
- Renewable fuels of non-biological origin (RFNBO's) such as electricity, hydrogen and CO2 have gained traction considering their sourcing does not lead to depletion of resources or compete with production for food resources, as do Biofuels.
- Three different pathways for synthesis of renewable diesel or aviation fuel are discussed, with multiple processes for each:
HEFA: conversion of Hydro-processed Esters and Fatty Acids in vegetable oils and fats
- Production of fuel through one of three routes with different sub-products:
 * Decarboxylation (DCOX): Fats are converted into hydrocarbons and CO₂
 * Decarbonylation (DCON): Hydrogen is added and fats are converted into hydrocarbons, water, and CO
 * Hydrodeoxygenation (HDO): Hydrogen is added and fats are converted into hydrocarbons and water
- These processes produce light gases alongside the primary fuel products
Fischer-Tropsch (F-T) consists on the catalytic hydrogenation of carbon monoxide
- Production of heavy waxes, which are then hydrocracked into usable fuels (diesel, naphtha, etc.)
- Usually requires catalysts based on cobalt or iron
Direct Liquid Fuel Production (Direct LFP):
- Production of liquid fuels without first making wax therefore eliminating the need for hydrocracking (process that requires substantial capital)
- Current invention offers an improvement versus previous Direct LFP processes and solves issues associated to blending straight-run F-T kerosene into SPK
E-Fuels
- Production of synthetic fuels from waste CO2 and low-carbon hydrogen, preventing their eventual release into the atmosphere
- Traditionally powered by renewable energy sources for hydrogen electrolysis
Invention overview:
- Integrated facility for production of renewable diesel, SAF or a combination of the two using waste CO2 and light-gas byproducts of parallel HEFA production processes
- Process integrates by-products from HEFA (like light gases) into the eFuels process, enhancing efficiency and lowering the carbon intensity of the final fuels
- Multiple embodiments are described in which C1-C4 gases are recirculated or re-introduced with the purpose of producing specific inputs or additional hydrocarbon products in downstream processes, enhancing overall environmental and economic attractiveness of invention
- Invention also focuses on ensuring that the produced fuels meet aviation standards and maintain high yields of desirable hydrocarbon fractions, ultimately contributing to a more sustainable energy landscape.
Patent 2. US 20230242822 AI
Name: Production of Sustainable Aviation Fuel From CO2 and Low-Carbon Hydrogen
Applicant: INFINIUM TECHNOLOGY, LLC, Sacramento, CA (US)
Inventor: Dennis SCHUETZLE, Grass Valley, CA (US); Robert SCHUETZLE, Sacramento, CA (US); James BUCHER, Boston, MA (US); Matthew CALDWELL, West Sacramento, CA (US); Anja Rumplecker GALLOWAY, San Rafael, CA (US); Orion HANBURY, Sacramento, CA (US); Glenn MCGINNIS, Sun Lakes, AZ (US)
Date: Aug. 3 2023
Need addressed Increasing CO2 levels in the atmosphere, resultant from burning fossil fuels, are closely linked with climate change. The aviation industry is responsible for ~2% of global emissions given its heavy reliance on petroleum for generation of jet fuel. Sustainable Aviation Fuel addresses the environmental concerns; however, its cost relative to conventional fuel substantially limits its widespread adoption.
Invention "The field of the invention is a process to produce synthetic jet fuel, jet fuel components, or synthetic paraffinic kerosene from low carbon hydrogen and captured CO2."
Background
- Petroleum-derived Jet Fuel is governed through strict quality standards (i.e., ASTM D1655). Aircrafts and engines have been optimized for the past few decades to have an ever better fuel efficiency.
- Since the introduction of alternative fuels, non-petroleum based, the ASTM introduced a new standard ASTM D7566-21 with which biofuels or e-fuels must comply, regardless of the pathway through which they are synthesized.
- Fischer Tropsch synthesis is one of the routes for production of SPK (Synthesized Paraffin Kerosene) in compliance with ASTM D7566. FT processes often result in heavier waxes (C24 and above), which must be further processed through hydrocracking or hydroisomerization to create suitable jet fuel.
- Though multiple FT routes exist, they have limitations to which the present invention poses solutions.
Invention overview
- New approach to SAF production addresses challenges with blending F-T kerosene by using hydroisomerization. This process alters the structure of n-alkanes into isoparaffins, improving the blend's quality for use in aviation fuel. Additionally, another method involves oligomerizing C5-C9 hydrocarbons from the F-T process to create kerosene that can be used as jet fuel, offering a more efficient route to producing high-quality SPK.
- Overall process consists of using low-carbon or renewable electricity for water electrolysis. This process in turn generates hydrogen and oxygen, the latter of which is then reacted with CO2 to produce carbon monoxide.
- Carbon monoxide is then combined with hydrogen to produce a mixture of carbon chains of varying length in a process called Liquid Fuel Production. The resultant liquid product is then separated according to number of carbons and further processed to create SAF or other byproducts as described by multiple embodiment alternatives.
- Invention exhibits a higher kerosene selectivity between 50% - 100%, as opposed to 40% achieved in previous patents of reference.
Technology Strategy Statement
The technology strategy statement of the Brazil Sustainable Aviation Fuel (SAF) production roadmap is to become global leader in SAF by 2050, leveraging its abundant agricultural resources, biofuels expertise, supportive policies and strategic partnerships. The roadmap emphasizes mapping and optimizing feedstock availability, including sugarcane residues, wood residues, and used cooking oil, while expanding research into alternative feedstocks like agave and eucalyptus. Early stages (2024-2026) will focus on scaling first-generation SAF production using AtJ and HEFA technologies and investing in second-generation ethanol (E2G) from sugarcane bagasse, straw and other agricultural waste. By 2027-2029, Brazil aims to bring new biorefineries online, diversify conversion technologies, and expand existing facilities. The long-term strategy (2030-2037) prioritizes optimizing and scaling up technologies while exploring innovative approaches like CO-rich gas fermentation and PtL. By 2038-2050, Brazil seeks to lead the global SAF market through continuous investment in biorefinery expansion, international collaborations, and cutting-edge technologies, ensuring a sustainable and competitive SAF industry.
| Timeline & Strategy | Potential Activities |
|---|---|
| Present |
|
| Foundation Building (2024-2026): |
|
| Scaling Production (2027-2029) |
|
| Technology Advancement (2030-2037) |
|
| Market Leadership (2038-2050) |
|
References
[1] “Developing Sustainable Aviation Fuel (SAF).” Accessed October 6, 2024. https://www.iata.org/en/programs/sustainability/sustainable-aviation-fuels/
[2] IATA, “SAF Handbook”, May 2024. https://www.iata.org/contentassets/d13875e9ed784f75bac90f000760e998/saf-handbook.pdf
[3] BCG, “Brazil Climate Report 2024”, September 2024. https://web-assets.bcg.com/60/86/f21ad8b64238aac139c9c95624e3/brazil-climate-summit-2024.pdf
[4] Portal da Câmara dos Deputados. “Entra em vigor a ‘Lei do Combustível do Futuro’ - Notícias.” Accessed October 9, 2024. https://www.camara.leg.br/noticias/1101627-entra-em-vigor-a-lei-do-combustivel-do-futuro/.
[5] U.S. Department of Energy, U.S. Department of Transportation, U.S. Department of Agriculture, and U.S. Environmental Protection Agency. 2022. SAF Grand Challenge Roadmap: Flight Plan for Sustainable Aviation Fuel. Washington, D.C.: U.S. Department of Energy. https://www.energy.gov/sites/default/files/2022-09/beto-saf-gc-roadmap-report-sept-2022.pdf
[6] Litoral Press. “El Mercurio,” April 18, 2024. https://www.litoralpress.cl/sitio/Prensa_Detalles.cshtml?LPKey=NIKYMS2WMDPQQYZFDBKTCTO4BRTUQCQSU6C2XUEHIL5WPDACR6LQA6OINT3J5EFUEQBSBYX4DNSIA.
[7] “Brasil Pode Ser a ‘Arábia Saudita Do SAF’, Prevê CEO Da Airbus - AgFeed.” Accessed October 7, 2024. https://agfeed.com.br/negocios/brasil-pode-ser-a-arabia-saudita-do-saf-preve-ceo-da-airbus/#.
[8] IATA, "SAF Volumes Growing but Still Missing Opportunities", December 2023. https://www.iata.org/en/pressroom/2023-releases/2023-12-06-02/
[9] RSB & Agroicone. (2021). Feedstock Availability for Sustainable Aviation Fuel in Brazil: challenges and opportunities. RSB. https://rsb.org/wp-content/uploads/2021/04/RSB-SAF-Feedstock-availability-in-Brazil.pdf
[10] EPE. “SUSTAINABLE AVIATION FUELS IN BRAZIL: Future Perspectives.” Empresa de Pesquisa Energetica, Empresa de Pesquisa Energetica, Aug. 2024, https://www.epe.gov.br/sites-pt/publicacoes-dados-abertos/publicacoes/PublicacoesArquivos/publicacao-839/Excecutive%20Summary%20-%20SAF.pdf
[11] EPE. "Biofuels Current Outlook - Year 2023". Empresa de Pesquisa Energetica,Aug. 2024, https://www.epe.gov.br/sites-pt/publicacoes-dados-abertos/publicacoes/PublicacoesArquivos/publicacao-834/NT-EPE-DPG-SDB-2024-03_Biofuels%20Current%20Outlook_Year2023.pdf
[12] S&P Global. "Fuels of the future: Unpacking the pathway for advanced fuels in Brazil". S&P Global Commodity Insights, May 2024, https://www.spglobal.com/commodityinsights/en/market-insights/blogs/agriculture/051024-fuels-of-the-future-unpacking-the-pathway-for-advanced-fuels-in-brazil
[13] Castro, Nicolle Monteiro de. “Brazil SAF Mandate to Target Emissions Reductions Starting in 2027,” May 18, 2022. https://www.spglobal.com/commodityinsights/en/market-insights/latest-news/agriculture/051822-brazil-saf-mandate-to-target-emissions-reductions-starting-in-2027.
[14] Oils & Fats International. “Brazil Introduces Fuel of the Future Green Package.” Accessed November 8, 2024. https://www.ofimagazine.com/news/brazil-introduces-fuel-of-the-future-green-package.
[15] “Advanced BioFuels USA – Brazil SAF Mandate to Target Emissions Reductions Starting in 2027.” Accessed October 31, 2024. https://advancedbiofuelsusa.info/brazil-saf-mandate-to-target-emissions-reductions-starting-in-2027.
[16] “Shell-Backed Ethanol Firm Considers Making SAF in Brazil,” February 20, 2024. https://www.agweb.com/markets/pro-farmer-analysis/shell-backed-ethanol-firm-considers-making-saf-brazil.
[17] “Brazil Prepares to Produce Sustainable Aviation Fuel.” Accessed November 8, 2024. https://revistapesquisa.fapesp.br/en/brazil-prepares-to-produce-sustainable-aviation-fuel/.
[18] Ishka. “SAVi Five: Brazil SAF Targets Head for Approval, New WEF Report, and More….” Accessed October 30, 2024. https://www.ishkaglobal.com/Savi/Article/7400/SAVi-Five-Brazil-SAF-targets-head-for-approval-new-WEF-report-and-more.
[19] https://assets.revistacultivar.com.br/334850e9-8124-4b96-a700-d6dd3b740003.jpg. “Publicada ley que crea programas de combustibles sustentables y refuerza transición energética - Revista Cultivar,” October 9, 2024. https://revistacultivar-es.com/index.php/noticias/Publicada-ley-que-crea-programas-de-combustibles-sostenibles-y-refuerza-la-transici%C3%B3n-energ%C3%A9tica.
[19] SAF Investor. “Ouro Sobre Azul: Brazil Allocates $1bn for SAF Projects.” Accessed October 30, 2024. https://www.safinvestor.com/opinion/145787/brazil/.
[20] Halligan, Neil. “Mubadala-Backed Ethanol Producer Atvos to Build $69m Biomethane Plant in Brazil.” The National. Accessed October 31, 2024. https://www.thenationalnews.com/business/energy/2024/04/11/mubadala-backed-ethanol-producer-atvos-to-build-69m-biomethane-plant-in-brazil/.
[21] Silva, Cedê. “Lula Pledges to Update Carbon Emissions Goals.” The Brazilian Report, June 5, 2023. https://brazilian.report/liveblog/politics-insider/2023/06/05/climate-lula-carbon-emissions-paris/.
[22] 281. “European Union Aerospace and Defense Sustainable Aviation Fuel Regulation,” February 8, 2024. https://www.trade.gov/market-intelligence/european-union-aerospace-and-defense-sustainable-aviation-fuel-regulation.
[23] “Advanced BioFuels USA – GranBio Invests in the Production of Sustainable Aviation Fuel (SAF).” Accessed October 31, 2024. https://advancedbiofuelsusa.info/granbio-invests-in-the-production-of-sustainable-aviation-fuel-saf.
[24] Czapp. “Raízen Intends to Produce Sustainable Aviation Fuel in 3 Years.” Accessed November 8, 2024. https://www.czapp.com/analyst-insights/raizen-intends-to-produce-sustainable-aviation-fuel-in-3-years/.
[25] Pavlenko, N., Searle, S., & Christensen, A. (2019). The Cost of Supporting Alternative Jet Fuels in the European Union. International Council on Clean Transportation (ICCT).
[26] Staples, M. D., Malina, R., Suresh, P., Hileman, J. I., & Barrett, S. R. H. (2018). Aviation CO₂ emissions reductions from the use of alternative jet fuels. Energy Policy.
[27] ASTM D7566. (2020). Standard Specification for Aviation Turbine Fuel Containing Synthesized Hydrocarbons.
[28] Hileman, J., Stratton, R. W., & Donohoo, P. (2010). The Feasibility and Potential of Low-Carbon Renewable Fuel for Commercial Aviation
[29]Aemetis, Inc. (n.d.). Aemetis receives key permit for 90 million gallon per year sustainable aviation fuel and renewable diesel plant in California. https://worldenergy.net/press-release/world-energy-department-of-energy-loan-guarantee/#:~:text=Across%20multiple%20facilities%2C%20World%20Energy,SAF%20per%20year%20by%202030.
[30] Neste. (n.d.). Neste expands its sustainable aviation fuel supply capabilities in Europe in partnership with VTTI. https://www.neste.com/en-us/news/neste-expands-its-sustainable-aviation-fuel-supply-capabilities-in-europe-in-partnership-with-vtti
[31] S&P Global Commodity Insights. (2023, May 3). Shell to deliver first SAF from Rotterdam plant from 2025. https://www.spglobal.com/commodityinsights/en/market-insights/latest-news/agriculture/050323-shell-to-deliver-first-saf-from-rotterdam-plant-from-2025#:~:text=Shell%20did%20not%20specify%20the,sales%20as%20SAF%20by%202030.
[32] World Energy. (n.d.). World Energy + DOE loan program. https://worldenergy.net/press-release/world-energy-department-of-energy-loan-guarantee/#:~:text=Across%20multiple%20facilities%2C%20World%20Energy,SAF%20per%20year%20by%202030.
[33] “SAF Rules of Thumb.” Accessed November 24, 2024. https://www.icao.int/environmental-protection/Pages/SAF_RULESOFTHUMB.aspx
[34] “Sustainable Fuel Conversions.” Accessed November 24, 2024. https://aviationbenefits.org/environmental-efficiency/climate-action/sustainable-aviation-fuel/conversions-for-saf/.
[35] Pavlenko, Nikita. “The Cost of Supporting Alternative Jet Fuels in the European Union,” n.d.
[36] Schaaf, Janet. “Your Guide to Small Business Tax Rates.” LendingTree. Accessed November 24, 2024. https://www.lendingtree.com/business/small-business-tax-rate/.
[37] Bookmark +, Shelley Mika •. “What You Need to Know About Renewable Diesel.” Accessed November 24, 2024. https://www.government-fleet.com/156621/what-you-need-to-know-about-renewable-diesel.
[38] “ChE 4253: LECTURES: CHAPTER 6.” Accessed November 24, 2024. https://www.ou.edu/class/che-design/design1/cost-est.htm
[39] OXCCU. (2024) Startups OXCCU and Zero advance plans to scale up production of eSAF in the UK. Retrieved November 23, 2024, from https://www.greenairnews.com/?p=5832
[40] INERATEC. (2024). Completion of the first e-fuel pioneer plant module. Retrieved November 23, 2024, from https://www.ineratec.de/en/completion-first-e-fuel-pioneer-plant-module
[41] National Renewable Energy Laboratory. (2023). Hydroprocessed Esters and Fatty Acids Pathway. Retrieved from https://www.nrel.gov/docs/fy24osti/87803.pdf
[42] ICAO. (2023). SAF conversion pathways. [PDF]. Retrieved from https://www.icao.int/environmental-protection/Documents/ACT-SAF/ACT%20SAF%20series%205%20-%20SAF%20conversion%20processes.pdf
[43] IEA Bioenergy Task 39. (2024). Progress in Commercialization of Biojet/Sustainable Aviation Fuels. [PDF]. Retrieved from https://www.ieabioenergy.com/wp-content/uploads/2024/06/IEA-Bioenergy-Task-39-SAF-report.pdf?
[44] Innovation Origins. (2023, October 13). Boeing, NASA, and United Airlines test sustainable aviation fuel. Innovation Origins. Retrieved from https://innovationorigins.com/en/boeing-nasa-and-united-airlines-test-sustainable-aviation-fuel/
[45] Empresa de Pesquisa Energética (EPE). (n.d.). Executive summary - SAF. Retrieved November 24, 2024, from https://www.epe.gov.br/sites-pt/publicacoes-dados-abertos/publicacoes/PublicacoesArquivos/publicacao-839/Excecutive%20Summary%20-%20SAF.pdf
[46] CarbonCredits.com. (2023). Oxford University spinoff reveals synthetic fuel plant that could revolutionize aviation. Retrieved November 23, 2024, from https://carboncredits.com/oxford-university-spinoff-reveals-synthetic-fuel-plant-that-could-revolutionize-aviation/
