Difference between revisions of "Remote Operated Processing Platform"
| Line 74: | Line 74: | ||
[[File:FinanceModel1.png|600px|frameless]] | [[File:FinanceModel1.png|600px|frameless]] | ||
[[File:FinanceModel2.jpg|600px|frameless]] | [[File:FinanceModel2.jpg|600px|frameless]] | ||
[[File:FinanceModel3.jpg|600px|frameless]] | [[File:FinanceModel3.jpg|600px|frameless]] | ||
Revision as of 01:56, 18 November 2019
Technology Roadmap Sections and Deliverables
On an offshore oil and gas platform, operators are physically located on the facility to provide local intervention with a goal of ensuring safe, reliable processing capabilities. Introduction of a remote operated platform removes operations and maintenance personnel from being physically located on the platform to a central operating location where the focus is on real-time monitoring and intervention is achieved.
Roadmap Overview
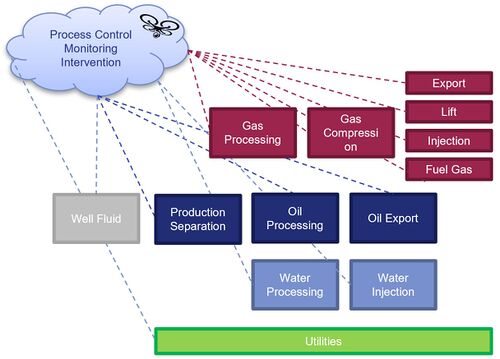
The high-level working principle and architecture of a remote operated oil and gas processing platform is depicted in the below. The core infrastructure of any offshore oil and gas processing facility consists of an inlet well fluid stream and initial separation followed by oil, water, and gas processing streams. Utilities support all processing streams and include main power, instrument air, heating and cooling medium, fresh and seawater supply to name a few.
As of today, these processes are more or less controlled via central control room on a production facility with manual intervention by operations and maintenance personnel, as required. The elimination of onsite personnel is depicted in our overview to highlight a remote control center operated via cloud computing technology.
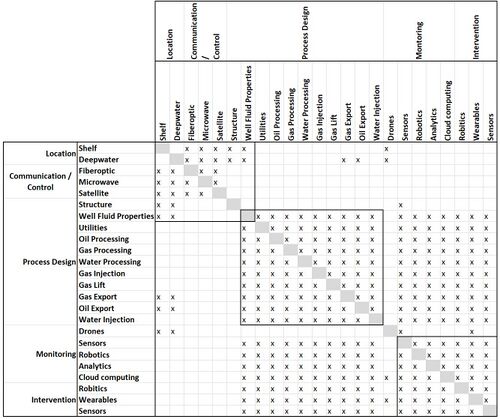
Design Structure Matrix (DSM) Allocation
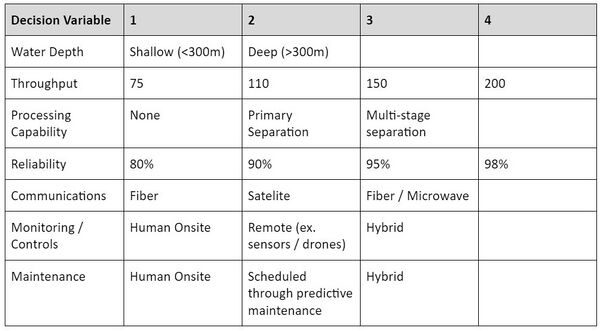
We can extract from the DSM below that the remote operated processing platform is composed of and dependent on a series of decisions and technologies. These decisions and subsequent technologies include facility location, communication and control method, process design, monitoring and intervention.
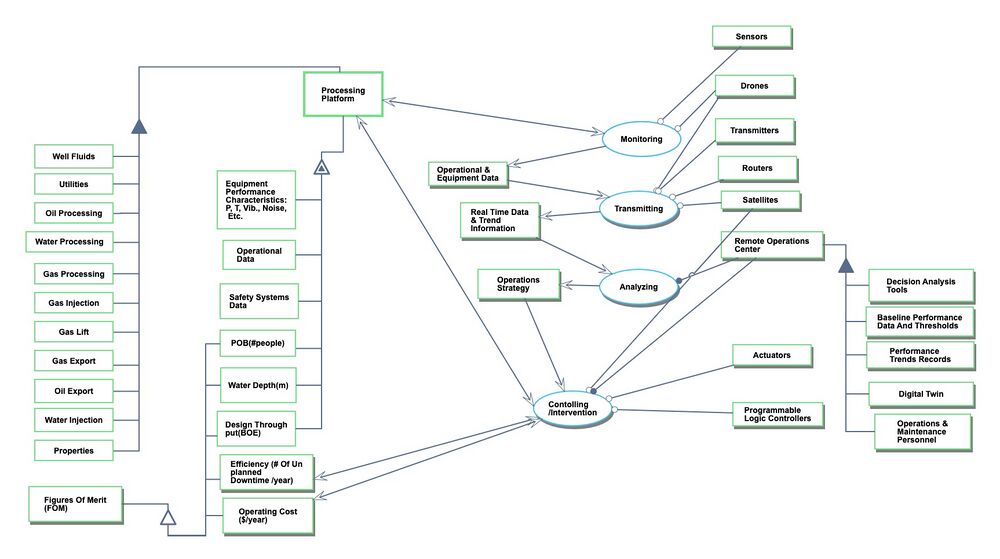
Roadmap Model using OPM
We provide an Object-Process-Diagram (OPD) of the in the figure below. This diagram captures the main object of the roadmap (oil platform), its various processes required for transferring of information to control the facility remotely, as well as the Figures of Merit and main processes.
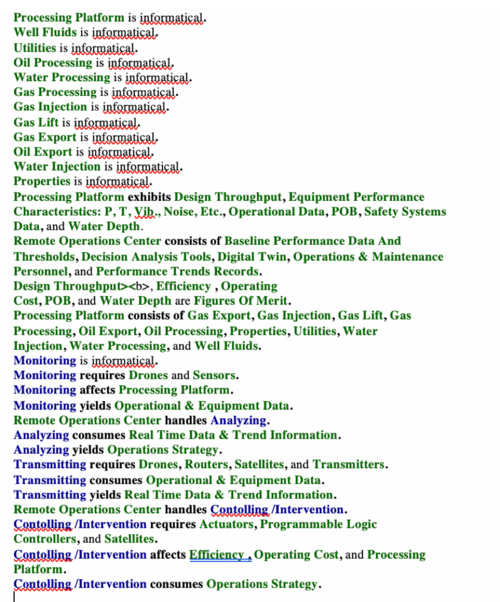
An Object-Process-Language (OPL) description of the roadmap scope is auto-generated via Opcloud and provided below. This is simply an export of the OPD in a formal natural language.
Figures of Merit
The table below show a list of FOMs by which a remote operated processing platform can be assessed. The first two highlight the driver to maintain capability for maximum design throughput of a facility with minimum number of personnel onsire, with a target of zero. While not directly mentioned, the tradeoffs associated with complexity as indicated by water depth and capacity need to be considered with the personnel in trade space. Water depth is a FOM that we are continuing to develop, with a thought that the theoretical limit to a remote operated facility will likely be limit in technology for location, which translates to water depth of the facility. Unit cost (CAPEX expenditure) and operating costs are directly correlated with the reduction of personnel onsite full time operating and maintaning a facility. Lastly, Total Recordable Incident rate is an emergent FOM derived from reduction in personnel exposure will result in reduction in incident rate.
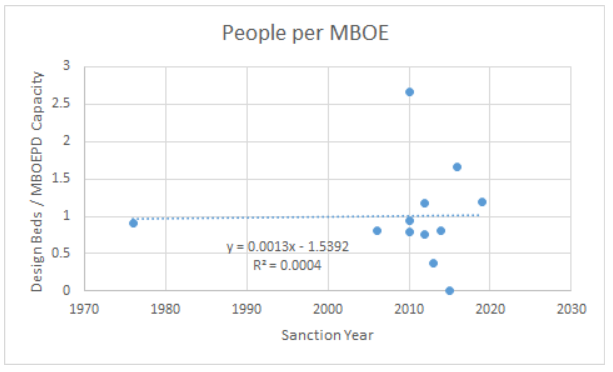
When we look at the the changes in time for people vs. capacity, we do not see not see any trend. This measure has not been a key consideration in the past, and we would consider it a disruptive technology as it changes the focus of figures of merit.
Alignment with Company Strategic Drivers
The table below outlines potential strategic drivers and alignment of remote operated platforms with the company targets.
Positioning of Company vs. Competition
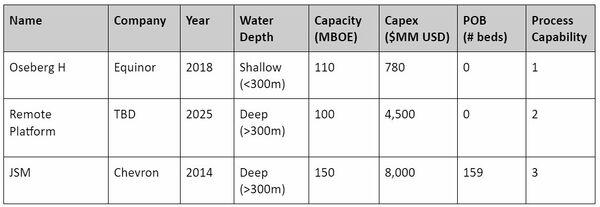
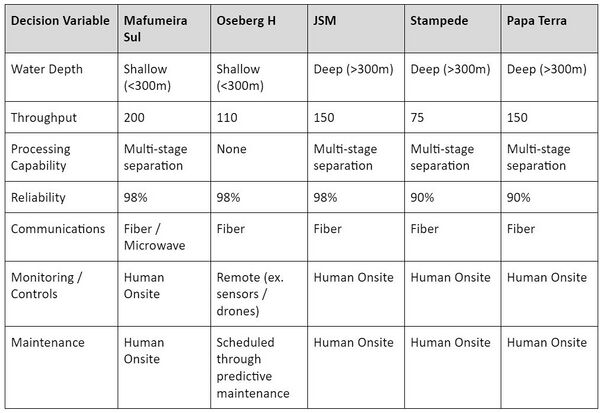
The process capability listed in the competition table is illustrative of either 1-no separation (process fluid transportation), 2-stage (liquid/gas) or 3-stage oil/water/gas. As illustrated in the competition landscape, there is one known unmanned wellhead platform that is operated remotely from a central facility and many offshore processing platforms in operation.
Note that there are many examples (excluded from table, included in Pareto Front) with 3-stage process capability at various capacities and POB values. This table was compiled to show an estimate of a future installation of a simple processing platform with 2-stage separation operated remotely.
Technical Model
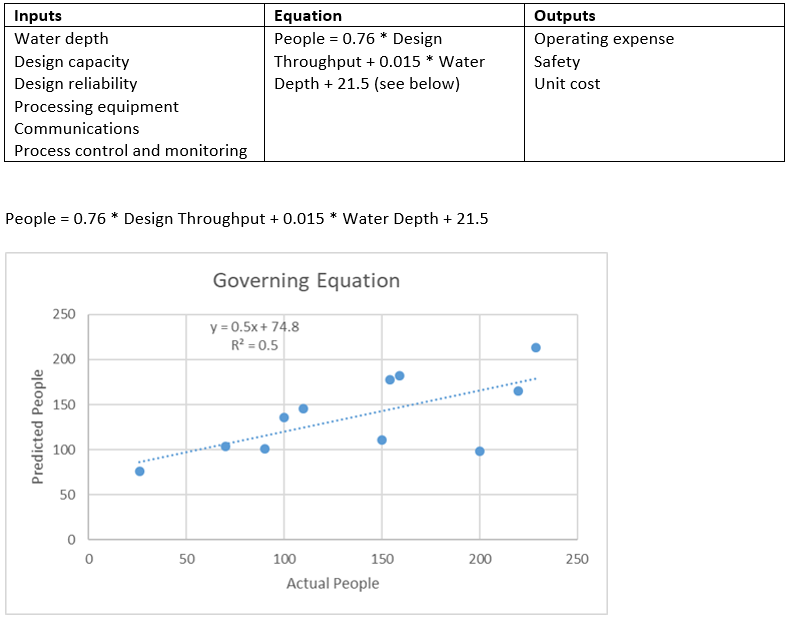
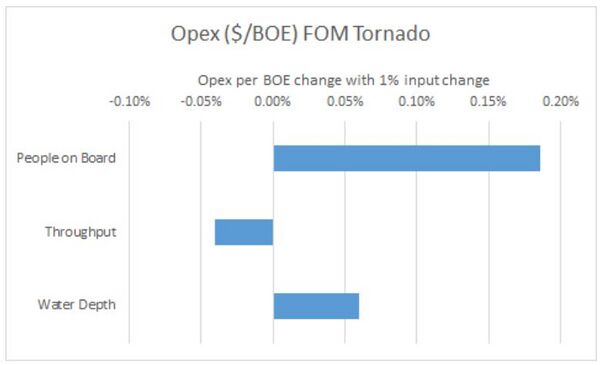
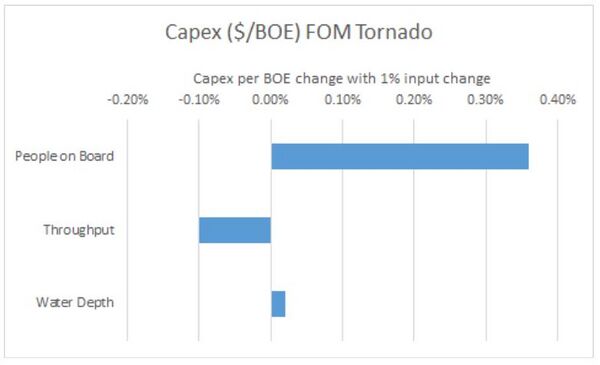
Sensitivities were calculated through multiple-regression of projects with the key parameters. An average variation was used to calculate the sensitivity using the sample data. Note, in all cases the coefficients demonstrate significant uncertainty (t scores typically between 1 and 2). In the design People on Board, we were able to use actual data. For the Opex and Capex sensitivities, we need to use a combination of sources. External data available through WoodMac was utilized to identify cost sensitivity to water depth and throughput. Proprietary studies and public data were used to estimate the sensitivity to design people on board. While we believe the results are representative, we do note that there is significant uncertainty.
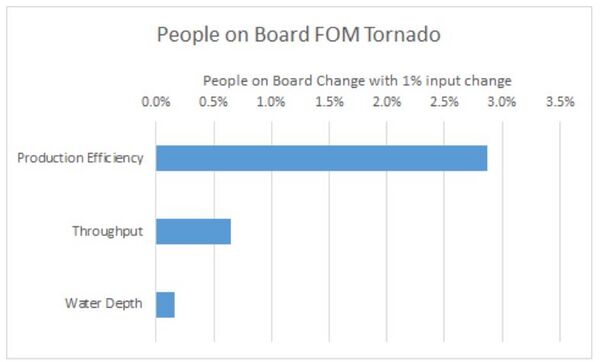
Key Points The key insight is that the People on Board FOM is most sensitive to production efficiency which is a proxy for reliability. This intuitively makes sense as the people are on the platform to ensure that operations are stable and continuous. It also highlights that by designing to a higher reliability, one can tradeoff the number of people on the platform. This dovetails to Capex / bbl and Opex / bbl metrics. The hypothesis is that there is a tradeoff between Capex, Opex, and people. Interestingly enough, reducing the design People on Board reduces both Capex and Opex. The intuition is that it avoids capital expenditure such as living quarters and other systems designed specifically for people. Having less people means a lot less associated expenses which is logical. This brings up the interesting point that if it reduces capex and opex per barrel, then why have there been no discernible changes is People on Board over time? The answer is not clear at this time but might be related to the increased technical complexity of developments over time (easier developments are no longer available) and the technical challenges with increasing reliability / decreasing people. Of note, it is also possible that the relationship is not linear and while completely removing people is highly economic, it might take incremental steps that have marginal economics.
Financial Model
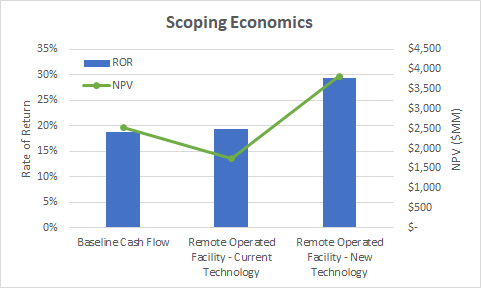
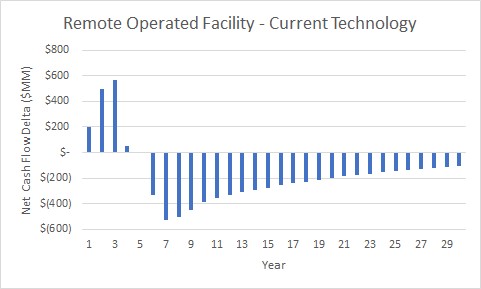
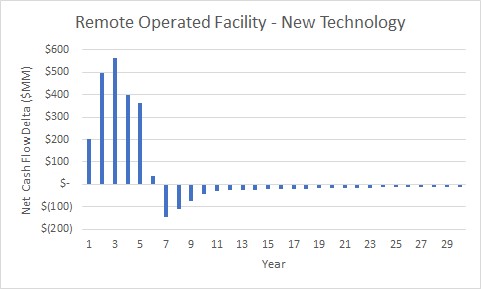
The value of the technology was modeled in two different evaluations: 1.) remote operated platform with no technology improvements vs. and 2.) remote operated platform with technology improvements vs. current standard architecture. This allows the problem to be separated into the decision component and technical challenges. This required three different cases for the economics. First, we ran the constructed a baseline model with the key assumptions of 100 People on Board (POB) design capacity and 75 MMBOEPD to reflect current developments. Next, we constructed the performance if the POB was reduced to zero using current technology for the 100% reduction in POB - Current Technology shown in the graph below. We utilized the results of the tornado analysis to forecast the impact on reliability and capital cost. Finally, we constructed the 100% reduction in POB - New Technology by implementing R&D / R&T projects to improve reliability. The results are shown in both absolute and delta terms below. The results indicate the technology reduces the investment required, so we first considered the rate of return as a measure of capital efficiency in addition to NPV. As can be seen below, reducing the people operating a platform is essentially a net neutral financially. The NPV decreases due to lower revenues from reduced reliability, but the rate of return remains essentially the same due to an offsetting reduction in capex. These can be seen in the delta cash flow from baseline charts below as well. The key to the viability of the technology is the success case which demonstrates large increases in both rate or return as well as NPV by implementing projects to improve the reliability of the remotely operated facility.
