Difference between revisions of "Autonomous System for Ground Transport"
| (8 intermediate revisions by the same user not shown) | |||
| Line 64: | Line 64: | ||
[[File:FOM_Autonomous_Ground_Transport.png|800 px]] | [[File:FOM_Autonomous_Ground_Transport.png|800 px]] | ||
For this roadmap, we will narrow down our focus on | For this roadmap, we will narrow down our focus on Reliability, measured by miles per intervention. the reliability FOM can be decomposed into component technologies which include perception technology, enabled by sensors. We will over the governing equations for radar sensors in later section of this roadmap. | ||
[[File:FOM Trends.png|800 px]] | [[File:FOM Trends.png|800 px]] | ||
The performance data here | The performance data were extracted from the disengagement report from Californa's Department of Motor Vehicles. The data here were reported by the indicated companies from their testing of autonomous vehicles in a bounded test environment of public roads in California. [ref https://thelastdriverlicenseholder.com/2019/02/13/update-disengagement-reports-2018-final-results/] | ||
Considering the average logarithmic performance values of the FOM, the average rate of improvement from 2015 to 2016 is about 8% (dFOM/dt). | Considering the average logarithmic performance values of the FOM, the average rate of improvement from 2015 to 2016 is about 8% (dFOM/dt). | ||
| Line 110: | Line 111: | ||
[[File:Radar_Range_2.png]] | [[File:Radar_Range_2.png]] | ||
From the sensitivity analysis plot, we see that the various parameters in the governing equation has the same sensitivity for detection range. However, to improve detection range performance in the context of autonomous vehicle perception system, we may choose to focus on reducing Smin, to reduce the detectable signal threshold and/or improving the effective aperture of the radar antenna. These improvements could be potentially achieved through waveform design or signal processing methods and would have minimal impact on the rest of the autonomous system components (as compared to increasing power output). | |||
The following table presents the morphological matrices of range or various types of sensors | The following table presents the morphological matrices of range or various types of sensors | ||
| Line 120: | Line 123: | ||
[[File:RadarResolution.jpg]] | [[File:RadarResolution.jpg]] | ||
To improve radar resolution, signal processing techniques such as pulse compression could be employed with minimal impact to the autonomous system. | |||
The following table presents the morphological matrices of range resolution for various types of sensors | The following table presents the morphological matrices of range resolution for various types of sensors | ||
| Line 150: | Line 155: | ||
# Market Demand Growth Rate: ''' 2%''' (conservative assumption) | # Market Demand Growth Rate: ''' 2%''' (conservative assumption) | ||
# Target Annual Output Capacity: '''200000''' systems (initial design capacity, with flexibility to increase or decrease based on actual sales) | # Target Annual Output Capacity: '''200000''' systems (initial design capacity, with flexibility to increase or decrease based on actual sales) | ||
# Revenue per system: '''$10000''' for sensor hardware and manpower (sensor prices are expected to be lowered to the range of $5-7000 by 2025 due to technology development and high volume of demand) | # Revenue per system: '''$10000''' for sensor hardware and manpower (sensor prices, including LIDARS etc, are expected to be lowered to the range of $5-7000 or even lower by 2025 due to technology development and high volume of demand) [ref : https://velodynelidar.com/newsroom/velodyne-lidar-announces-new-velarray-lidar-sensor/] | ||
# Cost per system: '''$8000''' (assumed 25% margin) | # Cost per system: '''$8000''' (assumed 25% margin) | ||
# Recurring revenue: '''$1000''' per system (maintenance and software upgrades) | # Recurring revenue: '''$1000''' per system (maintenance and software upgrades) | ||
| Line 160: | Line 165: | ||
==List of R&T Projects and Prototypes== | ==List of R&T Projects and Prototypes== | ||
According to our technical and financial models, several goals and milestones emerged for the future development trend regarding the autonomous system for ground transport. These development opportunities go along with the figures of merit discussed above and thus can be further materialized into various projects. Below is a list of the potential projects and their respective categorization, along with their individual risk level and priority. The level of priority is evaluated based on the | According to our technical and financial models, several goals and milestones emerged for the future development trend regarding the autonomous system for ground transport. These development opportunities go along with the figures of merit discussed above and thus can be further materialized into various projects. Below is a list of the potential projects and their respective categorization, along with their individual risk level and priority. The level of priority is evaluated based on how soon the technology is required along the development timeline as well as the relative maturity level. That is to say, a relatively matured technology (less development work required to realize it) which is needed the soonest, will be of high priority. The level of risk is evaluated based on the level of disruptiveness the project would bring to the current technology. | ||
[[File:ListofProjectsTeam11.png|800 px]] | [[File:ListofProjectsTeam11.png|800 px]] | ||
Based on our near-term milestone of bringing the autonomous driver assistance product to the trucking industry, we suggested that project number 5 and 6, which would eventually enable cross vehicle communication and increase transport safety, have the the highest priority among the listed projects. | |||
Project number 2, which is to develop sensors with higher resolution in order to increase the reliability of the perception system within the autonomous system for ground transport, should also be implemented. If carried out properly with milestones achieved on schedule, this project would result in a shift of the Pareto front as shown below, which leads to an improvement in the reliability related FOM. | Project number 2, which is to develop sensors with higher resolution in order to increase the reliability of the perception system within the autonomous system for ground transport, should also be implemented. If carried out properly with milestones achieved on schedule, this project would result in a shift of the Pareto front as shown below, which leads to an improvement in the reliability related FOM. | ||
| Line 246: | Line 251: | ||
'''Our long term target is to develop a fully autonomous system for all ground transport systems by 2050 with a reliability performance of 1 intervention per 10<sup>15</sup> miles . This final target requires significant technological breakthroughs along all broad key FOMs (Safety, Compatibility, Reliability and Cost). As such, we will focus on near term development milestones as part of our long term technology strategy. | '''Our long term target is to develop a fully autonomous system for all ground transport systems by 2050 with a reliability performance of 1 intervention per 10<sup>15</sup> miles . This final target requires significant technological breakthroughs along all broad key FOMs (Safety, Compatibility, Reliability and Cost). As such, we will focus on near term development milestones as part of our long term technology strategy. | ||
In this key near term milestone, we target to develop advance driver-assistance system (ADAS) for the truck transportation industry. This milestone has a realistic timeline with a viable business model. Through this milestone, we will be able to establish an operational test bed towards advanced autonomy while generating income for subsequent R&D. For this milestone, we will invest in two R&D projects. The first project will look at developing perception system across vehicles to enable platooning movements for the trucks. The second project will look at incorporating redundancies in autonomy control units. These R&D projects involve relatively mature technology components and will enable us to reach our goal by 2023 to begin integrating the technology onto truck fleets. | In this key near term milestone, we target to develop advance driver-assistance system (ADAS) for the truck transportation industry, targeting both single and platoon truck transportation. This milestone has a realistic timeline with a viable business model. Through this milestone, we will be able to establish an operational test bed towards advanced autonomy while generating income for subsequent R&D. For this milestone, we will invest in two R&D projects. The first project will look at developing perception system across vehicles to enable platooning movements for the trucks. The second project will look at incorporating redundancies in autonomy control units. These R&D projects involve relatively mature technology components and will enable us to reach our goal by 2023 to begin integrating the technology onto truck fleets. | ||
''' | ''' | ||
[[File:Swoosh chart.png|800 px]] | [[File:Swoosh chart.png|800 px]] | ||
Latest revision as of 04:27, 11 December 2019
Technology Roadmap Sections and Deliverables
The first point is that each technology roadmap should have a clear and unique identifier:
- 2ASGT - Autonomous System for Ground Transport
This indicates that we are dealing with a “level 2” roadmap at the product or system level, where “level 1” would indicate a social level roadmap and “level 3” or “level 4” would indicate an individual technology roadmap.
Roadmap Overview
The overview and working principle of autonomous ground transport is depicted below:
Autonomous transport has four main components, namely (1)Perception, (2)Localization, (3)Planning, and (4)Control. The four components work together as depicted in the overview to enable the autonomous capabilities in the transport system.
(1) Perception The data from sensors (radars, lidars, cameras etc) are integrated to build a comprehensive and detailed understanding of the vehicle’s environment
(2) Localization GPS and algorithms are employed to determine the location of the vehicle relative to its surrounding. It is critical for the accuracy to be within the order of centimeters to ensure that the vehicle stay on the road.
(3) Planning With the understanding of the environment and the vehicle's relative location within, a transport route can be planned to get to the desired destination. This involves predicting the behavior of other entities (other vehicles, pedestrians etc) in the immediate proximity followed by deciding the appropriate actions to be taken in response to them. Lastly, a route is developed to reach the destination within required conditions (safety, comfort etc)
(4) Control The planned route is passed onto the vehicle. In this execution phase, the route is translated into control instructions for the vehicle to turn the steering wheel, hit the accelerator or the brake etc.
The autonomous transport technology is intended to bring about improvements in mainly safety and mobility. The number of fatalities in motor incidents are significant each year and autonomous vehicles could potentially reduce that number with the use of software that are less error-prone or less susceptible to distractions than humans. At the same time, autonomous technology can offer mobility to disable or elderly individuals where it is needed the most.
History of Autonomous System for Ground Transport
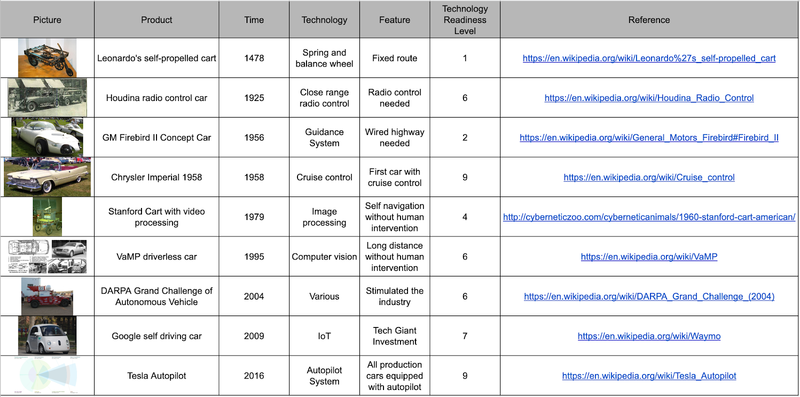
The first conceptual design was proposed by Leonardo da Vinci in 1478, almost five centuries before pervasive adoption of automobiles. It was technically, however, not the type of autonomous vehicle we refer to at present because the concept focused more on self propelled vehicle with mechanical spring system moving on fixed and predefined routes. We argue that the first ground transport vehicle was the Houdina radio control car built and tested in 1925 as no driver was required to be present in the vehicle itself, despite the fact that the car was indeed remotely controlled by a driver. The major milestones together with their relevant information are listed below.
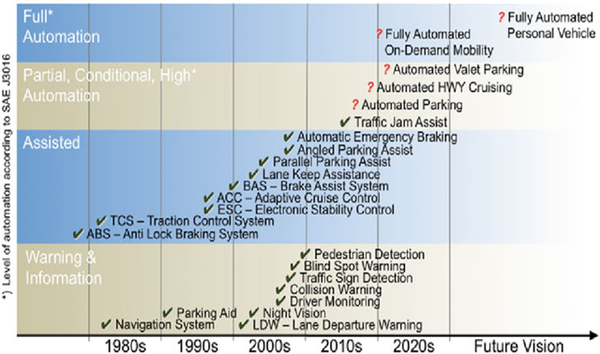
We charted the technology readiness level of the major milestones over time below. It is worthwhile to point out that the emergence of internet in 1970s and internet of things in 2010s have dramatically improved the development of autonomous technologies and enabled the inclusion of additional technologies into the autonomous system for ground transport.
Design Structure Matrix (DSM) Allocation
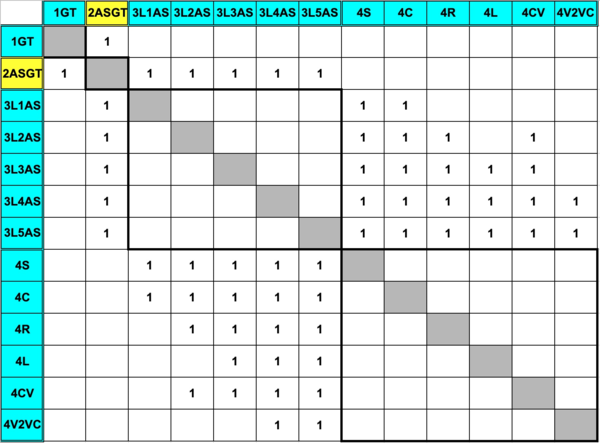
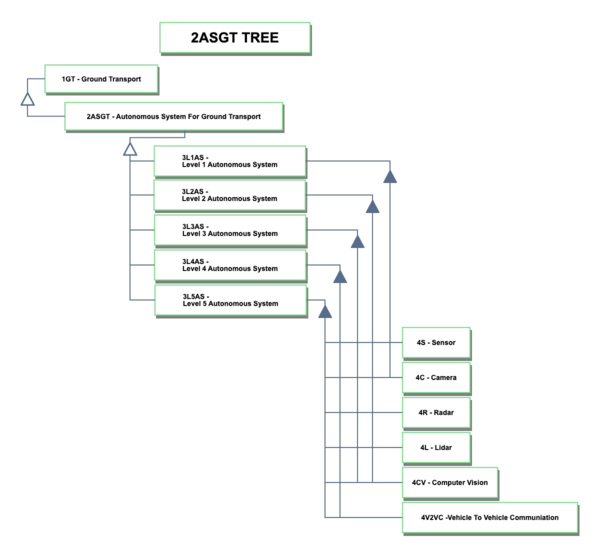
The autonomous system for ground transport technology sits at level 2 abstraction and is a specification of ground transport at level 1. It can be classified into 5 different level of autonomy.
Each level of autonomous system requires a certain number of enabling technologies such as sensors and cameras, which are the level 4 abstraction in the system architecture hierarchy. Going further, it could be insightful for roadmap construction to further decompose the level 4 systems into more specific types of technologies.
The Object-Process-Language (OPL) description complements the second level autonomous system for ground transport (2ASGT) tree.
Roadmap Model using OPM
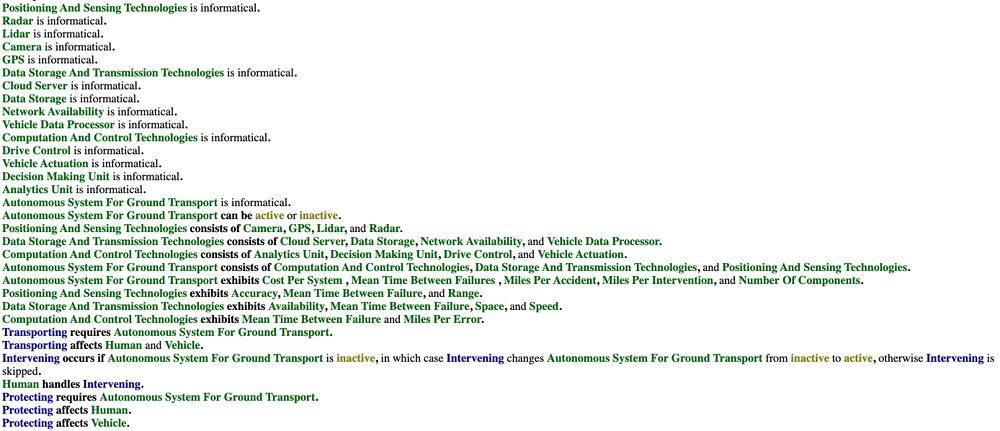
We provide an Object-Process-Diagram (OPD) of the 2ASGT roadmap in the figure below. This diagram captures the main object of the roadmap (Autonomous System for Ground Transport), its 2-level decomposition into enabling systems (Positioning and Sensing Technologies, Data Storage and Transmission Technologies, Computation and Control Technologies), its characterization by Figures of Merit (FOMs) as well as the main processes and other objects it interacts with.
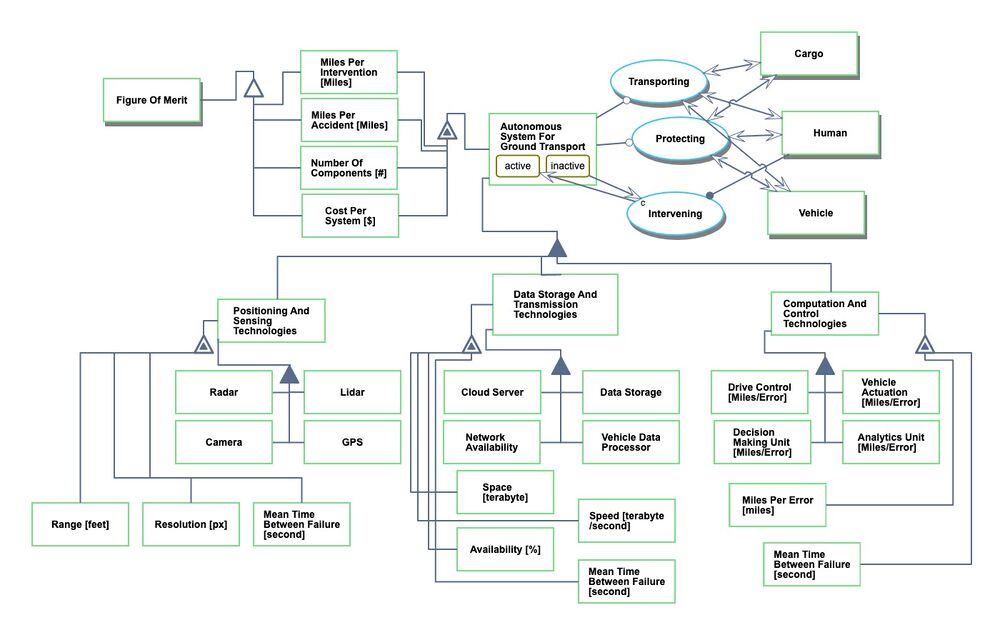
An Object-Process-Language (OPL) description of the roadmap scope is auto-generated and given below. It reflects the same content as the previous figure, but in a formal natural language.
Figures of Merit
Four main figures of merit, in terms of reliability, safety, compatibility, and cost are used to quantify the performance and utility level of the autonomous system for ground transport.
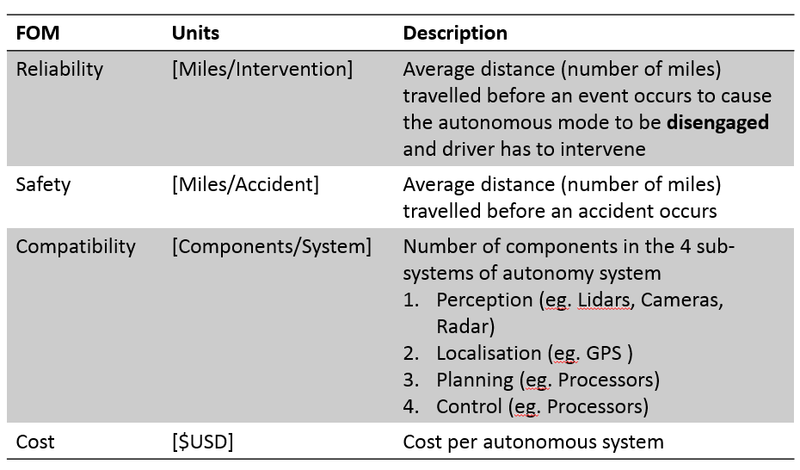
For this roadmap, we will narrow down our focus on Reliability, measured by miles per intervention. the reliability FOM can be decomposed into component technologies which include perception technology, enabled by sensors. We will over the governing equations for radar sensors in later section of this roadmap.
The performance data were extracted from the disengagement report from Californa's Department of Motor Vehicles. The data here were reported by the indicated companies from their testing of autonomous vehicles in a bounded test environment of public roads in California. [ref https://thelastdriverlicenseholder.com/2019/02/13/update-disengagement-reports-2018-final-results/]
Considering the average logarithmic performance values of the FOM, the average rate of improvement from 2015 to 2016 is about 8% (dFOM/dt).
Alignment with Company Strategic Drivers
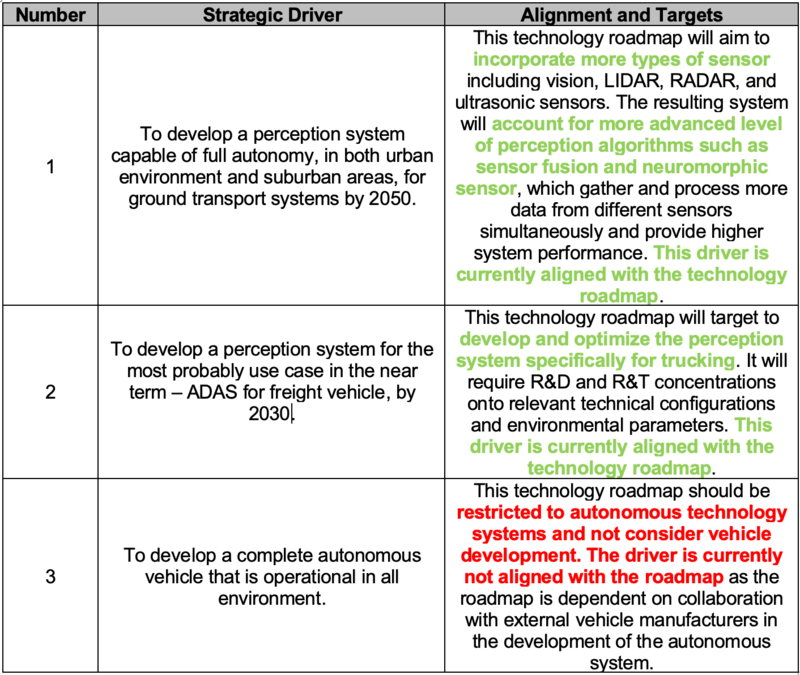
The table below shows the potential strategic drivers and their respective alignment with the perception system for autonomous system for ground transport technology roadmap.
As shown the table above, this technology roadmap should target to achieve the strategic driver 1 and 2. Driver 1 yields a perception system that is capable of helping vehicles to accomplish full autonomy under urban and suburban operational environments. This requires the inclusion of more advanced perception algorithms such as sensor fusion and neuromorphic sensing, which would also improve the reliability and accuracy of the autonomous system for ground transport. Driver 2 asks for a perception system that is customized for and compatible with the transportation mode of trucking.
Positioning of Company vs. Competition
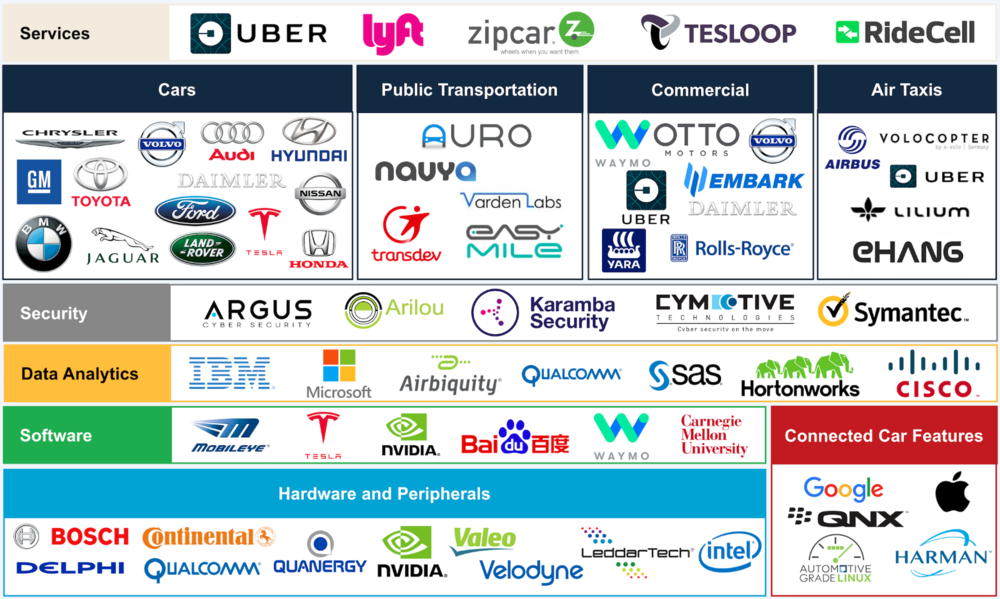
The Autonomous system for ground transport is a growing industry still in its youth, and like many other technologies, it is an ecosystem that involves various clusters and sectors of enabling technologies. Different companies take up their own market share by providing the industry with certain number of forms and/or functions. It is not at all an exaggeration to say that any company in the technology sector has something to do with the autonomous driving ecosystem.
(Source: https://acceleratingbiz.com/proof-point/autonomous-connected-vehicle-ecosystem/)
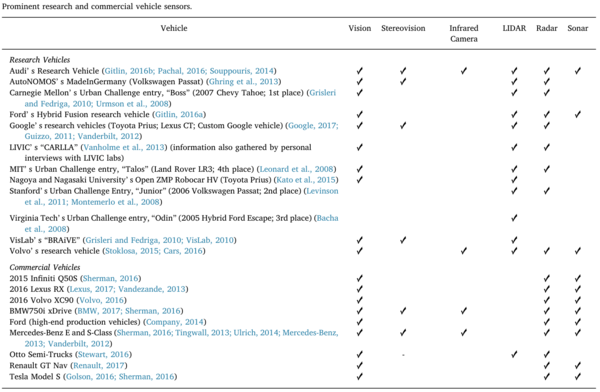
Within the automobile industry, functions pertaining to autonomous driving have been gradually implemented onto the high end vehicles, as shown in the exhibit below on the left, whose customers are able and willing to pay a premium for these advanced yet developing features. It is a trend that autonomous system would be permeating into a wider range of automobiles especially in trucks, buses, as well as the middle to low end passenger vehicles.
Here we focus on the perception system configurations of products and projects related to autonomous driving development, as presented in the figure below on the right. One observation is that choices regarding types of sensor have been mainly converging into vision, LIDAR, RADAR, and Sonar. This pattern initiated and grounded our technical model construction of the perception system within the autonomous system for ground transport as we concentrate our research and analysis on these four types of sensors.
Our product aims to equip trucks with platooning and other autonomous driving capabilities via advanced perception and cross vehicle coordination systems.
One drawback of our study on company position and competition, unfortunately, is that most of the autonomous driving technology companies did not publish the parameters and specifications of the sensors they were employing, which makes it difficult to quantify the perception systems available. From a more academic perspective, the majority of publications and research on design and building perception systems were based on either experimental or empirical approaches, making it hard to plot a Pareto front of state of art of the perception systems and their embedded sensor technologies.
Technical Model
In order to accomplish autonomous driving, the perception system is crucial and functions like the eyes and ears of the vehicle. It is the perception system that acquires relevant information and enables the driver assistance functions such as cruise control, automatic braking, lane change assist, traffic signage recognition, and object detection. Together, these automated functions compose an autonomous driving system.
This technology roadmap concentrates on different types of sensors, which are the most significant enabling components, employed in the perception system. Four most common types of sensors and their respective properties are listed in the table below.
One of the metrics mattered for different types of sensor is range, which represents detection coverage.
The analytical expression for radar detection range and normalized technological sensitivity is as shown
From the sensitivity analysis plot, we see that the various parameters in the governing equation has the same sensitivity for detection range. However, to improve detection range performance in the context of autonomous vehicle perception system, we may choose to focus on reducing Smin, to reduce the detectable signal threshold and/or improving the effective aperture of the radar antenna. These improvements could be potentially achieved through waveform design or signal processing methods and would have minimal impact on the rest of the autonomous system components (as compared to increasing power output).
The following table presents the morphological matrices of range or various types of sensors
Another metric outstanding is the range resolution, which represents the measurable smallest difference in distance and determines whether or not two objects can be separated or perceived as one.
The analytical expression for radar resolution and normalized technological sensitivity is as shown
To improve radar resolution, signal processing techniques such as pulse compression could be employed with minimal impact to the autonomous system.
The following table presents the morphological matrices of range resolution for various types of sensors
The architectural performance index approach was adopted to quantify the perception system performance of the autonomous system for ground transport as given below
APIs are computed for range and resolution respectively for the performance analysis.
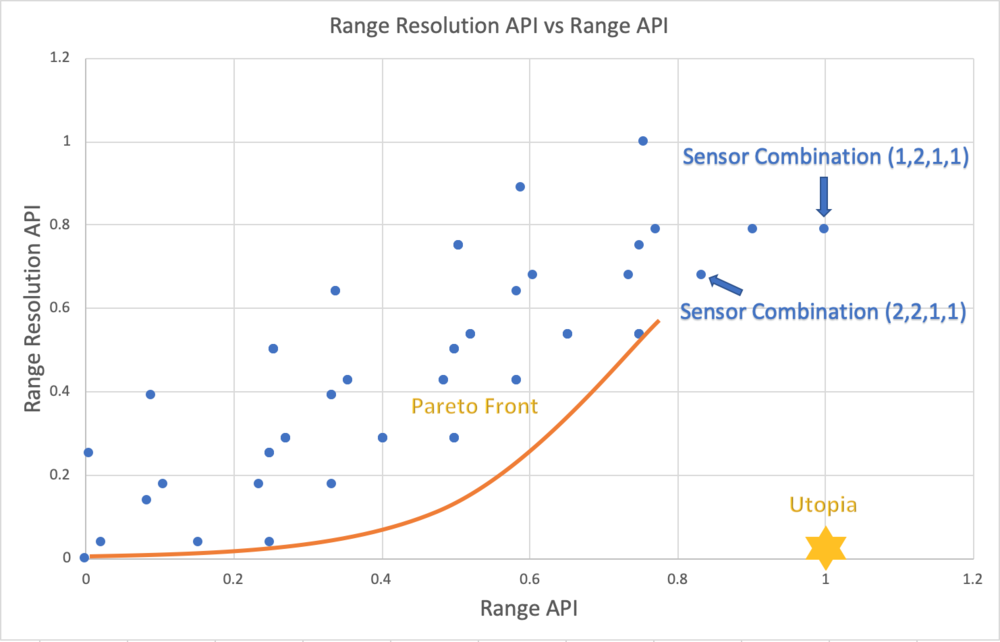
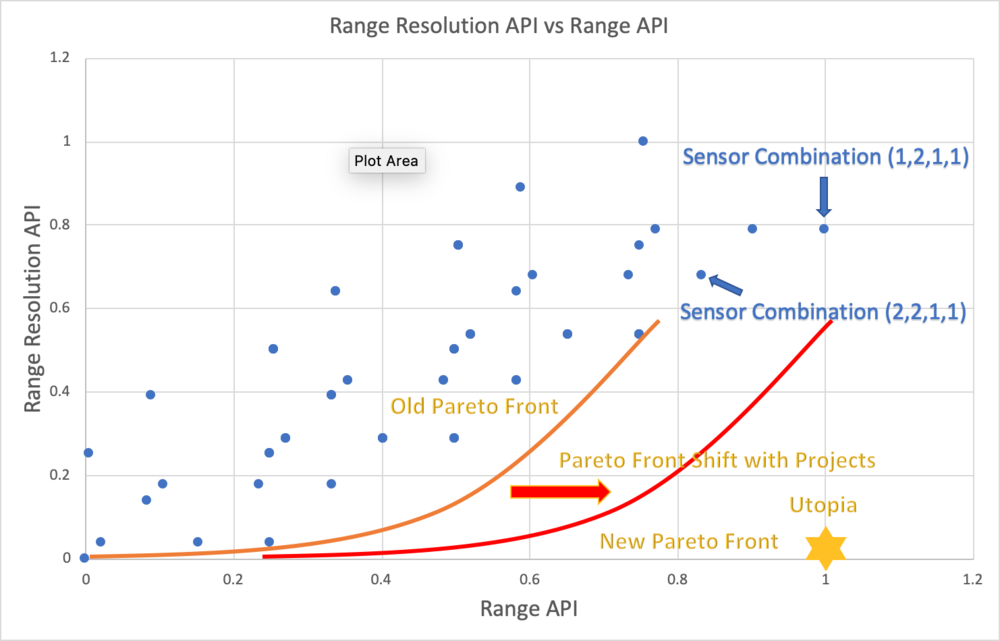
Making a tradeoff between range and range resolution is oftentimes a challenge when selecting sensors to form a viable perception system for the autonomous system for ground transport. The performance of 60 sensor configurations from the morphological matrices and the Pareto Front is as shown below.
The (0,0) point represents the least favorable combination of sensors while the two indicated sensor combinations consist of the state of the art technologies in perception system.
Financial Model
Based on our technology assessment and market review, we've decided as a near term strategy milestone, to focus on the truck transportation industry. There has been increasing demand for truck drivers (about 60000 driver shortage in 2018 and an estimated 1.1 million new drivers over the next decade) due to the significant increase in freight volume. It is therefore imperative to enable new drivers to get up to speed within a short period of time. Driver assistance technology is a probable solution to bring the learning curve from 20 years of experience down to 2 years, hence lowering the threshold for bringing in new drivers. At the same time, technology requirements for highway use cases are considerably less stringent than urban use cases, with longer distance sensing and higher sensing resolution being the key technology requirements.
Given the considerations, we developed a financial model for the near term strategy with the following assumptions
- Existing development and manufacturing infrastructure is sufficient, no additional capital investment is required.
- R&D investment: $30M per year for first 3 years (Mainly on sensors range and resolution performance, cross-platform perception communication and integration across range of truck platforms)
- Ramping up duration: 5 years
- Total program duration: 22 years (in line with estimated time frame of next evolution in autonomous technology)
- Total Initial Market Demand: 3500000 trucks (To be conservative, only class 8 trucks were considered. In service class 8 truck is estimated to be at 3.5 million in 2018 with a annual growth of 5% due from retail sales)
- Market Demand Growth Rate: 2% (conservative assumption)
- Target Annual Output Capacity: 200000 systems (initial design capacity, with flexibility to increase or decrease based on actual sales)
- Revenue per system: $10000 for sensor hardware and manpower (sensor prices, including LIDARS etc, are expected to be lowered to the range of $5-7000 or even lower by 2025 due to technology development and high volume of demand) [ref : https://velodynelidar.com/newsroom/velodyne-lidar-announces-new-velarray-lidar-sensor/]
- Cost per system: $8000 (assumed 25% margin)
- Recurring revenue: $1000 per system (maintenance and software upgrades)
- Discount rate: 15% (based on industry norm)
List of R&T Projects and Prototypes
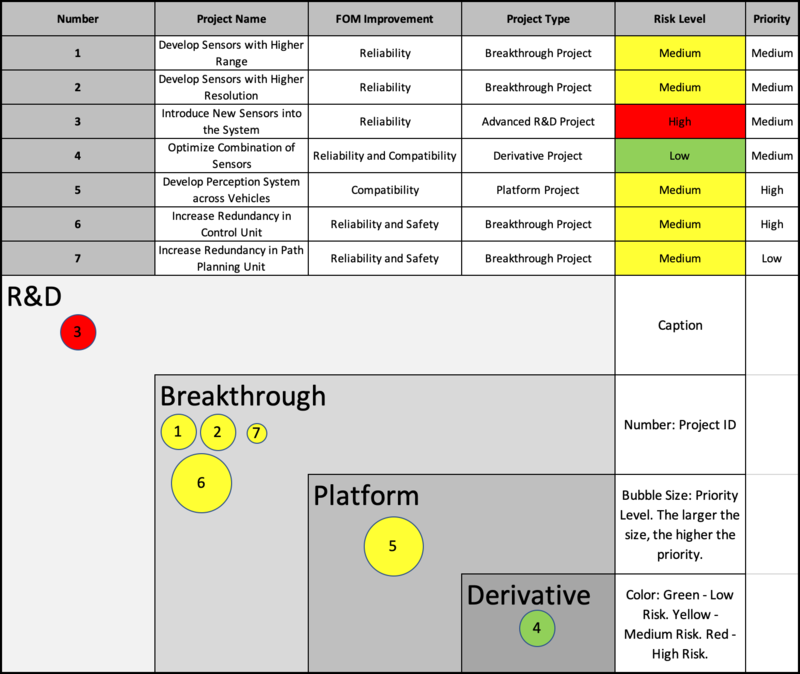
According to our technical and financial models, several goals and milestones emerged for the future development trend regarding the autonomous system for ground transport. These development opportunities go along with the figures of merit discussed above and thus can be further materialized into various projects. Below is a list of the potential projects and their respective categorization, along with their individual risk level and priority. The level of priority is evaluated based on how soon the technology is required along the development timeline as well as the relative maturity level. That is to say, a relatively matured technology (less development work required to realize it) which is needed the soonest, will be of high priority. The level of risk is evaluated based on the level of disruptiveness the project would bring to the current technology.
Based on our near-term milestone of bringing the autonomous driver assistance product to the trucking industry, we suggested that project number 5 and 6, which would eventually enable cross vehicle communication and increase transport safety, have the the highest priority among the listed projects.
Project number 2, which is to develop sensors with higher resolution in order to increase the reliability of the perception system within the autonomous system for ground transport, should also be implemented. If carried out properly with milestones achieved on schedule, this project would result in a shift of the Pareto front as shown below, which leads to an improvement in the reliability related FOM.
The relevant R&D and R&T projects are to be completed in three phases, development, production, and operation. The sensor development would be conducted both internally and externally in order to pursue a higher component performance. The vehicle perception coordination system, as the core technical competency of the company, would be researched and produced mostly internally. Control system redundancy feature would be kicked off after the two aforementioned system are practically verified and validated.
Key Publications, Presentations and Patents
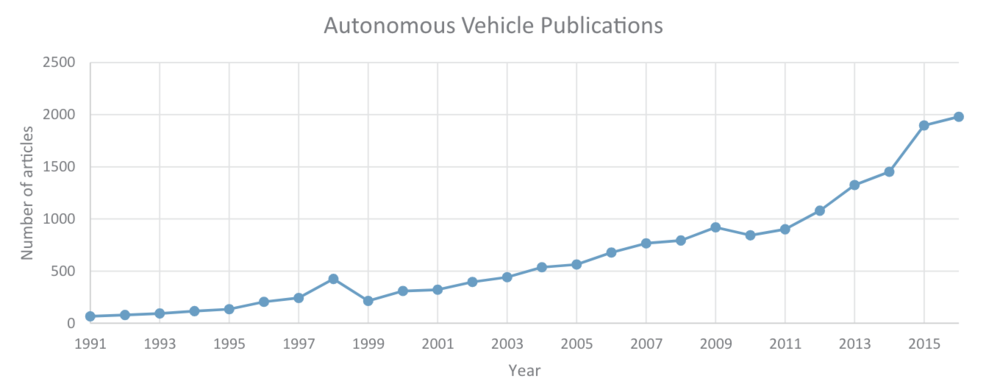
The latest three decades witnessed the emergence of autonomous vehicle development. Despite the fact that bias might exist that more recent publication got archived digitally, the number of publications pertaining to autonomous vehicle has been increasing according to the Web of Science database as shown in the exhibit below.
We performed a search for publications and patents relevant to the perception system on the autonomous system for ground transport. These research serve as technological guidance and approach reference for our technology roadmap.
Publications:
Title: Autonomous driving in urban environments: Boss and the Urban Challenge
URL: https://onlinelibrary.wiley.com/doi/abs/10.1002/rob.20255
Key Words: Motion Planning, Perception, Mission Planning, Behavioral Reasoning
Description: This journal paper introduces a three-layer autonomous driving planning system using an autonomous vehicle called Boss, which won the 2007 DARPA Urban Challenge, as an example. Its autonomous system on board comprises of mission, behavior, and motion planning systems. The paper presents the mathematical foundation as well as the development process for the autonomous system that could be generally applied to other similar systems.
Title: Are we ready for autonomous driving? The KITTI vision benchmark suite
URL: https://ieeexplore.ieee.org/stamp/stamp.jsp?tp=&arnumber=6248074
Key Words: Visual Sensors Benchmark
Description: This publication proposes a benchmark for visual sensing and object recognition on the autonomous driving system via an experimental approach. Stereo camera and LIDAR are the two main types of sensors incorporated into the tested system. Data acquisition, sensor calibration, and related evaluation metrics for the system benchmark are discussed to form a suggested framework for visual sensors benchmark.
Title: A Low Cost Sensors Approach for Accurate Vehicle Localization and Autonomous Driving Application
URL: https://www.mdpi.com/1424-8220/17/10/2359
Key Words: Low Cost Sensors for Localization and Autonomous Driving
Description: This paper presents a low cost sensors approach for autonomous driving system which yields accurate vehicle localization and viable performance. The proposed design is mainly based on a camera and a computer vision algorithm, which contributes to its low cost feature. This is an autonomous system for ground transport that excludes LIDAR and RADAR which could be an alternative to commonly used systems.
Title: A Review of Current Neuromorphic Approaches for Vision, Auditory, and Olfactory Sensors
URL: https://www.frontiersin.org/articles/10.3389/fnins.2016.00115/full
Key Words: Neuromorphic Approaches for Vision Sensors
Description: Conventional vision, auditory, and olfactory sensors generate large volumes of redundant data and as a result tend to consume excessive power. To address these shortcomings, neuromorphic sensors have been developed. This paper reviews the current state-of-the-art in neuromorphic implementation of vision, auditory, and olfactory sensors and identify key contributions across these fields. Bringing together these key contributions, the paper further suggests a future research direction for further development of the neuromorphic sensing field.
Patents:
Title: Autonomous driving sensing system and method
URL: https://patents.google.com/patent/US9720411B2/en
Key Words: Autonomous Vehicle Sensing and Control
Description: This patent illustrates the decision process of the perception system on an autonomous vehicle from an architectural perspective. It presents the process flow of action taken by the autonomous system based on environmental conditions detected by the sensors.
Title: Cross-validating sensors of an autonomous vehicle
URL: https://patents.google.com/patent/US9555740
Key Words: Cross-validating sensors
Description: This patent describes a cross validation system for sensors on autonomous vehicles created by Google. Data and information gathered by two sensors could be validated with each other in order to improve the functionality and reliability of the perception system. The two sensors do not have to be the same type of sensor. This is an important consideration for type and quantity of sensor adoption when designing a perception system.
Title: Modifying Behavior of Autonomous Vehicle Based on Advanced Predicted Behavior Analysis of Nearby Drivers
URL: https://patents.google.com/patent/US20180061237A1/en
Key Words: Modifying Behavior of Autonomous Vehicle
Description: This patent describes a system that assesses one or more features of drivers within a threshold distance of a self-driving vehicle using sensors. Based on the assessment, the system predicts the corresponding behavior of the respective vehicles to serve as feedback to the self-driving vehicle. Subsequent changes in the assessment can alert the self-driving vehicle to change course and the way it monitors data.
Technology Strategy Statement
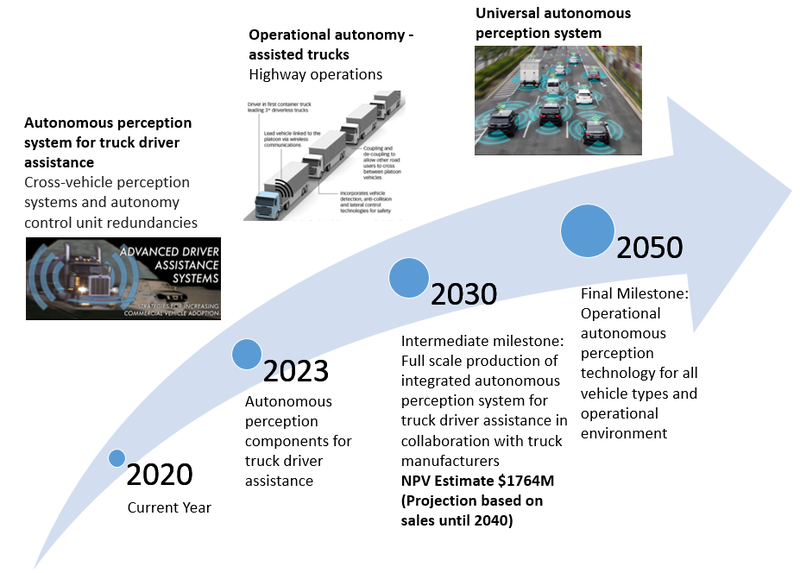
Our long term target is to develop a fully autonomous system for all ground transport systems by 2050 with a reliability performance of 1 intervention per 1015 miles . This final target requires significant technological breakthroughs along all broad key FOMs (Safety, Compatibility, Reliability and Cost). As such, we will focus on near term development milestones as part of our long term technology strategy.
In this key near term milestone, we target to develop advance driver-assistance system (ADAS) for the truck transportation industry, targeting both single and platoon truck transportation. This milestone has a realistic timeline with a viable business model. Through this milestone, we will be able to establish an operational test bed towards advanced autonomy while generating income for subsequent R&D. For this milestone, we will invest in two R&D projects. The first project will look at developing perception system across vehicles to enable platooning movements for the trucks. The second project will look at incorporating redundancies in autonomy control units. These R&D projects involve relatively mature technology components and will enable us to reach our goal by 2023 to begin integrating the technology onto truck fleets.
