Difference between revisions of "Inventory Management System"
| (76 intermediate revisions by 2 users not shown) | |||
| Line 1: | Line 1: | ||
Roadmap Creators: [https://www.linkedin.com/in/albert-youngjin-chun | Albert Chun] [https://www.linkedin.com/in/fmgroman/ | Matthew Guevarra Roman] | |||
Time Stamp: 5 December 2023 | |||
=Technology Roadmap= | =Technology Roadmap= | ||
==Roadmap Overview== | ==Roadmap Overview== | ||
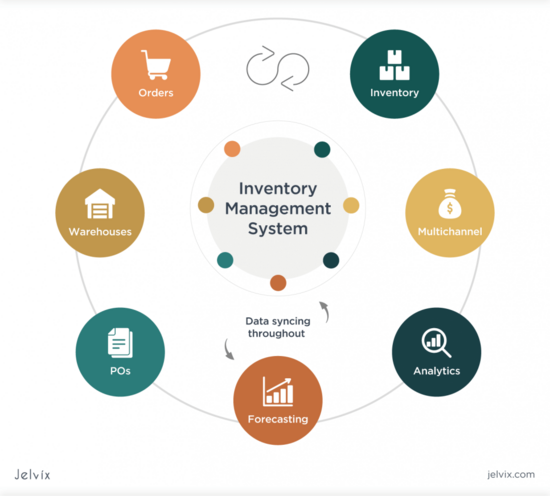
Inventory management system is a critical component of business operations' supply chain management that ensures efficient flows of materials and products from vendors to customers. | Inventory management system (IMS) is a critical component of business operations' supply chain management that ensures efficient flows of materials and products from vendors to customers. An effective inventory management system is essential for businesses to operate smoothly, reduce costs, optimize operations, and meet customer demands. It's a fundamental aspect of supply chain management, impacting various aspects of the business from profitability to customer satisfaction. | ||
Key Goals of | Key Goals of IMS are: | ||
* Providing timely, complete, and accurate inventory levels to managements | * Providing timely, complete, and accurate inventory levels to managements | ||
| Line 18: | Line 24: | ||
<br /> | <br /> | ||
Effective management systems provide the right products at the right time and place to meet growing customer demand. It is a critical aspect of modern business operations and plays a crucial role in achieving profitability and customer satisfaction. | Effective management systems provide the right products at the right time and place to meet growing customer demand. It is a critical aspect of modern business operations and plays a crucial role in achieving profitability and customer satisfaction. | ||
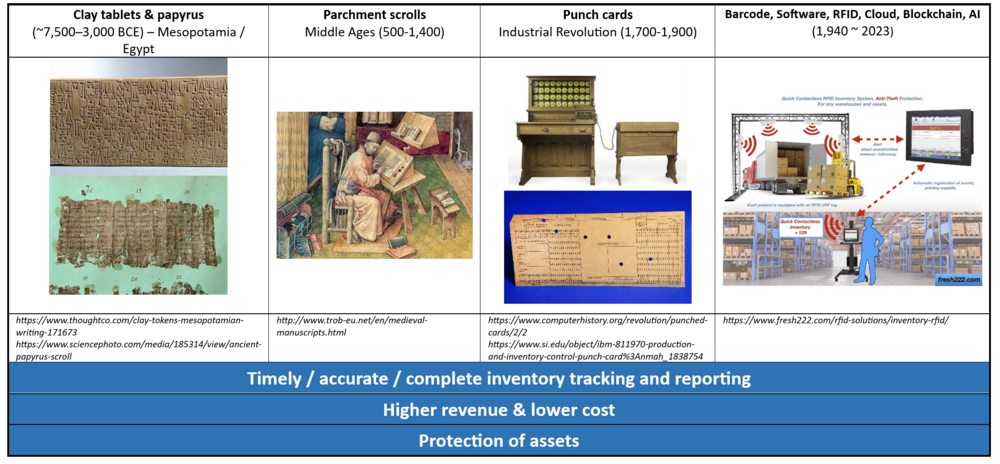
IMS can be traced back to ancient civilizations (e.g., Mesopotamia and Egypt), where traders and merchants used rudimentary ledger systems to keep track of their animals and products. Clay tablets and papyrus scrolls were used to record information about inventory levels, transactions, and trade. Over time, IMS developed into more accurate and complex systems for record keeping with the development of more rigorous accounting method, mass production of goods during Industrial Revolution and development of computers and software applications. | |||
[[File:Timeline_v2.png|1000px|frameless|center|]] | |||
[[File:Invt System Overview 2.png|550px|frameless|center|(https://jelvix.com/blog/automated-inventory-management-system]] | [[File:Invt System Overview 2.png|550px|frameless|center|(https://jelvix.com/blog/automated-inventory-management-system]] | ||
| Line 24: | Line 34: | ||
==Design Structure Matrix (DSM) Allocation== | ==Design Structure Matrix (DSM) Allocation== | ||
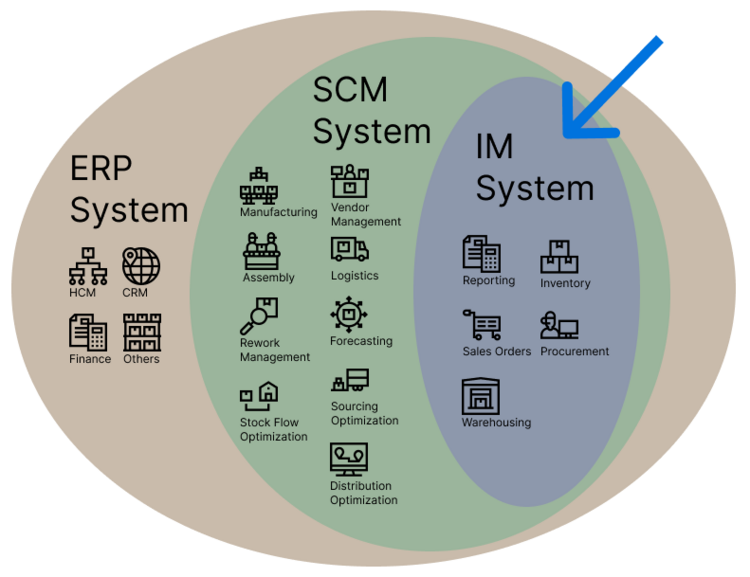
Positive and negative scope of an IM System as of publication of this roadmap. Figure shows that in Enterprise Resource Planning (ERP) and Supply Chain Management (SCM) systems, some modules can overlap with an IM System, however, wherein IM systems are purchased standalone, below are what is currently considered core IM modules. | |||
[[File:IMSScope.png|frameless|center|750px|Inventory Management System Scope]] | |||
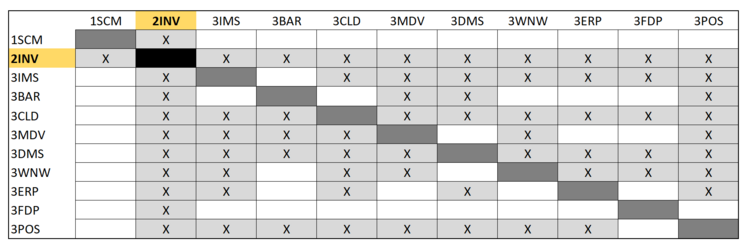
DSM of the Inventory Management System: | DSM of the Inventory Management System: | ||
| Line 29: | Line 44: | ||
[[File:DSM v1.png|frameless|center|750px|Inventory Management System DSM (under Supply Chain Management (SCM) System]] | [[File:DSM v1.png|frameless|center|750px|Inventory Management System DSM (under Supply Chain Management (SCM) System]] | ||
The tree structure of | The tree structure of the Inventory Management System. | ||
[[File:DSM List v1.png|frameless|center|600px|Inventory Management System]] | [[File:DSM List v1.png|frameless|center|600px|Inventory Management System]] | ||
| Line 36: | Line 51: | ||
This OPM represents the Inventory Management System: | This OPM represents the Inventory Management System: | ||
==Figures of Merit ( | [[File:Invt System OPM.png|900px|frameless|center]] | ||
The table below show a list of FOMs by which can assess a | |||
[[File:OPL 1.png|600px|frameless|center]] | |||
[[File:OPL 2.png|600px|frameless|center]] | |||
==Figures of Merit (FoM)== | |||
The table below show a list of FOMs by which can assess an Inventory Management System technology: | |||
[[File:FoM_Table_1.png|700px|frameless| center]] | |||
==== Examples of FOM performance ==== | |||
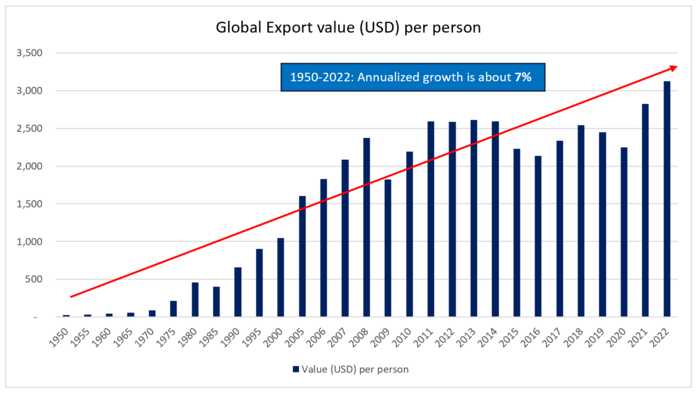
Over the last 52 years, inventory management system was improved by about 7% annualized growth based on the FoM trend indicated below: | |||
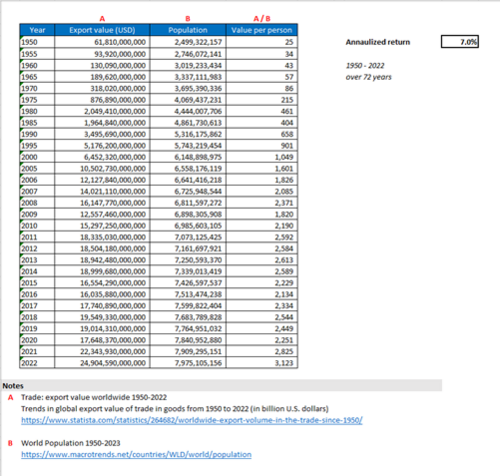
This is an indirect approach to track technological progress as there is only limited data available related to inventory variances, time to report, % automation, etc. This information is company specific and not generally publicly available. As such, we selected the Total trade (export) value (in USD) per person with two assumptions: (1) all reported “Trade (export) value” were processed and consolidated using supply chain management systems – included in the figure means that the transactions were recorded and processed; and (2) improvements in the system can be represented with fewer resources (people) needed to process and consolidate the same amount of data. Said differently, technological progress and rate of improvement can be supported by one person processing more transaction volumes. Note that year-over-year export values can be influenced by various economic statuses. | |||
[[File:FoM Trend 1.png|700px|frameless|center]] | |||
[[File:FoM Rate of Improvement Trade Value over population.png|500px|frameless|center|Global Export Value in USD vs. Total Global Population (1950-2022)]] | |||
==Company Strategic Objectives== | |||
Historically, FOMs of Inventory Management Systems were constrained by and therefore packaged with hardware components and their interconnectivity. Transaction storage, responsiveness of reports, and data access times mostly depended on the infrastructure platform it was being run. However, as cloud technologies have become the norm, wherein enterprise IMS systems now run off IaaS offerings and SMB IMS systems run as SaaS, hardware constraints have become virtually unlimited. Even with billions of records, Big Data platforms now exist that enable IMS reporting to be extremely capable. Because of this, FOMs for IMS have become business-centric instead of technology-centric. | |||
From an investment perspective, financial considerations focus on the Total Cost of Ownership (TCO) FoM, which could be decomposed into: license costs, deployment costs, servicing costs, support costs, training costs. TCO is often mapped at a 5-15 time horizon. | |||
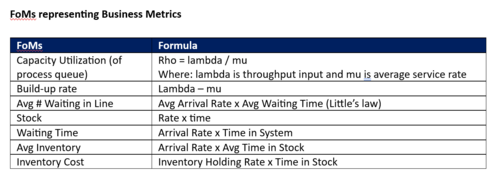
From an operational perspective, FoMs center around efficiency improvements enabled by the IMS. Such as “Time to process” wherein existing systems are compared to new proposed systems where they measure how much time it will take a processor (end-user) to complete the same process on the two systems. These processing efficiencies can be decomposed with standard queue analytics such as the ones below: | |||
[[File:FoMs and business drivers.png|thumb|500px|center]] | |||
{| class="wikitable" | {| class="wikitable" | ||
|- | |- | ||
! | ! Strategic Objective !! Alignment and Targets | ||
|- | |- | ||
| | | To develop a real-time cross-location inventory state management to make more timely business decisions. | ||
| | | We are targeting real-time inventory visibility and management across all branches with an SLO-driven response time of < 1 second. This visibility and control should be available from HQ to branch and branch to branch with proper management and permissions using an Identity Access Management system (IAM). | ||
|- | |- | ||
| | | To develop a stock flow management module with the ability to visualize historical and forecasted stock movements for more data-driven decisions. | ||
| | | Visibility and proactive pattern management of stock flow from warehouses, distribution centers, and branches. With improved IMS pattern recognition, we aim to lower cost of overage and underage of stock by 5% to give a return on switching costs. | ||
|- | |- | ||
| | | To enable our system to perform predictive analysis of our stock cycles to minimize holding and landed costs. | ||
| | | Lower holding and landed costs of products by 2% based on branch-level stock cycle monitoring as opposed to current-state consolidated stock cycle monitoring. | ||
|- | |- | ||
| | | To enable our system to timely identify correlation on stock demands and outages of complementary products to prevent stock shortage. | ||
| Identify correlation on stock demand and stock outages of complementary products with at least 60% accuracy. | |||
| | |||
|} | |} | ||
==== | ==Positioning of Company vs. Competition== | ||
[[File: | |||
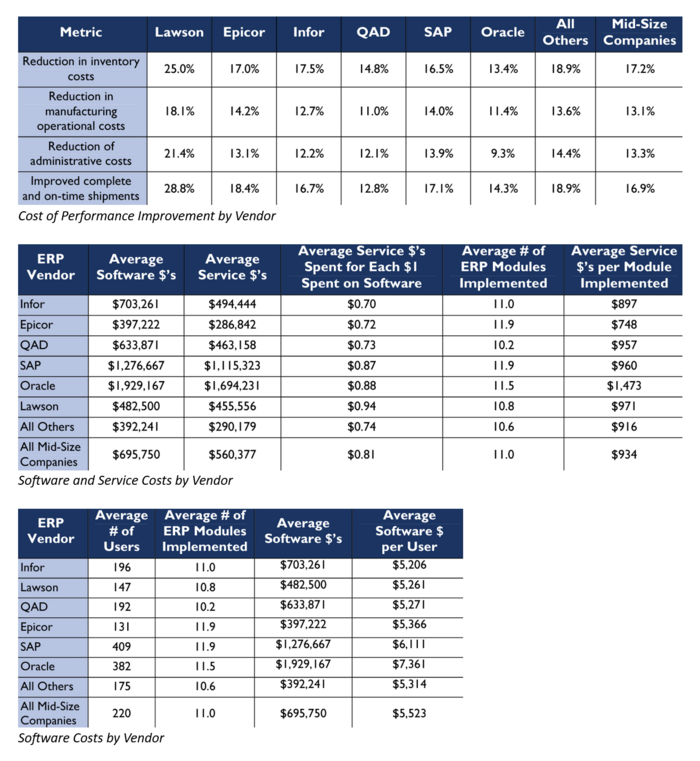
As mentioned above, FoMs that businesses look at when purchasing an IMS are not dependent on the raw technical capability of the technology but on it’s net impact in driving business metrics for the company’s operations. Such impact is measured in terms of queue and inventory analytics for operations and metrics for finance. Below are samples of such metrics measured in order to compare and contrast the competitive landscape of ERP IMS systems. | |||
[[File:Competitive Positions.png|thumb|700px|center]] | |||
Source: Aberdeen Group | |||
==Technical model== | |||
The following morphological model shows two primary options businesses face when implementing inventory management systems: cloud vs on-premise. | |||
Selecting the top 3 ERPs with Inventory Management Systems, we compared critical functionalities that customers need today from these IMS which not involve not just stock monitoring but stock flow management and forecasting. These functionalities are very dependent on connectivity, which we highlighted as a critical technological constraint above. | |||
We also showed the implementation and alternatives needed to implement such features based on cloud vs on-premise. | |||
[[File:Technical Model.png|700px|thumb|center]] | |||
==Financial model== | |||
For developing a new "Inventory Management System (IMS)", the development cost of $10MM will be spent in the first year to the following areas. Please note that the $ amounts herein are NPV demonstrative purpose only as there is a wide range of IMS's with limited public information available. | |||
[[File:FM1.png|800px|thumb|center|Summary of initial development costs]] | |||
[[File: FM2.png|800px|thumb|centre|right|DCF of expected cash flows]] | |||
[[File: FM3.png|800px|thumb|centre|right|DCF of expected cash flows]] | |||
==R&D Projects== | |||
Examples of R&D/R&T Project for Inventory Management: | |||
:a. AI-Powered Inventory Management - AI-powered system as a demonstrator project to predict inventory demand, taking into account factors such as historical sales data, seasonality, and market trends. The aim was to showcase the ability to reduce overstock and understock scenarios, thus optimizing inventory levels and reducing costs. | |||
:b. RFID-based Inventory Management - RFID (Radio Frequency Identification) system for inventory tracking and management. The system aimed to prove real-time visibility into inventory, improve tracking accuracy compared to traditional manual tracking methods, and offer precise data for better decision making. | |||
:c. IoT-based Cold Chain Management - cold chain logistics space implementation of an IoT-based inventory management system. The goal was to prove its potential in maintaining temperature consistency, predict equipment failures, and improving overall inventory quality control. | |||
:d. Blockchain for Supply Chain Transparency - implementation of a blockchain-based system providing transparency and traceability within the inventory management for sectors where chain-of-custoday tracking is critical, such as pharmaceuticals or food safety. | |||
:e. Autonomous Robots for Warehouse Management – introduction of autonomous mobile robots in a warehouse. Aimed to validate the advantages of automation in inventory management, like increased picking accuracy, safety, and efficiency. | |||
==Patents and papers== | |||
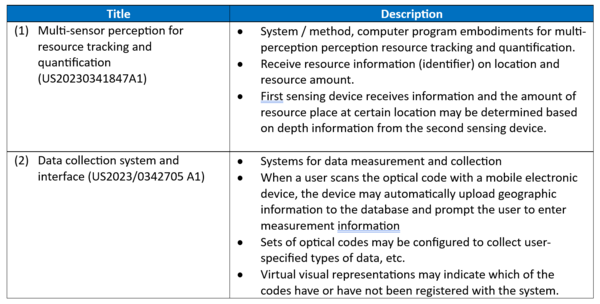
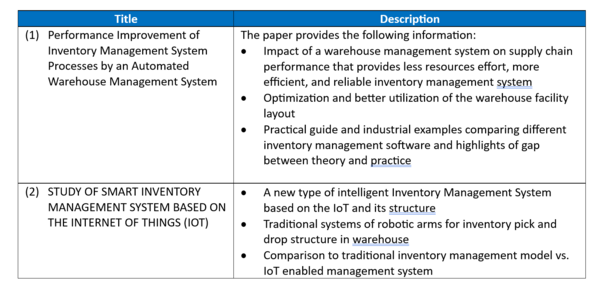
As inventory management system is a vital part of today’s supply chain management, there are vast number of publications and patents available: | |||
Extensive information is available pertaining to "payment systems": | |||
* 100,000+ “Inventory Management” results from Google Patents | |||
* 200,000+ “Inventory Management System” results from Google Scholar | |||
===Examples of patents:=== | |||
[[File:Patents.png|600px|thumb|center]] | |||
Source: | |||
*(1) https://image-ppubs.uspto.gov/dirsearch-public/print/downloadPdf/20230341847 | |||
*(2) https://image-ppubs.uspto.gov/dirsearch-public/print/downloadPdf/20230342705 | |||
===Examples of papers:=== | |||
[[File:Publication.png|600px|thumb|center]] | |||
<br /> | |||
Source: | |||
*(1) https://www.sciencedirect.com/science/article/pii/S2212827115012019 | |||
*(2) https://ejournal.lucp.net/index.php/ijrtbt/article/view/749 | |||
==Technology Strategy Statement== | |||
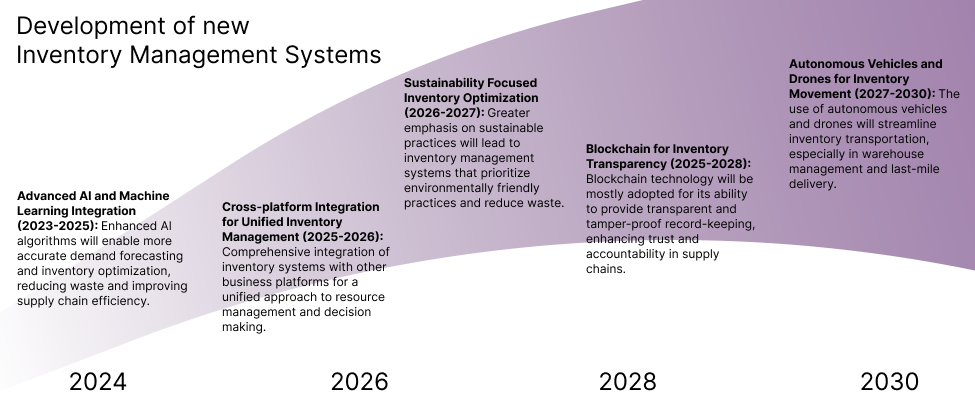
Inventory management systems will continue to evolve by integrating business technology advancements into their ecosystem of functionality. We project that IMS manufacturers will be more closely adopting newer versions of their software to better integrate with AI, Blockchain, and Autonomous Vehicles and Drones. Better integration with ERP systems will enable more ubiquitous inventory management across different systems and channels. Also, a drive in supply chain resiliency, efficiency, and sustainability will change how inventory systems operate as newer and better best practices are developed by management and supply chain researchers. | |||
[[File:IMS Swoosh.png|980px|thumb|center]] | |||
''Projected development of inventory management systems strategies from 2023 to 2030.'' | |||
Latest revision as of 01:35, 5 December 2023
Roadmap Creators: | Albert Chun | Matthew Guevarra Roman
Time Stamp: 5 December 2023
Technology Roadmap
Roadmap Overview
Inventory management system (IMS) is a critical component of business operations' supply chain management that ensures efficient flows of materials and products from vendors to customers. An effective inventory management system is essential for businesses to operate smoothly, reduce costs, optimize operations, and meet customer demands. It's a fundamental aspect of supply chain management, impacting various aspects of the business from profitability to customer satisfaction.
Key Goals of IMS are:
- Providing timely, complete, and accurate inventory levels to managements
- Minimizing carrying costs while ensuring product availability.
- Reducing stockouts and overstock situations.
- Enhancing supply chain visibility and responsiveness.
- Streamlining operations and reducing inefficiencies.
- Lowering costs while maintaining service levels.
- Meeting customer demand accurately and on time.
- Adapting to changes in demand, supply, and market conditions.
Effective management systems provide the right products at the right time and place to meet growing customer demand. It is a critical aspect of modern business operations and plays a crucial role in achieving profitability and customer satisfaction.
IMS can be traced back to ancient civilizations (e.g., Mesopotamia and Egypt), where traders and merchants used rudimentary ledger systems to keep track of their animals and products. Clay tablets and papyrus scrolls were used to record information about inventory levels, transactions, and trade. Over time, IMS developed into more accurate and complex systems for record keeping with the development of more rigorous accounting method, mass production of goods during Industrial Revolution and development of computers and software applications.
*image-source - https://jelvix.com/blog/automated-inventory-management-system
Design Structure Matrix (DSM) Allocation
Positive and negative scope of an IM System as of publication of this roadmap. Figure shows that in Enterprise Resource Planning (ERP) and Supply Chain Management (SCM) systems, some modules can overlap with an IM System, however, wherein IM systems are purchased standalone, below are what is currently considered core IM modules.
DSM of the Inventory Management System:
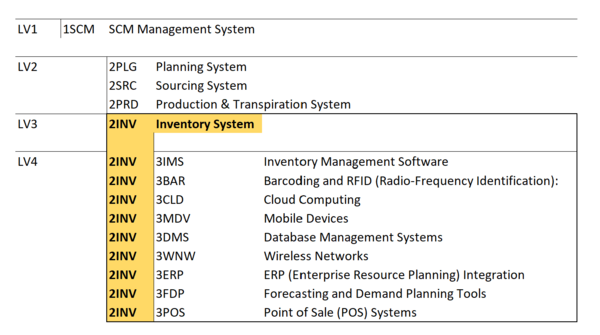
The tree structure of the Inventory Management System.
Object Process Model (OPM)
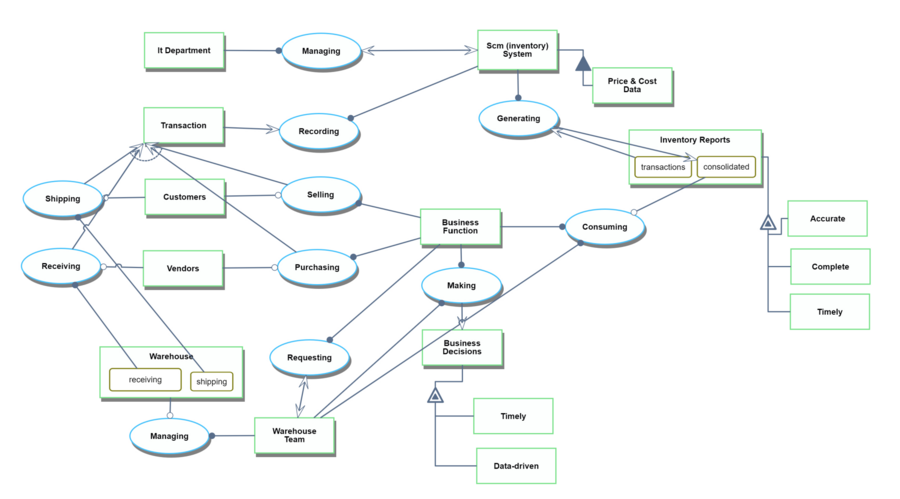
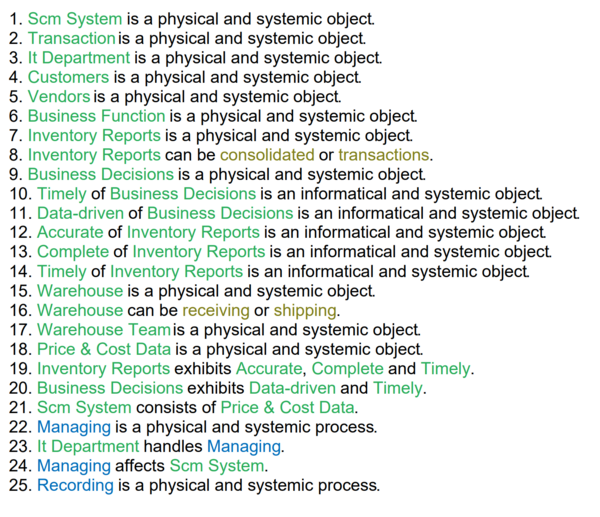
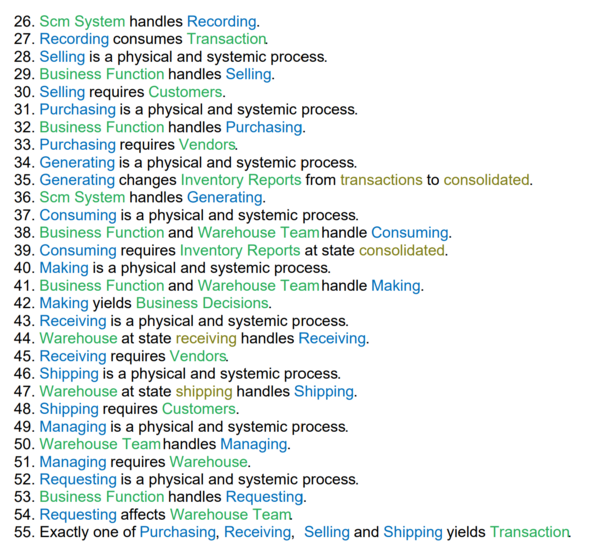
This OPM represents the Inventory Management System:
Figures of Merit (FoM)
The table below show a list of FOMs by which can assess an Inventory Management System technology:
Examples of FOM performance
Over the last 52 years, inventory management system was improved by about 7% annualized growth based on the FoM trend indicated below:
This is an indirect approach to track technological progress as there is only limited data available related to inventory variances, time to report, % automation, etc. This information is company specific and not generally publicly available. As such, we selected the Total trade (export) value (in USD) per person with two assumptions: (1) all reported “Trade (export) value” were processed and consolidated using supply chain management systems – included in the figure means that the transactions were recorded and processed; and (2) improvements in the system can be represented with fewer resources (people) needed to process and consolidate the same amount of data. Said differently, technological progress and rate of improvement can be supported by one person processing more transaction volumes. Note that year-over-year export values can be influenced by various economic statuses.
Company Strategic Objectives
Historically, FOMs of Inventory Management Systems were constrained by and therefore packaged with hardware components and their interconnectivity. Transaction storage, responsiveness of reports, and data access times mostly depended on the infrastructure platform it was being run. However, as cloud technologies have become the norm, wherein enterprise IMS systems now run off IaaS offerings and SMB IMS systems run as SaaS, hardware constraints have become virtually unlimited. Even with billions of records, Big Data platforms now exist that enable IMS reporting to be extremely capable. Because of this, FOMs for IMS have become business-centric instead of technology-centric.
From an investment perspective, financial considerations focus on the Total Cost of Ownership (TCO) FoM, which could be decomposed into: license costs, deployment costs, servicing costs, support costs, training costs. TCO is often mapped at a 5-15 time horizon.
From an operational perspective, FoMs center around efficiency improvements enabled by the IMS. Such as “Time to process” wherein existing systems are compared to new proposed systems where they measure how much time it will take a processor (end-user) to complete the same process on the two systems. These processing efficiencies can be decomposed with standard queue analytics such as the ones below:
| Strategic Objective | Alignment and Targets |
|---|---|
| To develop a real-time cross-location inventory state management to make more timely business decisions. | We are targeting real-time inventory visibility and management across all branches with an SLO-driven response time of < 1 second. This visibility and control should be available from HQ to branch and branch to branch with proper management and permissions using an Identity Access Management system (IAM). |
| To develop a stock flow management module with the ability to visualize historical and forecasted stock movements for more data-driven decisions. | Visibility and proactive pattern management of stock flow from warehouses, distribution centers, and branches. With improved IMS pattern recognition, we aim to lower cost of overage and underage of stock by 5% to give a return on switching costs. |
| To enable our system to perform predictive analysis of our stock cycles to minimize holding and landed costs. | Lower holding and landed costs of products by 2% based on branch-level stock cycle monitoring as opposed to current-state consolidated stock cycle monitoring. |
| To enable our system to timely identify correlation on stock demands and outages of complementary products to prevent stock shortage. | Identify correlation on stock demand and stock outages of complementary products with at least 60% accuracy.
|
Positioning of Company vs. Competition
As mentioned above, FoMs that businesses look at when purchasing an IMS are not dependent on the raw technical capability of the technology but on it’s net impact in driving business metrics for the company’s operations. Such impact is measured in terms of queue and inventory analytics for operations and metrics for finance. Below are samples of such metrics measured in order to compare and contrast the competitive landscape of ERP IMS systems.
Source: Aberdeen Group
Technical model
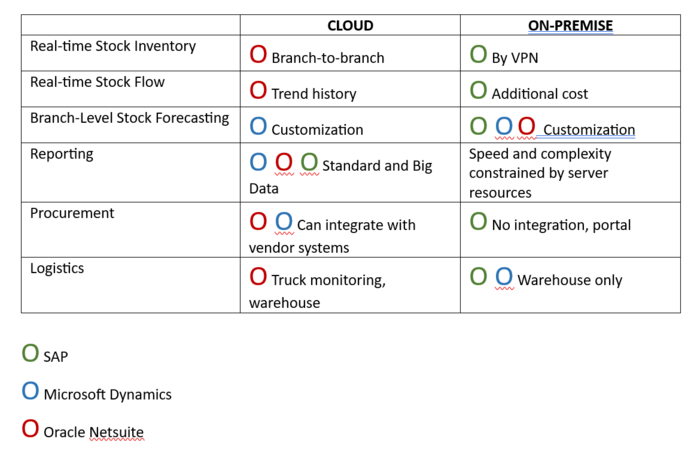
The following morphological model shows two primary options businesses face when implementing inventory management systems: cloud vs on-premise.
Selecting the top 3 ERPs with Inventory Management Systems, we compared critical functionalities that customers need today from these IMS which not involve not just stock monitoring but stock flow management and forecasting. These functionalities are very dependent on connectivity, which we highlighted as a critical technological constraint above.
We also showed the implementation and alternatives needed to implement such features based on cloud vs on-premise.
Financial model
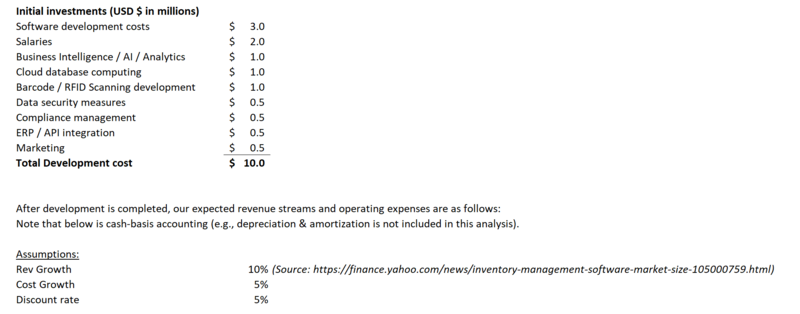
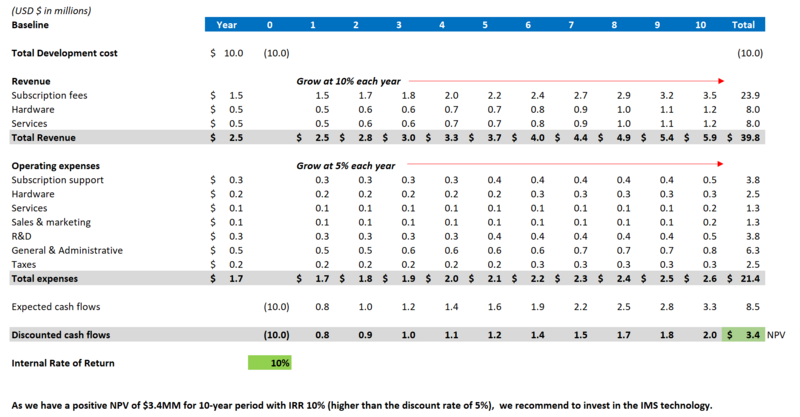
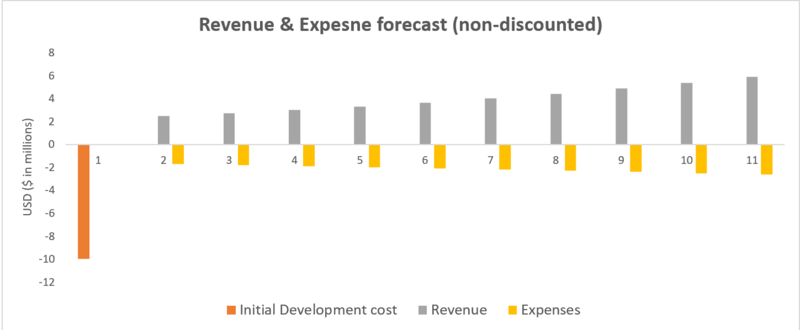
For developing a new "Inventory Management System (IMS)", the development cost of $10MM will be spent in the first year to the following areas. Please note that the $ amounts herein are NPV demonstrative purpose only as there is a wide range of IMS's with limited public information available.
R&D Projects
Examples of R&D/R&T Project for Inventory Management:
- a. AI-Powered Inventory Management - AI-powered system as a demonstrator project to predict inventory demand, taking into account factors such as historical sales data, seasonality, and market trends. The aim was to showcase the ability to reduce overstock and understock scenarios, thus optimizing inventory levels and reducing costs.
- b. RFID-based Inventory Management - RFID (Radio Frequency Identification) system for inventory tracking and management. The system aimed to prove real-time visibility into inventory, improve tracking accuracy compared to traditional manual tracking methods, and offer precise data for better decision making.
- c. IoT-based Cold Chain Management - cold chain logistics space implementation of an IoT-based inventory management system. The goal was to prove its potential in maintaining temperature consistency, predict equipment failures, and improving overall inventory quality control.
- d. Blockchain for Supply Chain Transparency - implementation of a blockchain-based system providing transparency and traceability within the inventory management for sectors where chain-of-custoday tracking is critical, such as pharmaceuticals or food safety.
- e. Autonomous Robots for Warehouse Management – introduction of autonomous mobile robots in a warehouse. Aimed to validate the advantages of automation in inventory management, like increased picking accuracy, safety, and efficiency.
Patents and papers
As inventory management system is a vital part of today’s supply chain management, there are vast number of publications and patents available: Extensive information is available pertaining to "payment systems":
- 100,000+ “Inventory Management” results from Google Patents
- 200,000+ “Inventory Management System” results from Google Scholar
Examples of patents:
Source:
- (1) https://image-ppubs.uspto.gov/dirsearch-public/print/downloadPdf/20230341847
- (2) https://image-ppubs.uspto.gov/dirsearch-public/print/downloadPdf/20230342705
Examples of papers:
Source:
- (1) https://www.sciencedirect.com/science/article/pii/S2212827115012019
- (2) https://ejournal.lucp.net/index.php/ijrtbt/article/view/749
Technology Strategy Statement
Inventory management systems will continue to evolve by integrating business technology advancements into their ecosystem of functionality. We project that IMS manufacturers will be more closely adopting newer versions of their software to better integrate with AI, Blockchain, and Autonomous Vehicles and Drones. Better integration with ERP systems will enable more ubiquitous inventory management across different systems and channels. Also, a drive in supply chain resiliency, efficiency, and sustainability will change how inventory systems operate as newer and better best practices are developed by management and supply chain researchers.
Projected development of inventory management systems strategies from 2023 to 2030.
