Difference between revisions of "Direct Air Capture"
| (2 intermediate revisions by one other user not shown) | |||
| Line 1: | Line 1: | ||
Roadmap Creators: [https://www.linkedin.com/in/ltgu// | Lukas Tacke Genannt Unterberg] [https://www.linkedin.com/in/ryota-wada-0a03068b/ | Ryota Wada] | |||
==Roadmap Overview== | ==Roadmap Overview== | ||
*Carbon Dioxide Removal | |||
Carbon capture, utilization and storage (CCUS) or carbon capture and storage (CCS) is the name given to the family of carbon removal technologies being developed to limit the negative climatic effects of greenhouse gas emissions. Today, over 35 Gt/year of carbon dioxide (CO2) are emitted from energy generation and industrial processes. The Intergovernmental Panel on Climate Change (IPCC) suggests that between 2 and 20 Gt/year of CO2 must be removed from the atmosphere to minimize climate change. | |||
CCUS consists of three distinct processes: Carbon capture, carbon transport, and carbon storage (or sequestration). Carbon capture is the chemical process of extracting a high purity CO2 stream from a mixed gas stream. Carbon capture techniques span a variety of liquid solvents, solid adsorbent, membranes, solid-looping, and inherent CO2 capture. Carbon capture can be applied to industrial processes such as natural gas processing, flue gas from coal or gas power plants, methane reformers, oxy-fuel, or cement plants to prevent CO2 venting to the atmosphere, as well as negative emission applications such as direct air capture (DAC) and direct ocean capture (DOC). | |||
*Direct Air Capture | |||
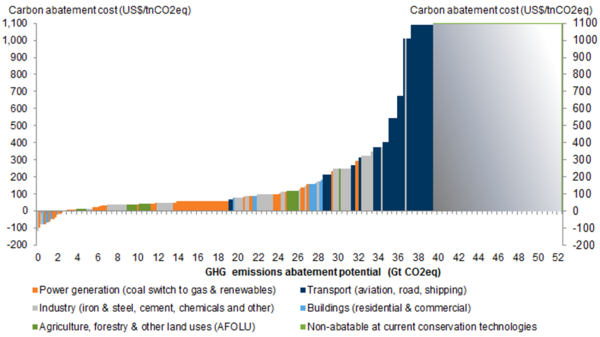
Direct air capture (DAC) is a negative emission technology for the direct removal of CO2 already in the Earth’s atmosphere. Figure 1 (Source 7) displays sources of carbon dioxide with their associated cost of abatement. It is apparent that certain CO2 sources are difficult to abate with point source capture methods; so an indirect and distributed CO2 capture method like DAC is used to offset the hard-to-abate emissions. | |||
[[File:My image21.png||left|600px]] | |||
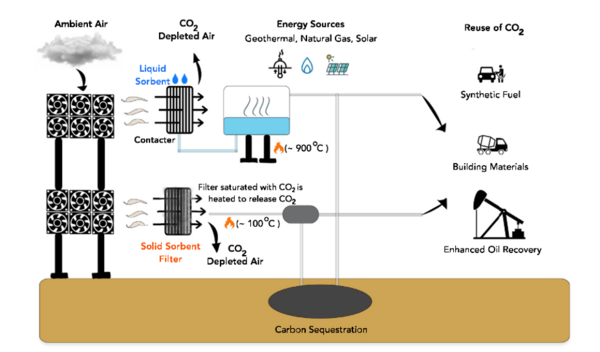
DAC describes an array of chemical reactions or absorption processes that separate CO2 from the air from the atmosphere. The process consists of three steps that are depicted in a high-level by Figure 2 (Source 6). First, the air is fan-forced into a sorbent. Then, the CO2 reacts with the sorbent. Lastly, the CO2 is detached from the sorbent by adding thermal or electric energy. | |||
Broadly, there two groups of DAC technology. On the one hand there are high-temperature, liquid sorbent processes, on the other hand, there are low-temperature, solid sorbent processes. Regardless of the technology used, the processes must be measured against the same dimensions. Suggested dimensions are cost, capture efficiency, water demand, energy demand and land demand. | |||
[[File:Roadmap Overview DAC2.png|left|600px]] | |||
==Design Structure Matrix (DSM) Allocation== | ==Design Structure Matrix (DSM) Allocation== | ||
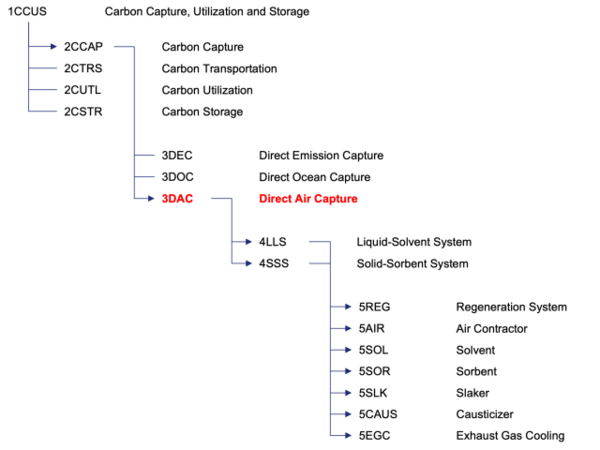
The DSM was created in the context of Carbon Capture, including DEC (Direct Emission Capture), DOC (Direct Ocean Capture), and DAC (Direct Air Capture). As the DSM shows sparse connections among the level-3 technologies, the technology will focus on DAC. The level-4 and level-5 technologies related to DAC are included in the DSM. At level-5, we see some interconnection between the liquid-solvent system and the solid-sorbent system. The tree highlights the key relationships in the DSM from level-1 CCUS to several level-5 technologies. | |||
[[File:DSM DAC.png|left|600px]] | |||
[[File:ClassificationTree DAC small.png|left|600px]] | |||
==Roadmap Model== | |||
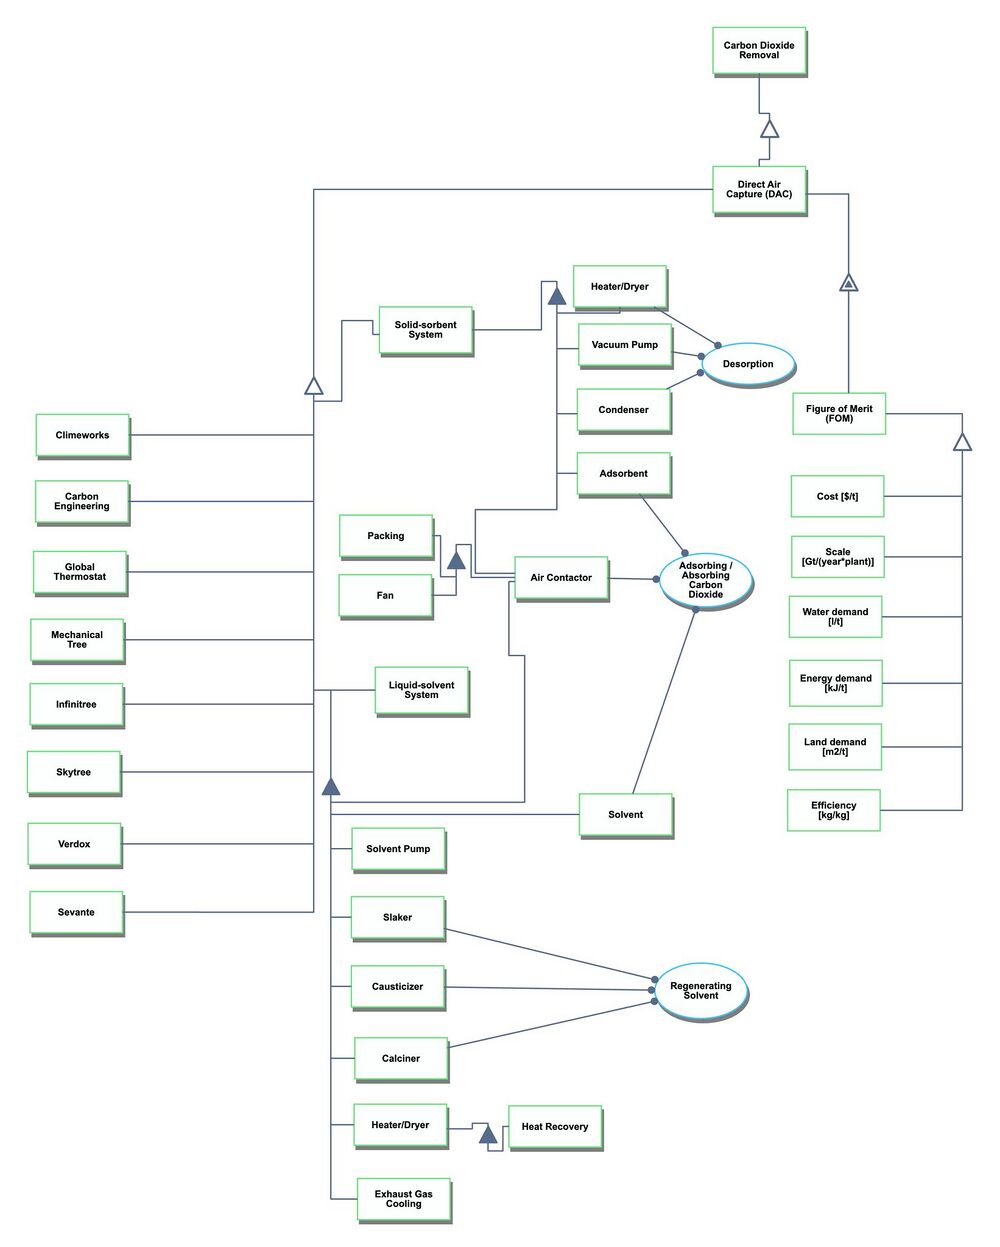
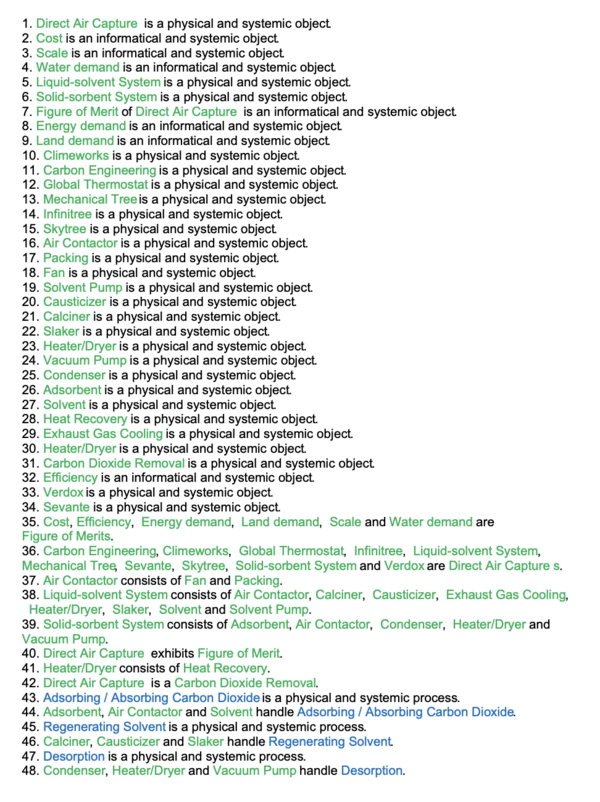
We provide an Object-Process-Diagram (OPD) of the DAC roadmap in the figure below. This OPD captures the main object of the roadmap (DAC technology), its main competitors, its decomposition into subsystems, its characterization by Figures of Merit (FOMs) as well as the main processes performed by the system. | |||
*OPD | |||
[[File:1642px-OPD DAC SD small.jpeg|left|1000px]] | |||
*OPL | |||
[[File:OPL_DAC.png|left|600px]] | |||
==Figures of Merit== | ==Figures of Merit== | ||
[[File: | *FOM Definitions | ||
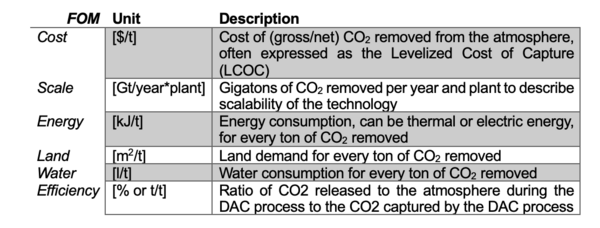
The table below shows a list of FOMs that are appropriate for the assessment of DAC technologies. | |||
[[File:FOM table DAC.png|left|600px]] | |||
*FOM trends | |||
CCUS markets vary geographically with a variety of emission trading schemes (ETS) (e.g., Australia), carbon taxes (e.g., European Union), and tax credits (e.g., US). In the US, the Inflation Reduction Act (IRA) provides a 45Q tax credit of $180/t for CO2 captured and stored using DAC. Currently, the levelized costs of capture (LCOC) for DAC nominally range between $200-$600/t. For DAC to be economic over the long term, consensus is that costs have to be reduced to $100/t or less on a gigaton scale by 2050. | |||
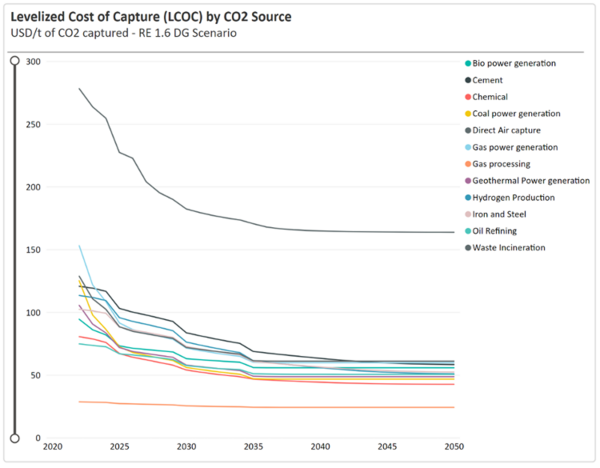
DAC is only just now emerging as an industry (rather than a scientific pursuit) thanks to the financial incentives of the IRA. With an industry only just starting to expand and scale plants from capacities of thousands of t/year to millions of t/year, today’s high LCOC is forecast to reduce over time with economies of scale. Rystad Energy have forecast LCOC for different CO2 sources; predicting a long-term LCOC of $160/t by 2035. The near exponential decline in LCOC is expected to be achieved through economies of scale of current technologies; a step change in LCOC will require further technical breakthroughs in DAC technologies. This is depicted by the Figure below. (Source 9) | |||
[[File:Cost trend DAC.png|left|600px]] | |||
==FOM targets== | |||
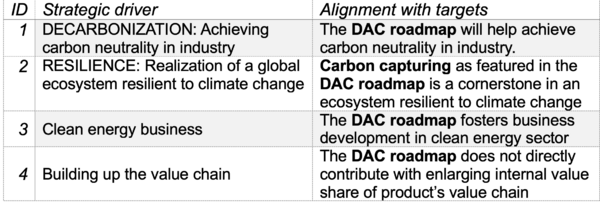
Table 1 illustrates our organization's strategic drivers and their respective alignment with the DAC roadmap. | |||
[[File:FOMAlignment.png|left|600px|Figure 1: Table illustrating roadmap alignment]] | |||
==FOM charts== | |||
The diagrams are notional but resemble different ways of how to illustrate the gap between the competitors and our organizations performance in a quantitative way. | |||
Figure 1 below illustrates the FOM tradeoffs of our and the competitors technology. | |||
[[File:ScaleVersusCost.png|left|600px]] | |||
Figure 2 below illustrates the carbon capture efficiency of our technology versus competitors. | |||
[[File:EfficiencyComparison.png|left|600px|Figure 2: Efficiency comparison]] | |||
Figure 3 below illustrates different technology and R&D strategies and the resulting technology position expressed with FOMs. | |||
[[File:ScenarioChart.png|left|600px|Figure 3: R&D Scenarios]] | |||
==Technical model== | |||
The technical model consists of a qualitative trade space model, investigating the solution and design trade space, and a quantitative FOM model. | |||
*Tradescpace model | |||
Figure 1 below illustrates the trade space of DAC technology. | |||
On the left, there are the different design/decision variables, that is in this case, components, materials, or energy sources. | |||
On the right, there are the different options available for each decision variable. This morphological model should be able to depict every feasible technology solution. | |||
However, not every combination of variables ultimately results in a feasible technology solution. | |||
[[File:Blanktradespace.png|left|600px|Figure 1: Morphological matrix]] | |||
Figure 2 illustrates a liquid-solvent system in the tradespace. | |||
[[File:Liquidtradespace2.png|left|600px|Figure 2: Liquid-Solvent tradespace]] | |||
Figure 3 below illustrates a solid-solvent system in the tradespace. | |||
[[File:Solidtradespace.png|left|600px|Figure 3: Solid-System Tradespace]] | |||
*Quantitative FOM model | |||
The technical model can be used to illustrate the impact of design choices and technological progress on the FOMs. | |||
In this case, a technical model was developed that describes a functional relation between components and the aggregated system performance. For this, existing literature delivered base values of energy consumption and carbon dioxide removal on a component level. Technological progress or design changes resulting from R&D activity are represented as increases in component efficiency. By this, the individual impact can be assessed and as such, the associated R&D project. | |||
The following figure showcases the underlying equations of the quantitative model. | |||
[[File:Quantequations.png|left|600px]] | |||
The figure below shows the liquid-solvent DAC system as a combination of the trade space model. Within, the different components with base case energy consumptions and carbon dioxide emissions are depicted both for natural gas and coal as an energy source. (Source 10) | |||
[[File:LS_Quantmodel.png|left|600px]] | |||
The following figure shows the same contents for solid-sorbent system. Unfortunately, only carbon dioxide emission base level values were apparent in the literature.(Source 10) | |||
[[File:SolidQuant.png|left|600px]] | |||
The model was implemented in Excel with the theoretical values of generic components. The screenshot below shows the implementation. | |||
[[File:ExcelScreen2.png|left|1000px]] | |||
Example of how to use the technical model: | |||
A R&D project proposal promises a reduced energy requirement from the heater /dryer component by 20% of a liquid-solvent DAC system. | |||
In the technical model, the component efficiency of the heater/dryer is changed from 1 (generic) to 0.8 (improved component) | |||
The new system level energy requirement is calculated and compared to the generic/base level performance level. | |||
The system energy requirement with generic component is 8.0005 GJ/t CO2 removed out of the atmosphere. Increasing the heater/dryer efficiency by the promised 20% yields a system energy requirement of 7.2505 GJ/t CO2 removed. That is a ceteris paribus reduction in system energy requirement of 9.4%. In terms of CO2 emission, the component efficiency increase yields a reduction from 0.7537 Mt/year (natural Gas) respective 1.0125 Mt/year (coal) to 0.6297 Mt/year (natural gas) respective 0.9295 Mt/year (coal). | |||
With this quantitative technical model further analysis is possible. One prominent example that is commonly used here is a sensitivity analysis of the impact. | |||
==Financial model== | |||
For the purpose of the finacial modelling, a delta-NPV was calculated for an exemplary R&D project with stochastic technological improvement. | |||
For this purpose, the technical model, described above, delivered the changes from R&D activity in operating cost based on energy consumption. | |||
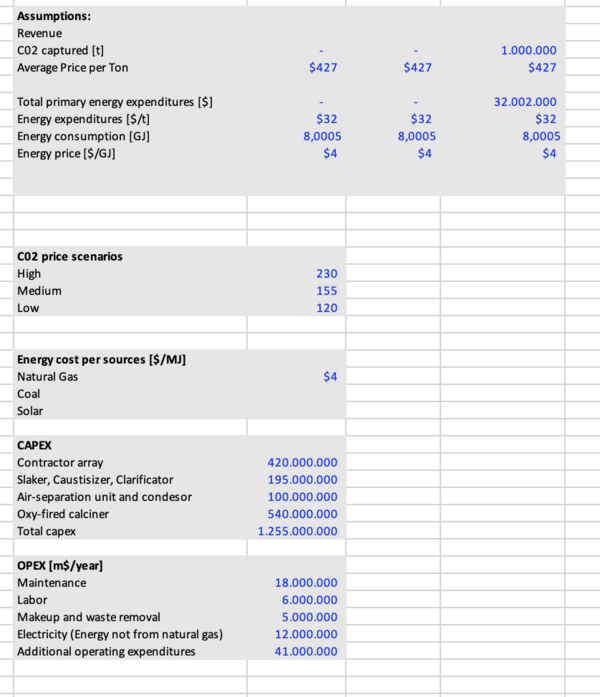
Assumptions of the model are depicted in the Screenshot below. | |||
[[File:AssumptionsDAC.png||left|600px]] | |||
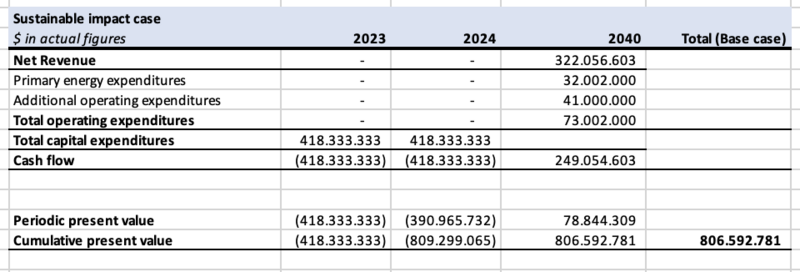
The following figure shows exemplary periods of the underlying business case. | |||
[[File:DACBusiness.png||left|800px]] | |||
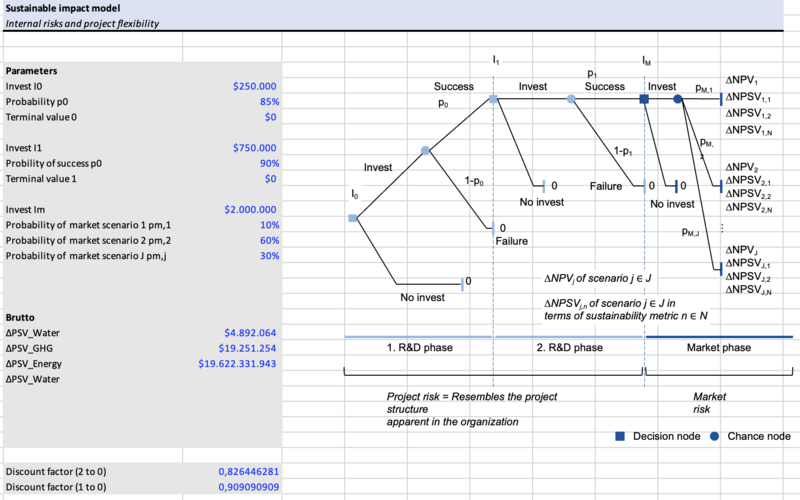
Besides modelling the business case, the internal project risk and flexibility was modelled with a decision tree. This decision tree and important parameters are depicted by the figure below. | |||
[[File:Decision tree.png||left|800px]] | |||
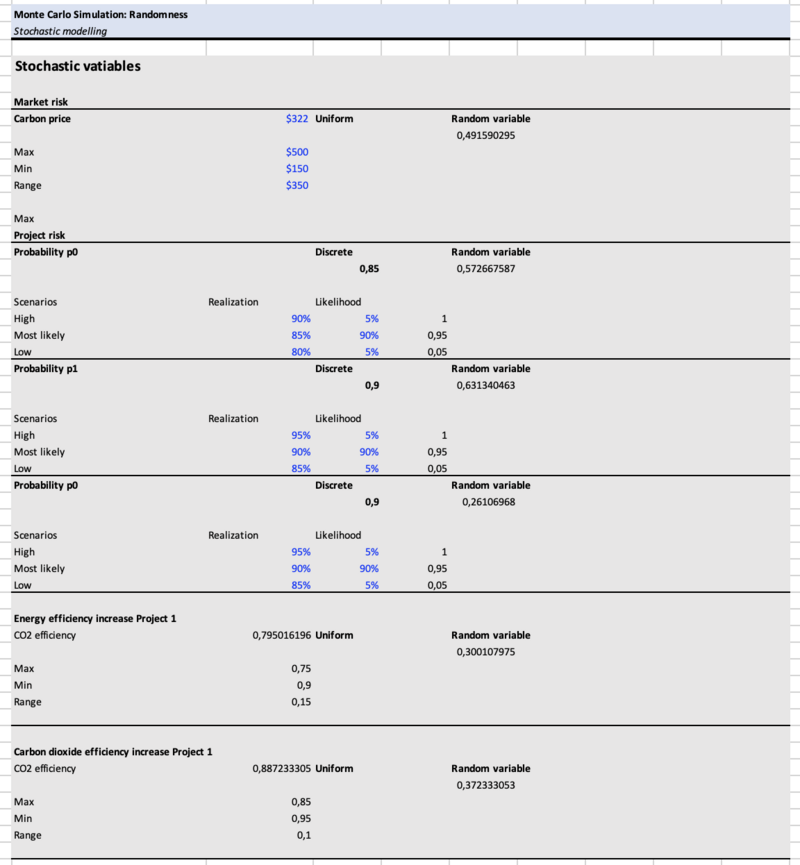
To account for market risk, but also internal risk, a Monte Carlo Simulation with stochastic calculation parameters was performed. | |||
The stochastic parameters as well as modelling results are depicted in the figures below. | |||
[[File:MonteCarloPara.png||left|800px]] | |||
[[File:MonteCarloResults.png||left|1200px]] | |||
Finally, for the selected R&D project, an expected delta-NPV of $934.649 was calculated. | |||
==List of R&D projects== | |||
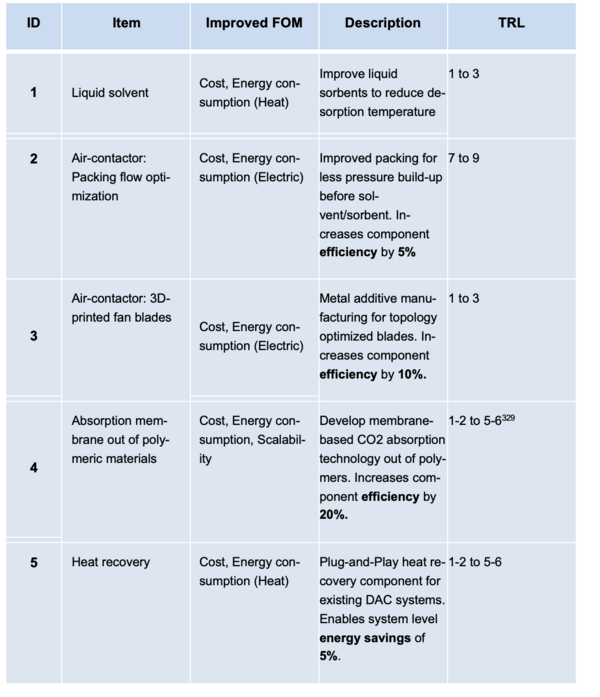
Figure 1 below illustrates an overview of potential R&D projects for the DAC roadmap. | |||
[[File:RDProjects.png|left|600px]] | |||
==Key Publications== | |||
*History: The basic technology of DAC originates from air purification technology used for submarines and spacecrafts, such as Major et al., 1965. The feasibility of direct air capture for the atmosphere was first explored by Lackner et al., 1999. | |||
**C. J. Major, B. J. Sollami, and Karl Kammermeyer, Industrial & Engineering Chemistry Process Design and Development 1965 4 (3), 327-333 DOI: 10.1021/i260015a019 | |||
**Lackner, K. S.; Ziock, H.; Grimes, P. Carbon Dioxide Extraction from Air: Is It an Option? InProceedings of the 24th Annual TechnicalConference on Coal Utilization&Fuel Systems, Clearwater, FL, 1999; pp 885−896. | |||
*Publications (Review articles): One of the key sources of publications is the International Energy Agency. This agency is a joint effort between Europe, the United States, Australia, New Zealand, Japan, and many more. The recently published report “Direct Air Capture – A key technology for net zero” introduces technology, legislative, and industry insights. Direct air capture is under investigation by many scholars and institutes. Some mentionable review publications that were published in the last three years are listed below. This is also used to organize the list of Publications (Current research trend): | |||
**Ozkan, M., Nayak, S. P., Ruiz, A. D., & Jiang, W. (2022). Current status and pillars of direct air capture technologies. Iscience. https://doi.org/10.1016/j.isci.2022.103990 | |||
**McQueen, N., Gomes, K. V., McCormick, C., Blumanthal, K., Pisciotta, M., & Wilcox, J. (2021). A review of direct air capture (DAC): scaling up commercial technologies and innovating for the future. Progress in Energy, 3(3), 032001. https://doi.org/10.1088/2516-1083/abf1ce | |||
**Zhu, X., Xie, W., Wu, J., Miao, Y., Xiang, C., Chen, C., ... & Wang, R. (2022). Recent advances in direct air capture by adsorption. Chemical Society Reviews. DOI: https://doi.org/10.1039/D1CS00970B | |||
**Abdullatif, Y., Sodiq, A., Mir, N., Bicer, Y., Al-Ansari, T., El-Naas, M. H., & Amhamed, A. I. (2023). Emerging trends in direct air capture of CO 2: a review of technology options targeting net-zero emissions. RSC advances, 13(9), 5687-5722. DOI https://doi.org/10.1039/D2RA07940B | |||
**Sodiq, A., Abdullatif, Y., Aissa, B., Ostovar, A., Nassar, N., El-Naas, M., & Amhamed, A. (2022). A review on progress made in direct air capture of CO2. Environmental Technology & Innovation, 102991. https://doi.org/10.1016/j.eti.2022.102991 | |||
**Zeeshan M, Kidder MK, Pentzer E, Getman RB and Gurkan B (2023) Direct air capture of CO2: from insights into the current and emerging approaches to future opportunities. Front. Sustain. 4:1167713. https://doi.org/10.3389/frsus.2023.1167713 | |||
*Patents: Patents have been filed by companies competing in the field of CDR/DAC technologies, such as Climeworks, Global Thermostat, and Carbon Engineering. | |||
**Climeworks AG holds several patents on DAC technology. The first patents issued from the U.S. government date back to 2011. First, Climeworks AG focused on integrated CO2 capturing systems for application in buildings before shifting the company’s focus on large scale DAC technology. More recently patented are technologies like a particle adsorbent bed or a vacuum chamber for a DAC device. [Link to patent overview] | |||
***Amine functionalized fibres for direct air capture: WO2023001810 | |||
***Direct air capture device: US10232305 | |||
***Atmospheric steam desorption for direct air capture: US20230173427 | |||
***Method and apparatus for direct air capture of carbon dioxide by using a solid polymeric support material functionalized with amino functionalities and the use of this material for carbon dioxide capture from air: EP4168156 | |||
***High throughput direct air capture device and method of its operation: US20220176310 | |||
***Improved materials for direct air capture and uses thereof: EP4263026 | |||
***Method for separating gaseous carbon dioxide from a gas mixture: WO2023104656 | |||
**Global Thermostat holds more than 35 patents worldwide on DAC technology. Patents on “Removing carbon dioxide from an atmosphere and global thermostat” covers the basic concept of direct air capture. They hold patents for solid adsorption process, efficient fans to blow air, proprietary contactors that bind to CO2, and others. | |||
***An improved system for direct air capture of carbon dioxide without movement: WO2022104252 | |||
***Rotating continuous multi-capture systems and apparatus for improved direct air capture of carbon dioxide (dac+): US20230023050 | |||
**Carbon Engineering filed a patent for “Carbon dioxide capture method and facility“ in 2009. To this day, the company makes use of technology protected by this very patent. They use a unique technology based on a potassium hydroxide solution to trap CO2. | |||
**Carbon Capture Inc. holds a patent regarding modular design of and adaptable carbon dioxide (CO2) capture, separation, and storage in a variety of disparate site locations. Some are introduced below. | |||
***Modular open systems architecture direct air capture platform: US11766636 | |||
***Continuous processes and systems to reduce energy requirements of using zeolites for carbon capture under humid conditions: US11738301 | |||
***Temperature vacuum swing adsorption process suited for carbon capture to regenerate sorbents using the co2 product gas as the heat transfer medium: US11654393 | |||
**Established oil companies own patents for DAC-related technology as well. ExxonMobil for example has a pending patent in a pressure swing adsorption process for separating CO2 from a feed gas mixture. | |||
**Some research has been patented by universities and research institutes | |||
***MIT: Electrochemically mediated gas capture, including from low concentration streams, Patent Number: US11598012, WO2021041732, etc., Inventors: Sahag Voskian, Trevor Alan Hatton | |||
***Arizona State University: System and method of water rejuvenation for the regeneration of sorbent filters, Patent Number: US20220119295, Inventors: Klaus Lackner | |||
***Microsoft Microsoft Technology Licensing, LLC: Cryogenic removal of carbon dioxide from the atmosphere, Patent Number: US20230314070, WO2023191963 | |||
*Publications (Current research trend): Some literature on the current research trend of DAC is listed below. | |||
**High-temperature aqueous solutions: The DAC absorption processes require chemical sorbents with strong CO2 binding affinities. Regeneration temperature is also critical for process efficiency. | |||
***Calcium hydroxide solution, Potassium hydroxide solution (adopted by Carbon Engineering): Keith et al., 2018 https://doi.org/10.1016/j.joule.2018.05.006 | |||
***Sodium hydroxide solution: Zeman, 2007 https://doi.org/10.1021/es070874m | |||
**Low-temperature solid sorbent solutions: adsorbent filters that have chemical functionality for CO2-philicity | |||
***Zeolites: Wilson and Tezel, 2020 https://doi.org/10.1021/acs.iecr.9b04803 | |||
***Amine-modified materials: Lu et al., 2013 https://doi.org/10.1021/jp311512q | |||
**Air contactor | |||
***Liquid-based: | |||
****Design for Carbon Engineering: Holmes and Keith, 2012 https://doi.org/10.1098/rsta.2012.0137 | |||
****Membrane based gas–liquid contactor: Favre and Svendsen, 2012 https://doi.org/10.1016/j.memsci.2012.03.019 | |||
***Solid-based | |||
****Fixed-bed contactor: Bajamundi et al., 2019 https://doi.org/10.1016/j.jcou.2019.02.002 | |||
****Moving-bed contactor: Yu and Brilman, 2020 https://doi.org/10.3390/app10031080 | |||
****Fiber contactor: Sujan et al., 2019 https://doi.org/10.1021/acssuschemeng.8b06203 | |||
****Monolith contactor: Sinha et al., 2017 https://doi.org/10.1021/acs.iecr.6b03887 | |||
==Technology strategy statement== | |||
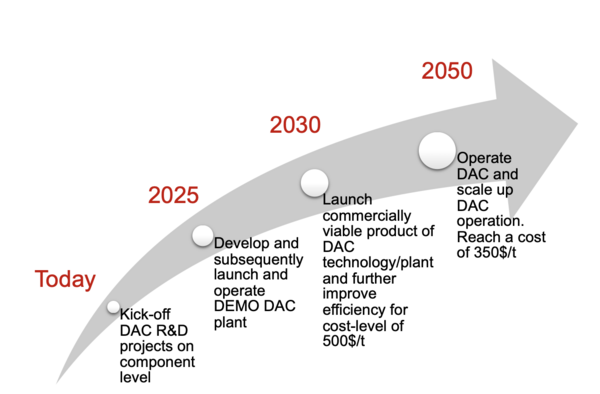
The primary objective of the DAC roadmap is to develop DAC technology that can operate on a significant scale. Thus far, extensive energy consumption and limited scalability hinder DAC from being a viable solution. With improved processes, materials and plant designs, DAC could contribute towards a net or near zero carbon dioxide emission future. For IHI, DAC enables the vision of a society that achieves growth without depending on fossil fuels. | |||
[[File:SwooshDAC.png||left|600px]] | |||
==References== | |||
#Deutz, Sarah, and André Bardow. 2021. “Life-Cycle Assessment of an Industrial Direct Air Capture Process Based on Temperature–Vacuum Swing Adsorption.” Nature Energy 6 (2): 203–13. https://doi.org/10.1038/s41560-020-00771-9. | |||
#Energy Agency, International. n.d. “Direct Air Capture: A Key Technology for Net Zero.” www.iea.org/t&c/. | |||
#“Growth Strategy Centered on Exploit and Evolution of LCB Thorough Business Structure Reform Capability of Realizing Transformation Resource Allocation and Management Targets.” n.d. | |||
#Jiang, L., W. Liu, R. Q. Wang, A. Gonzalez-Diaz, M. F. Rojas-Michaga, S. Michailos, M. Pourkashanian, X. J. Zhang, and C. Font-Palma. 2023. “Sorption Direct Air Capture with CO2 Utilization.” Progress in Energy and Combustion Science. Elsevier Ltd. https://doi.org/10.1016/j.pecs.2022.101069. | |||
#McQueen, Noah, Katherine Vaz Gomes, Colin McCormick, Katherine Blumanthal, Maxwell Pisciotta, and Jennifer Wilcox. 2021. “A Review of Direct Air Capture (DAC): Scaling up Commercial Technologies and Innovating for the Future.” Progress in Energy. Institute of Physics. https://doi.org/10.1088/2516-1083/abf1ce. | |||
#Ozkan, Mihrimah, Saswat Priyadarshi Nayak, Anthony D Ruiz, and Wenmei Jiang. 2022. “IScience Current Status and Pillars of Direct Air Capture Technologies.” ISCIENCE 25: 103990. https://doi.org/10.1016/j.isci. | |||
#“The Economics of Climate Change: A Primer.” n.d. Accessed August 20, 2023. https://www.gspublishing.com/content/research/en/reports/2020/01/19/c1bb0de3-ab5b-4713-b22c-4306415105cf.html. | |||
#Viebahn, Peter, Alexander Scholz, and Ole Zelt. 2019. “Entwicklungsstand Und Forschungsbedarf von Direct Air Capture: Ergebnis Einer Multidimensionalen Analyse.” Jg, 12. | |||
#Rystad Energy, CCUSCube, 2023 | |||
#Negative Emissions Technologies and Reliable Sequestration: A Research Agenda, 2019 | |||
[[ | [[Category:1M]] | ||
Latest revision as of 21:06, 7 January 2024
Roadmap Creators: | Lukas Tacke Genannt Unterberg | Ryota Wada
Roadmap Overview
- Carbon Dioxide Removal
Carbon capture, utilization and storage (CCUS) or carbon capture and storage (CCS) is the name given to the family of carbon removal technologies being developed to limit the negative climatic effects of greenhouse gas emissions. Today, over 35 Gt/year of carbon dioxide (CO2) are emitted from energy generation and industrial processes. The Intergovernmental Panel on Climate Change (IPCC) suggests that between 2 and 20 Gt/year of CO2 must be removed from the atmosphere to minimize climate change.
CCUS consists of three distinct processes: Carbon capture, carbon transport, and carbon storage (or sequestration). Carbon capture is the chemical process of extracting a high purity CO2 stream from a mixed gas stream. Carbon capture techniques span a variety of liquid solvents, solid adsorbent, membranes, solid-looping, and inherent CO2 capture. Carbon capture can be applied to industrial processes such as natural gas processing, flue gas from coal or gas power plants, methane reformers, oxy-fuel, or cement plants to prevent CO2 venting to the atmosphere, as well as negative emission applications such as direct air capture (DAC) and direct ocean capture (DOC).
- Direct Air Capture
Direct air capture (DAC) is a negative emission technology for the direct removal of CO2 already in the Earth’s atmosphere. Figure 1 (Source 7) displays sources of carbon dioxide with their associated cost of abatement. It is apparent that certain CO2 sources are difficult to abate with point source capture methods; so an indirect and distributed CO2 capture method like DAC is used to offset the hard-to-abate emissions.
DAC describes an array of chemical reactions or absorption processes that separate CO2 from the air from the atmosphere. The process consists of three steps that are depicted in a high-level by Figure 2 (Source 6). First, the air is fan-forced into a sorbent. Then, the CO2 reacts with the sorbent. Lastly, the CO2 is detached from the sorbent by adding thermal or electric energy.
Broadly, there two groups of DAC technology. On the one hand there are high-temperature, liquid sorbent processes, on the other hand, there are low-temperature, solid sorbent processes. Regardless of the technology used, the processes must be measured against the same dimensions. Suggested dimensions are cost, capture efficiency, water demand, energy demand and land demand.
Design Structure Matrix (DSM) Allocation
The DSM was created in the context of Carbon Capture, including DEC (Direct Emission Capture), DOC (Direct Ocean Capture), and DAC (Direct Air Capture). As the DSM shows sparse connections among the level-3 technologies, the technology will focus on DAC. The level-4 and level-5 technologies related to DAC are included in the DSM. At level-5, we see some interconnection between the liquid-solvent system and the solid-sorbent system. The tree highlights the key relationships in the DSM from level-1 CCUS to several level-5 technologies.
Roadmap Model
We provide an Object-Process-Diagram (OPD) of the DAC roadmap in the figure below. This OPD captures the main object of the roadmap (DAC technology), its main competitors, its decomposition into subsystems, its characterization by Figures of Merit (FOMs) as well as the main processes performed by the system.
- OPD
- OPL
Figures of Merit
- FOM Definitions
The table below shows a list of FOMs that are appropriate for the assessment of DAC technologies.
- FOM trends
CCUS markets vary geographically with a variety of emission trading schemes (ETS) (e.g., Australia), carbon taxes (e.g., European Union), and tax credits (e.g., US). In the US, the Inflation Reduction Act (IRA) provides a 45Q tax credit of $180/t for CO2 captured and stored using DAC. Currently, the levelized costs of capture (LCOC) for DAC nominally range between $200-$600/t. For DAC to be economic over the long term, consensus is that costs have to be reduced to $100/t or less on a gigaton scale by 2050.
DAC is only just now emerging as an industry (rather than a scientific pursuit) thanks to the financial incentives of the IRA. With an industry only just starting to expand and scale plants from capacities of thousands of t/year to millions of t/year, today’s high LCOC is forecast to reduce over time with economies of scale. Rystad Energy have forecast LCOC for different CO2 sources; predicting a long-term LCOC of $160/t by 2035. The near exponential decline in LCOC is expected to be achieved through economies of scale of current technologies; a step change in LCOC will require further technical breakthroughs in DAC technologies. This is depicted by the Figure below. (Source 9)
FOM targets
Table 1 illustrates our organization's strategic drivers and their respective alignment with the DAC roadmap.
FOM charts
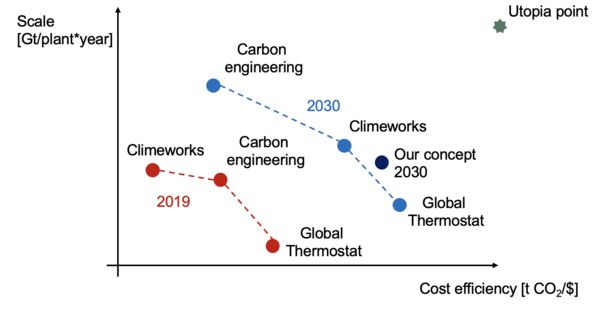
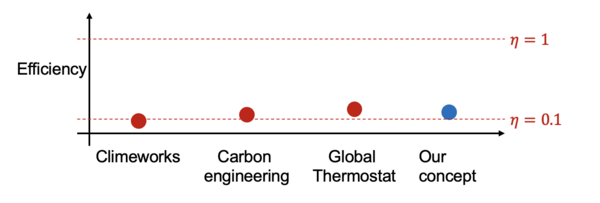
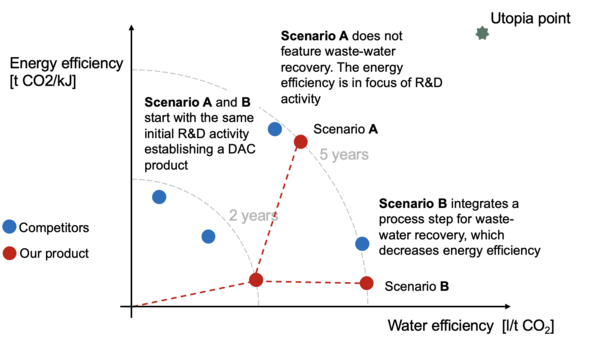
The diagrams are notional but resemble different ways of how to illustrate the gap between the competitors and our organizations performance in a quantitative way.
Figure 1 below illustrates the FOM tradeoffs of our and the competitors technology.
Figure 2 below illustrates the carbon capture efficiency of our technology versus competitors.
Figure 3 below illustrates different technology and R&D strategies and the resulting technology position expressed with FOMs.
Technical model
The technical model consists of a qualitative trade space model, investigating the solution and design trade space, and a quantitative FOM model.
- Tradescpace model
Figure 1 below illustrates the trade space of DAC technology. On the left, there are the different design/decision variables, that is in this case, components, materials, or energy sources. On the right, there are the different options available for each decision variable. This morphological model should be able to depict every feasible technology solution. However, not every combination of variables ultimately results in a feasible technology solution.
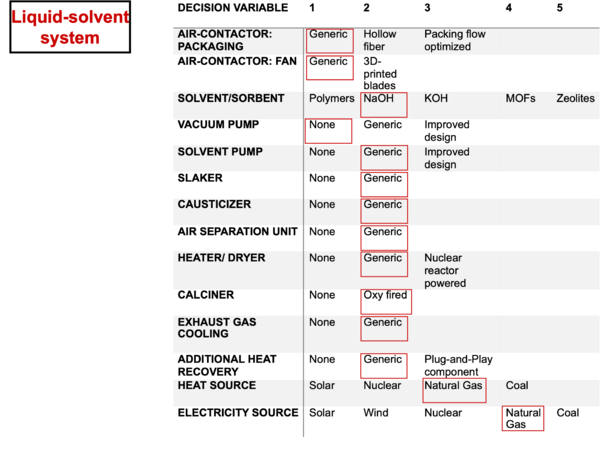
Figure 2 illustrates a liquid-solvent system in the tradespace.
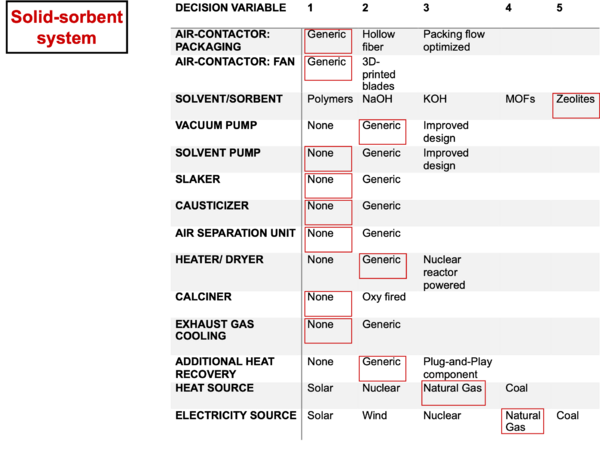
Figure 3 below illustrates a solid-solvent system in the tradespace.
- Quantitative FOM model
The technical model can be used to illustrate the impact of design choices and technological progress on the FOMs.
In this case, a technical model was developed that describes a functional relation between components and the aggregated system performance. For this, existing literature delivered base values of energy consumption and carbon dioxide removal on a component level. Technological progress or design changes resulting from R&D activity are represented as increases in component efficiency. By this, the individual impact can be assessed and as such, the associated R&D project.
The following figure showcases the underlying equations of the quantitative model.
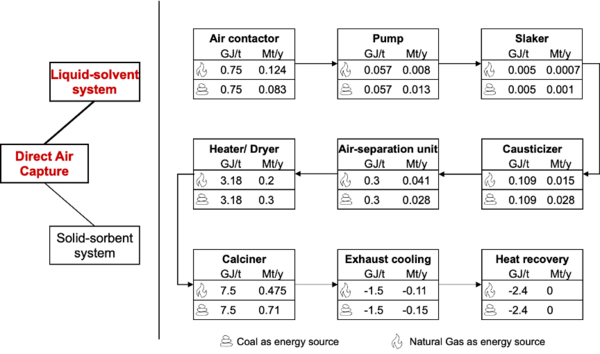
The figure below shows the liquid-solvent DAC system as a combination of the trade space model. Within, the different components with base case energy consumptions and carbon dioxide emissions are depicted both for natural gas and coal as an energy source. (Source 10)
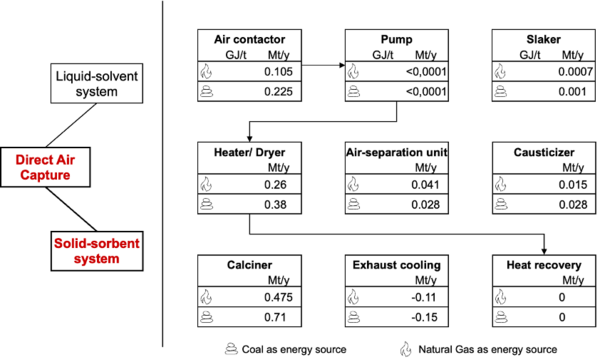
The following figure shows the same contents for solid-sorbent system. Unfortunately, only carbon dioxide emission base level values were apparent in the literature.(Source 10)
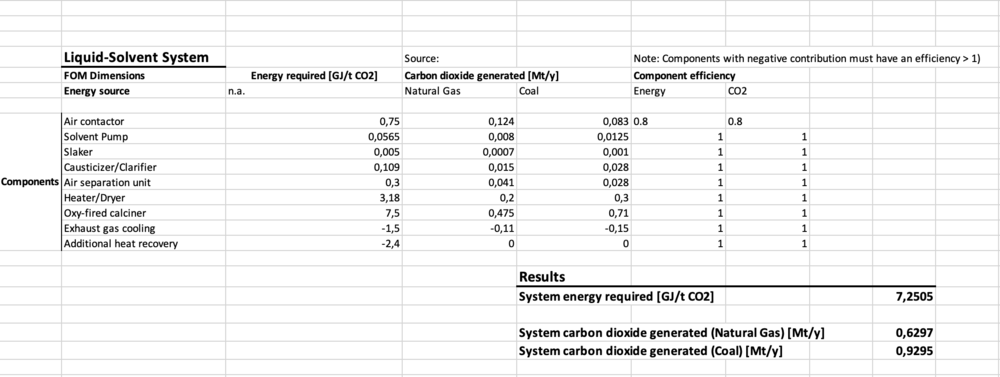
The model was implemented in Excel with the theoretical values of generic components. The screenshot below shows the implementation.
Example of how to use the technical model:
A R&D project proposal promises a reduced energy requirement from the heater /dryer component by 20% of a liquid-solvent DAC system. In the technical model, the component efficiency of the heater/dryer is changed from 1 (generic) to 0.8 (improved component) The new system level energy requirement is calculated and compared to the generic/base level performance level.
The system energy requirement with generic component is 8.0005 GJ/t CO2 removed out of the atmosphere. Increasing the heater/dryer efficiency by the promised 20% yields a system energy requirement of 7.2505 GJ/t CO2 removed. That is a ceteris paribus reduction in system energy requirement of 9.4%. In terms of CO2 emission, the component efficiency increase yields a reduction from 0.7537 Mt/year (natural Gas) respective 1.0125 Mt/year (coal) to 0.6297 Mt/year (natural gas) respective 0.9295 Mt/year (coal).
With this quantitative technical model further analysis is possible. One prominent example that is commonly used here is a sensitivity analysis of the impact.
Financial model
For the purpose of the finacial modelling, a delta-NPV was calculated for an exemplary R&D project with stochastic technological improvement. For this purpose, the technical model, described above, delivered the changes from R&D activity in operating cost based on energy consumption. Assumptions of the model are depicted in the Screenshot below.
The following figure shows exemplary periods of the underlying business case.
Besides modelling the business case, the internal project risk and flexibility was modelled with a decision tree. This decision tree and important parameters are depicted by the figure below.
To account for market risk, but also internal risk, a Monte Carlo Simulation with stochastic calculation parameters was performed. The stochastic parameters as well as modelling results are depicted in the figures below.
Finally, for the selected R&D project, an expected delta-NPV of $934.649 was calculated.
List of R&D projects
Figure 1 below illustrates an overview of potential R&D projects for the DAC roadmap.
Key Publications
- History: The basic technology of DAC originates from air purification technology used for submarines and spacecrafts, such as Major et al., 1965. The feasibility of direct air capture for the atmosphere was first explored by Lackner et al., 1999.
- C. J. Major, B. J. Sollami, and Karl Kammermeyer, Industrial & Engineering Chemistry Process Design and Development 1965 4 (3), 327-333 DOI: 10.1021/i260015a019
- Lackner, K. S.; Ziock, H.; Grimes, P. Carbon Dioxide Extraction from Air: Is It an Option? InProceedings of the 24th Annual TechnicalConference on Coal Utilization&Fuel Systems, Clearwater, FL, 1999; pp 885−896.
- Publications (Review articles): One of the key sources of publications is the International Energy Agency. This agency is a joint effort between Europe, the United States, Australia, New Zealand, Japan, and many more. The recently published report “Direct Air Capture – A key technology for net zero” introduces technology, legislative, and industry insights. Direct air capture is under investigation by many scholars and institutes. Some mentionable review publications that were published in the last three years are listed below. This is also used to organize the list of Publications (Current research trend):
- Ozkan, M., Nayak, S. P., Ruiz, A. D., & Jiang, W. (2022). Current status and pillars of direct air capture technologies. Iscience. https://doi.org/10.1016/j.isci.2022.103990
- McQueen, N., Gomes, K. V., McCormick, C., Blumanthal, K., Pisciotta, M., & Wilcox, J. (2021). A review of direct air capture (DAC): scaling up commercial technologies and innovating for the future. Progress in Energy, 3(3), 032001. https://doi.org/10.1088/2516-1083/abf1ce
- Zhu, X., Xie, W., Wu, J., Miao, Y., Xiang, C., Chen, C., ... & Wang, R. (2022). Recent advances in direct air capture by adsorption. Chemical Society Reviews. DOI: https://doi.org/10.1039/D1CS00970B
- Abdullatif, Y., Sodiq, A., Mir, N., Bicer, Y., Al-Ansari, T., El-Naas, M. H., & Amhamed, A. I. (2023). Emerging trends in direct air capture of CO 2: a review of technology options targeting net-zero emissions. RSC advances, 13(9), 5687-5722. DOI https://doi.org/10.1039/D2RA07940B
- Sodiq, A., Abdullatif, Y., Aissa, B., Ostovar, A., Nassar, N., El-Naas, M., & Amhamed, A. (2022). A review on progress made in direct air capture of CO2. Environmental Technology & Innovation, 102991. https://doi.org/10.1016/j.eti.2022.102991
- Zeeshan M, Kidder MK, Pentzer E, Getman RB and Gurkan B (2023) Direct air capture of CO2: from insights into the current and emerging approaches to future opportunities. Front. Sustain. 4:1167713. https://doi.org/10.3389/frsus.2023.1167713
- Patents: Patents have been filed by companies competing in the field of CDR/DAC technologies, such as Climeworks, Global Thermostat, and Carbon Engineering.
- Climeworks AG holds several patents on DAC technology. The first patents issued from the U.S. government date back to 2011. First, Climeworks AG focused on integrated CO2 capturing systems for application in buildings before shifting the company’s focus on large scale DAC technology. More recently patented are technologies like a particle adsorbent bed or a vacuum chamber for a DAC device. [Link to patent overview]
- Amine functionalized fibres for direct air capture: WO2023001810
- Direct air capture device: US10232305
- Atmospheric steam desorption for direct air capture: US20230173427
- Method and apparatus for direct air capture of carbon dioxide by using a solid polymeric support material functionalized with amino functionalities and the use of this material for carbon dioxide capture from air: EP4168156
- High throughput direct air capture device and method of its operation: US20220176310
- Improved materials for direct air capture and uses thereof: EP4263026
- Method for separating gaseous carbon dioxide from a gas mixture: WO2023104656
- Global Thermostat holds more than 35 patents worldwide on DAC technology. Patents on “Removing carbon dioxide from an atmosphere and global thermostat” covers the basic concept of direct air capture. They hold patents for solid adsorption process, efficient fans to blow air, proprietary contactors that bind to CO2, and others.
- An improved system for direct air capture of carbon dioxide without movement: WO2022104252
- Rotating continuous multi-capture systems and apparatus for improved direct air capture of carbon dioxide (dac+): US20230023050
- Carbon Engineering filed a patent for “Carbon dioxide capture method and facility“ in 2009. To this day, the company makes use of technology protected by this very patent. They use a unique technology based on a potassium hydroxide solution to trap CO2.
- Carbon Capture Inc. holds a patent regarding modular design of and adaptable carbon dioxide (CO2) capture, separation, and storage in a variety of disparate site locations. Some are introduced below.
- Modular open systems architecture direct air capture platform: US11766636
- Continuous processes and systems to reduce energy requirements of using zeolites for carbon capture under humid conditions: US11738301
- Temperature vacuum swing adsorption process suited for carbon capture to regenerate sorbents using the co2 product gas as the heat transfer medium: US11654393
- Established oil companies own patents for DAC-related technology as well. ExxonMobil for example has a pending patent in a pressure swing adsorption process for separating CO2 from a feed gas mixture.
- Some research has been patented by universities and research institutes
- MIT: Electrochemically mediated gas capture, including from low concentration streams, Patent Number: US11598012, WO2021041732, etc., Inventors: Sahag Voskian, Trevor Alan Hatton
- Arizona State University: System and method of water rejuvenation for the regeneration of sorbent filters, Patent Number: US20220119295, Inventors: Klaus Lackner
- Microsoft Microsoft Technology Licensing, LLC: Cryogenic removal of carbon dioxide from the atmosphere, Patent Number: US20230314070, WO2023191963
- Climeworks AG holds several patents on DAC technology. The first patents issued from the U.S. government date back to 2011. First, Climeworks AG focused on integrated CO2 capturing systems for application in buildings before shifting the company’s focus on large scale DAC technology. More recently patented are technologies like a particle adsorbent bed or a vacuum chamber for a DAC device. [Link to patent overview]
- Publications (Current research trend): Some literature on the current research trend of DAC is listed below.
- High-temperature aqueous solutions: The DAC absorption processes require chemical sorbents with strong CO2 binding affinities. Regeneration temperature is also critical for process efficiency.
- Calcium hydroxide solution, Potassium hydroxide solution (adopted by Carbon Engineering): Keith et al., 2018 https://doi.org/10.1016/j.joule.2018.05.006
- Sodium hydroxide solution: Zeman, 2007 https://doi.org/10.1021/es070874m
- Low-temperature solid sorbent solutions: adsorbent filters that have chemical functionality for CO2-philicity
- Zeolites: Wilson and Tezel, 2020 https://doi.org/10.1021/acs.iecr.9b04803
- Amine-modified materials: Lu et al., 2013 https://doi.org/10.1021/jp311512q
- Air contactor
- Liquid-based:
- Design for Carbon Engineering: Holmes and Keith, 2012 https://doi.org/10.1098/rsta.2012.0137
- Membrane based gas–liquid contactor: Favre and Svendsen, 2012 https://doi.org/10.1016/j.memsci.2012.03.019
- Solid-based
- Fixed-bed contactor: Bajamundi et al., 2019 https://doi.org/10.1016/j.jcou.2019.02.002
- Moving-bed contactor: Yu and Brilman, 2020 https://doi.org/10.3390/app10031080
- Fiber contactor: Sujan et al., 2019 https://doi.org/10.1021/acssuschemeng.8b06203
- Monolith contactor: Sinha et al., 2017 https://doi.org/10.1021/acs.iecr.6b03887
- Liquid-based:
- High-temperature aqueous solutions: The DAC absorption processes require chemical sorbents with strong CO2 binding affinities. Regeneration temperature is also critical for process efficiency.
Technology strategy statement
The primary objective of the DAC roadmap is to develop DAC technology that can operate on a significant scale. Thus far, extensive energy consumption and limited scalability hinder DAC from being a viable solution. With improved processes, materials and plant designs, DAC could contribute towards a net or near zero carbon dioxide emission future. For IHI, DAC enables the vision of a society that achieves growth without depending on fossil fuels.
References
- Deutz, Sarah, and André Bardow. 2021. “Life-Cycle Assessment of an Industrial Direct Air Capture Process Based on Temperature–Vacuum Swing Adsorption.” Nature Energy 6 (2): 203–13. https://doi.org/10.1038/s41560-020-00771-9.
- Energy Agency, International. n.d. “Direct Air Capture: A Key Technology for Net Zero.” www.iea.org/t&c/.
- “Growth Strategy Centered on Exploit and Evolution of LCB Thorough Business Structure Reform Capability of Realizing Transformation Resource Allocation and Management Targets.” n.d.
- Jiang, L., W. Liu, R. Q. Wang, A. Gonzalez-Diaz, M. F. Rojas-Michaga, S. Michailos, M. Pourkashanian, X. J. Zhang, and C. Font-Palma. 2023. “Sorption Direct Air Capture with CO2 Utilization.” Progress in Energy and Combustion Science. Elsevier Ltd. https://doi.org/10.1016/j.pecs.2022.101069.
- McQueen, Noah, Katherine Vaz Gomes, Colin McCormick, Katherine Blumanthal, Maxwell Pisciotta, and Jennifer Wilcox. 2021. “A Review of Direct Air Capture (DAC): Scaling up Commercial Technologies and Innovating for the Future.” Progress in Energy. Institute of Physics. https://doi.org/10.1088/2516-1083/abf1ce.
- Ozkan, Mihrimah, Saswat Priyadarshi Nayak, Anthony D Ruiz, and Wenmei Jiang. 2022. “IScience Current Status and Pillars of Direct Air Capture Technologies.” ISCIENCE 25: 103990. https://doi.org/10.1016/j.isci.
- “The Economics of Climate Change: A Primer.” n.d. Accessed August 20, 2023. https://www.gspublishing.com/content/research/en/reports/2020/01/19/c1bb0de3-ab5b-4713-b22c-4306415105cf.html.
- Viebahn, Peter, Alexander Scholz, and Ole Zelt. 2019. “Entwicklungsstand Und Forschungsbedarf von Direct Air Capture: Ergebnis Einer Multidimensionalen Analyse.” Jg, 12.
- Rystad Energy, CCUSCube, 2023
- Negative Emissions Technologies and Reliable Sequestration: A Research Agenda, 2019
