Difference between revisions of "Battery Electric Vehicle Platforms"
| (23 intermediate revisions by 2 users not shown) | |||
| Line 1: | Line 1: | ||
Roadmap Creators: [https://www.linkedin.com/in/michaelpeters2015/ Michael Peters], [https://www.linkedin.com/in/hiroki-ogasawara/ Hiro Ogasawara], [https://www.linkedin.com/in/piyushkumbhare/ Piyush Kumbhare] | |||
Time Stamp: 5 December 2023 | |||
=Technology Roadmap Sections and Deliverables= | =Technology Roadmap Sections and Deliverables= | ||
| Line 53: | Line 57: | ||
| '''Vehicle charge rate''' || [km/min] || The rate at which vehicle range (in km) is added to the BEV platform during charging | | '''Vehicle charge rate''' || [km/min] || The rate at which vehicle range (in km) is added to the BEV platform during charging | ||
|- | |- | ||
| Power Storage Cost || [$/kWh] || Total cost of power storage within a BEV platform (at the battery pack level) in dollars per kilowatt | | '''Power Storage Cost''' || [$/kWh] || Total cost of power storage within a BEV platform (at the battery pack level) in dollars per kilowatt | ||
|- | |- | ||
| Carbon Dioxide Emissions || [g/km] || The total amount of carbon dioxide emissions generated by the vehicle platform per mile driven | | Carbon Dioxide Emissions || [g/km] || The total amount of carbon dioxide emissions generated by the vehicle platform per mile driven | ||
|- | |- | ||
|} | |} | ||
Note: Key FOM's are highlighted in '''bold text''' | |||
Below are some trends related to the figures of merit listed above. The charts show that the range of battery vehicles has been steadily increasing over the past decade, all while battery prices have rapidly declined. Both of these factors have contributed to increasing adoption of battery electric vehicle platforms, as the cost and performance of these systems continue to rise. Finally, charging trends are improving substantially, as new technology around superchargers enters the market (on both the BEV platform and charging station sides of the interface). | Below are some trends related to the figures of merit listed above. The charts show that the range of battery vehicles has been steadily increasing over the past decade, all while battery prices have rapidly declined. Both of these factors have contributed to increasing adoption of battery electric vehicle platforms, as the cost and performance of these systems continue to rise. Finally, charging trends are improving substantially, as new technology around superchargers enters the market (on both the BEV platform and charging station sides of the interface). | ||
[[File:FOM trends | [[File:FOM trends 4.jpg|1400px]] | ||
In addition to the figures of merit shown above, some of the key governing equations for battery electric vehicles are shown below. | In addition to the figures of merit shown above, some of the key governing equations for battery electric vehicles are shown below. | ||
| Line 109: | Line 115: | ||
The images and table below show examples of other battery electric vehicle platforms available on the market today (or previously available on the market) along with representative data points for key figures of merit that BEV platforms are evaluated upon (data compiled from evspecifications.com [11]). | The images and table below show examples of other battery electric vehicle platforms available on the market today (or previously available on the market) along with representative data points for key figures of merit that BEV platforms are evaluated upon (data compiled from evspecifications.com [11]). | ||
[[File:BEV Vehicles.png|1300px|center]] | [[File:BEV Vehicles 2.png|1300px|center]] | ||
{| class="wikitable sortable" style="margin-left: auto; margin-right: auto; border: none;" | {| class="wikitable sortable" style="margin-left: auto; margin-right: auto; border: none;" | ||
| Line 134: | Line 140: | ||
|- | |- | ||
| Hyundai || IONIQ || 2023 || 581 || 77 || 5.1 || 25.8 || 350 || Dual Electric Motors | | Hyundai || IONIQ || 2023 || 581 || 77 || 5.1 || 25.8 || 350 || Dual Electric Motors | ||
|- | |||
| BYD || Qin plus EV Pilot Diamond Type || 2023 || 610 || 72 || 3.8 || 20.3 || 250 || Dual Electric Motors | |||
|- | |- | ||
|} | |} | ||
| Line 139: | Line 147: | ||
Below is a graph of range [km] vs vehicle charging rate [km/min] for the BEV platforms listed in the table above. This chart illustrates how the pareto front of BEV platform performance has shifted over time as it relates to the key FOM's of range and charging rate. In the bottom left of the chart, there is a cluster of early mass-production BEV platforms such as the Nissan Leaf and the Chevy Spark. In the middle of the chart, we see current-day BEV platforms such as the Chevy Bolt and BMW i5 M60. Towards the upper right side of the chart, we see a high-performing group of current-day BEV platforms in the Tesla Model S (performance), the Lucid Air, and the Hyundai Ioniq. This group of high-performing current-day mass production BEV platforms form the pareto front for existing advancement in BEV platform technology (Data from references [5], [6], and [7]). | Below is a graph of range [km] vs vehicle charging rate [km/min] for the BEV platforms listed in the table above. This chart illustrates how the pareto front of BEV platform performance has shifted over time as it relates to the key FOM's of range and charging rate. In the bottom left of the chart, there is a cluster of early mass-production BEV platforms such as the Nissan Leaf and the Chevy Spark. In the middle of the chart, we see current-day BEV platforms such as the Chevy Bolt and BMW i5 M60. Towards the upper right side of the chart, we see a high-performing group of current-day BEV platforms in the Tesla Model S (performance), the Lucid Air, and the Hyundai Ioniq. This group of high-performing current-day mass production BEV platforms form the pareto front for existing advancement in BEV platform technology (Data from references [5], [6], and [7]). | ||
[[File:BEV Pareto.jpg|750px|center]] | [[File:BEV Pareto v3.jpg|750px|center]] | ||
This chart also shows how specific manufacturers have improved the performance of their technology over time, and what tradeoffs they have made in doing so. For example, General Motors (parent company of the brand Chevrolet) made significant improvements in vehicle range between their 2014 Chevy Spark and their 2023 Chevy Bolt. However, they made only marginal improvements in the performance of vehicle charging rate. On the other hand, Tesla made considerable improvements in both of these areas between their 2012 version of the Tesla Model S and their 2023 Tesla Model S (performance edition). It is also interesting to note that companies like Tesla truly appear to be pushing the Pareto front forward with their latest BEV platforms. They had the most advanced platform on the road when they introduced the model S in 2012, and the latest version of this BEV platform is also near the edge of the pareto front. | This chart also shows how specific manufacturers have improved the performance of their technology over time, and what tradeoffs they have made in doing so. For example, General Motors (parent company of the brand Chevrolet) made significant improvements in vehicle range between their 2014 Chevy Spark and their 2023 Chevy Bolt. However, they made only marginal improvements in the performance of vehicle charging rate. On the other hand, Tesla made considerable improvements in both of these areas between their 2012 version of the Tesla Model S and their 2023 Tesla Model S (performance edition). It is also interesting to note that companies like Tesla truly appear to be pushing the Pareto front forward with their latest BEV platforms. They had the most advanced platform on the road when they introduced the model S in 2012, and the latest version of this BEV platform is also near the edge of the pareto front. | ||
| Line 170: | Line 178: | ||
[[File:BEV | [[File:BEV Tornado2.png|700px]] | ||
==Financial Model== | ==Financial Model== | ||
The figure below shows the financial model for the introduction of the all-new BEV platform. The model contains the R&D expenditure over the next 9 years to engineer a platform and three vehicles to support 2 of our 5 critical R&D projects - introduction of the sodium ion battery chemistry, and the modularization of the battery pack. The R&D expenditure is anticipated to improve the vehicles based on the customer's request after the three models are released. | The figure below shows the financial model for the introduction of the all-new BEV platform. The model contains the R&D expenditure over the next 9 years to engineer a platform and three vehicles to support 2 of our 5 critical R&D projects - introduction of the sodium ion battery chemistry, and the modularization of the battery pack. The R&D expenditure is anticipated to improve the vehicles based on the customer's request after the three models are released. | ||
The model also contains the expected revenue over time for vehicle sales, as well as the cost associated with vehicle sales. Our expectation is that we will slowly ramp production over a period of years from 10,000 units per year to 1,016,000 units sold per year, which is the same number of sales of Toyota RAV4 in 2022. The model charts the discounted revenue and discounted costs over time, which can then be used to calculate yearly discounted free cash flow and our net present value | The model also contains the expected revenue over time for vehicle sales, as well as the cost associated with vehicle sales. Our expectation is that we will slowly ramp production over a period of years from 10,000 units per year to 1,016,000 units sold per year, which is the same number of sales of Toyota RAV4 in 2022. The platform is completed in year 3 and model A, B, and C are launched in year 5, 7, and 8. The model charts the discounted revenue and discounted costs over time, which can then be used to calculate yearly discounted free cash flow and our net present value. | ||
[[File: | [[File:BEV_Financial_Model_Figure2.png|600px]] | ||
The table below contains the details behind the financial model shown above. As shown in the table, as production ramps, so does our revenue and cost. The three models are sold at the price of $22,500, $31,500, and $40,500 respectively. | The table below contains the details behind the financial model shown above. As shown in the table, as production ramps, so does our revenue and cost. The three models are sold at the price of $22,500, $31,500, and $40,500 respectively. | ||
| Line 184: | Line 192: | ||
Additionally, working capital per sales is expected to be 13.4%, the industrial average. | Additionally, working capital per sales is expected to be 13.4%, the industrial average. | ||
Also shown in the table below is the time required to recover our investment and manufacturing cost. According to our analyses, it will take approximately | Also shown in the table below is the time required to recover our investment and manufacturing cost. According to our analyses, it will take approximately 16 years (11 years after the first model is launched) to break even and begin profiting from the production of our all-new BEV platform. This is a high cost of introduction, but we expect that as we scale, we will gain a permanent foothold in the EV market and will see increased profitability in the years following the introduction of this initial BEV platform. The total PV of the project is $14,001 million. | ||
[[File: | [[File:BEV_Financial_Model_Table2.png|1200px]] | ||
==List of R&D Projects and Prototypes== | ==List of R&D Projects and Prototypes== | ||
| Line 194: | Line 202: | ||
{| class="wikitable sortable" style="margin-left: auto; margin-right: auto; border: none; width: 80%;" | {| class="wikitable sortable" style="margin-left: auto; margin-right: auto; border: none; width: 80%;" | ||
|- | |- | ||
! R&D Project !! Technology Area !! Description !! Benefits !! Challenges !! Investment Decision | ! R&D Project !! Technology Area & TRL!! Description !! Benefits !! Challenges !! Investment Decision | ||
|- | |- | ||
| Sodium-ion battery technology infusion [13] || Battery Technology || This project will focus on infusing existing technology around sodium ion based battery cells into our existing battery pack module design. || | | Sodium-ion battery technology infusion [13] || Battery Technology (TRL 7) || This project will focus on infusing existing technology around sodium ion based battery cells into our existing battery pack module design. || | ||
* Sodium is far more abundant than the lithium that is used in our battery cells today | * Sodium is far more abundant than the lithium that is used in our battery cells today | ||
* The cost of sodium is significantly less than lithium, allowing us to bring down the cost of our battery pack module | * The cost of sodium is significantly less than lithium, allowing us to bring down the cost of our battery pack module | ||
| Line 203: | Line 211: | ||
|| Yes | || Yes | ||
|- | |- | ||
| Modularization of battery pack design || Platform Modularity || This project will focus on redefining our battery pack design to make it more modular. As opposed to having one large battery pack, we will create several battery pack modules that can be combined together to meet the battery capacity needs of our different BEV platforms. | | Modularization of battery pack design || Platform Modularity (TRL 9) || This project will focus on redefining our battery pack design to make it more modular. As opposed to having one large battery pack, we will create several battery pack modules that can be combined together to meet the battery capacity needs of our different BEV platforms. | ||
|| | || | ||
* Increased ability to service parts of the battery pack in the field when issues occur with individual cells | * Increased ability to service parts of the battery pack in the field when issues occur with individual cells | ||
| Line 212: | Line 220: | ||
|| Yes | || Yes | ||
|- | |- | ||
| Solid state battery technology [14] || Battery Technology || Development of batteries that utilize a solid electrolyte within our battery cells to carry electrons between battery electrodes, as opposed to the traditional liquid electrolytes that are used in batteries today. | | Solid state battery technology [14] || Battery Technology (TRL 6) || Development of batteries that utilize a solid electrolyte within our battery cells to carry electrons between battery electrodes, as opposed to the traditional liquid electrolytes that are used in batteries today. | ||
|| | || | ||
* Increased energy density of our battery packs, resulting in increased platform range | * Increased energy density of our battery packs, resulting in increased platform range | ||
| Line 222: | Line 230: | ||
|| Yes | || Yes | ||
|- | |- | ||
| Wireless charging [15] || Charging Technology || Development of charging technology that utilizes electromagnetic fields to transfer electrical current from an in-ground charger to the battery pack of our BEV platform | | Wireless charging [15] || Charging Technology (TRL 5) || Development of charging technology that utilizes electromagnetic fields to transfer electrical current from an in-ground charger to the battery pack of our BEV platform | ||
|| | || | ||
* No high voltage cables required for charging, which reduces the risk of electric shock, overheating, etc. | * No high voltage cables required for charging, which reduces the risk of electric shock, overheating, etc. | ||
| Line 231: | Line 239: | ||
|| Yes | || Yes | ||
|- | |- | ||
| Electric Motor Efficiency Project || Electric Motor || This is a proposed project to work on improving electric vehicle motor efficiency | | Electric Motor Efficiency Project || Electric Motor (TRL 8)|| This is a proposed project to work on improving electric vehicle motor efficiency | ||
|| | || | ||
* Improved efficiency will result in increased range of the vehicle | * Improved efficiency will result in increased range of the vehicle | ||
| Line 238: | Line 246: | ||
* Improvement in efficiency will have minimal overall impact on range considering the effort required to invest in this project | * Improvement in efficiency will have minimal overall impact on range considering the effort required to invest in this project | ||
|| No | || No | ||
|- | |||
|Lithium Ferrous Phosphate (LiFePO4 or LFP) vs Lithium Nickel Manganese Cobalt (Li-NMC) batteries || Battery Technology (TRL 5)|| Build strategy for whether we should invest in LFP, NMC, or both for future battery production | |||
|| | |||
* Can secure the production capacity and performance of battery | |||
|| | |||
* The technologies are different and require huge CAPEX. | |||
|| Yes | |||
|- | |||
|Second life to Batteries || Battery Technology (TRL 8)|| The majority of Lithium-ion batteries in general are sent to landfill or incinerated and many of the first generation electric vehicles will soon reach their end of life. This project to look propose new ways to utilize these end of the life EV batteries | |||
|| | |||
* Technology to sort used batteries into those suitable for a ‘second life’ and those which should be recycled | |||
* Automated methods to dismantle batteries so that they can be recycled more efficiently | |||
|| | |||
* No standardized way of packing or labelling batteries | |||
* No safety protocol for the recycling and reusing | |||
|| TBD (may be a better investment for infrastructure organizations) | |||
|- | |- | ||
|} | |} | ||
Latest revision as of 00:57, 5 December 2023
Roadmap Creators: Michael Peters, Hiro Ogasawara, Piyush Kumbhare
Time Stamp: 5 December 2023
Technology Roadmap Sections and Deliverables
- 2BEV - Battery Electric Vehicle Platforms
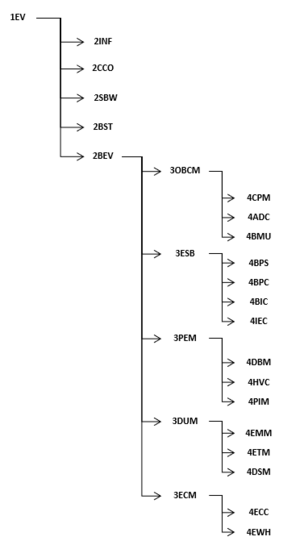
The Battery Electric Vehicle (BEV) platform, a level 2 roadmap, represents the critical product/system of the Battery Electric Platform that is integrated within a broader electrified vehicle. The level 1 system above the BEV is the electrified vehicle market segment, which includes other types of electrified vehicles (e.g., FCEV's, PHEV's, etc.) as well as the other vital systems that comprise electrified vehicles (e.g., steer-by-wire systems). Level 3 roadmaps represent critical subsystems within a BEV platform-based electrified vehicle, and level 4 roadmaps would indicate an individual component technology roadmap.
Roadmap Overview
Electrified vehicles are vehicles that utilize electric power (from a variety of different sources, such as batteries or fuel cells) to power an electric motor-based propulsion system. Examples of electrified vehicles that exist on the road today include plug-in hybrid electric vehicles (PHEV), fuel cell electric vehicles (FCV or FCEV) and battery electric vehicles (BEV). Electrified vehicles are an increasingly popular alternative to traditional gas-powered vehicles that generate propulsion through internal combustion engines. Electrified vehicles are one part of a broader ecosystem of solutions being used to combat the evolving problem/challenge of climate change. Electric vehicles help to solve this problem by providing humanity with an alternate mode of transportation that does not produce harmful greenhouse gas emissions.
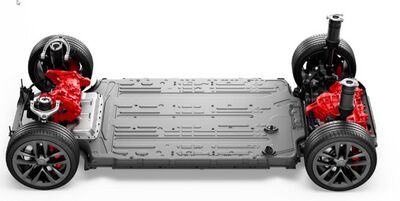
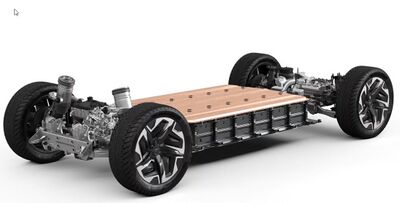
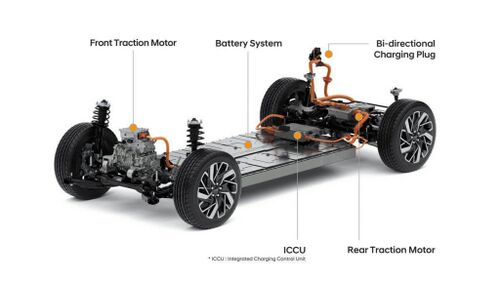
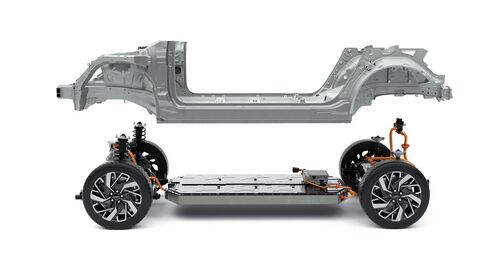
This roadmap will focus specifically on the battery electric vehicle (BEV) platform. BEV platforms are becoming increasingly popular as consumers seek different options within the electric vehicle market, and manufacturers look for ways to meet this customer demand through the use of modular architectures that multiple different vehicle variants may be built upon. Modular architectures/platforms for battery electric vehicles are typically comprised of a battery pack, on board charging module, integrated power electronics, drive units, and a chassis with a wheelbase. Multiple different vehicle bodies and accompanying features may then be built upon these platforms. Below are examples of BEV platforms being produced today (one by Tesla Motors, and one by General Motors) [1],[2],[3],[4].
Automotive manufacturers today often refer to these types of BEV platform designs as "skateboards", as they are built around the chassis and wheel base and allow for different architectures to be built on top of them. Developing platform and modular designs represents a strategic decision from auto manufacturers, who have historically suffered cost overruns due to the number of different vehicle variants and configurations that are possible in their existing vehicle offering/lineup. Platforming battery electric vehicles reduces the proliferation of possible vehicle variants, reduces manufacturing complexity and the cost to setup manufacturing lines, reduces the cost of vehicles by enabling increased strategic buying patterns, and often results in increased vehicle quality.
Design Structure Matrix (DSM) Allocation
Our technology of interest, battery electric vehicle platforms, is identified in the DSM below with dark blue highlighting at level 2 (2BEV). Additionally, we also show a tree structure that decomposes into the systems, and subsystems that comprise our level 2 technology. The DSM shows how these critical systems and subsystems interact to comprise the battery electric vehicle platform. For example, we see that a critical subsystem is the level 3 battery pack module, which is color-coded to indicate that it has its own, existing technology roadmap (3ESB - Energy_Storage_via_Battery). The battery pack module (or Energy Storage Battery) is comprised of the battery cells, pack structure, and other subsystems. The battery cells break down into their individual components (anode, cathode, etc.) that generate electrons to conduct electricity. However, we also see the interdependency between the battery pack structure and the high voltage cables, which in turn have a connection to the power inverter module. All this is to say that the interconnected nature of subsystems within a BEV platform critically come together to create the emergence exhibited by a battery electric vehicle.
Roadmap Model using OPM
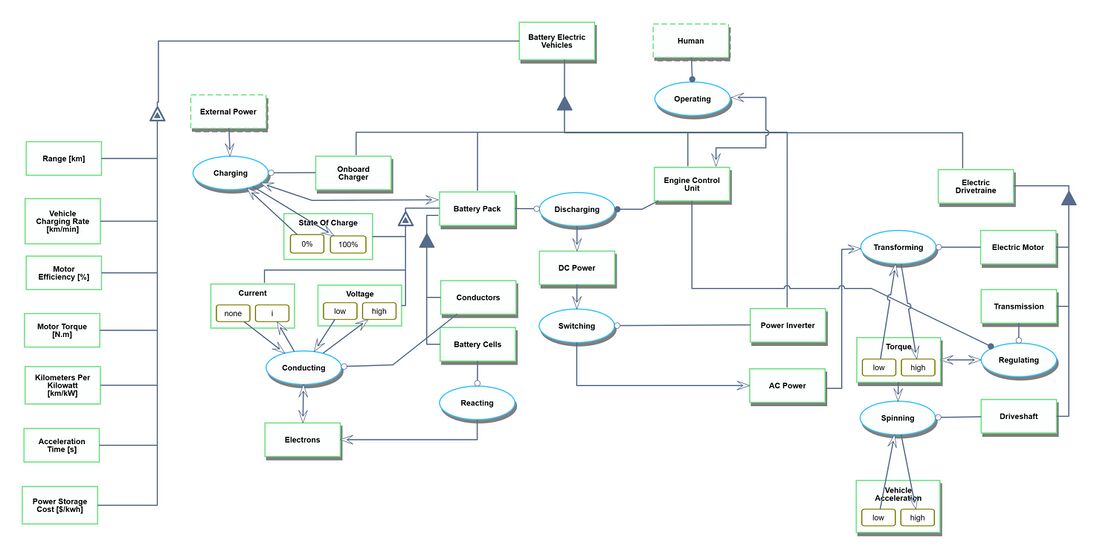
We provide an Object-Process-Diagram (OPD) of the Battery Electric Vehicle (BEV) Platform in the figure below. This diagrams captures the main object of the technology (Battery Electric Vehicle), the value-generating processes and different instruments associated with their characterization by Figures of Merit (FoM).
The OPD shows that the BEV platform can be decomposed into five main modules - the onboard charger, the battery pack, the engine control unit, the power inverter, and the electric drivetrain. The OPD depicts how these modules interact with one another to generate power at the wheelbase of the BEV platform. In short, the OPD shows that external power can be provided to the BEV platform by charging the battery to a high (up to 100%) state of charge. Once charged, the battery cells within the battery pack module react and create voltage and current that is conducted and then discharged from the battery pack. The engine control unit, which is operated indirectly by a human/operator that is driving the battery electric vehicle, controls the rate of discharge of the battery. The Discharged power from the battery is output as DC power, and is then switched by the power inverter to AC power that turns the electric motor and is transformed into torque. The transmission, which is also controlled by the engine control unit, regulates the torque from low to high and enables the driveshaft to spin, resulting in vehicle acceleration (going from low to high).
An Object-Process-Language (OPL) description of the roadmap scope is auto-generated and given in OPL_Battery_Electric_Vehicle. It reflects the same content as the previous figure, but in a formal natural language.
Figures of Merit
The table below summarizes the figures of merit used to evaluate battery electric vehicle platform technologies. Some of these figures of merit, such as range and acceleration, are very similar to the figures of merit used to evaluate traditional automotive vehicle. Other figures of merit, such as power storage cost and charge rate, are critical to evaluating the battery pack technology employed within the battery electric vehicle as well as the battery electric vehicle platform itself. Finally, FOM's such as carbon dioxide emissions and kilometers per kilowatt are very specific FOM's to battery electric vehicle platform technologies in totality.
| Figure of Merit (FOM) | Unit | Description |
|---|---|---|
| Range | [km] | The number of miles the vehicle can travel on a single full charge |
| Acceleration time | [s] | Time to accelerate to from 0 to 100 kmh (km per hour) |
| Motor Torque | [N.m] | Torque produced by the electric vehicle motor |
| Motor Efficiency | [%] | Percentage of energy discharged from the battery pack that is converted to mechanical energy |
| Kilometers per kilowatt | [km / kw] | The average distance the vehicle travels based upon the amount of energy used |
| Vehicle charge rate | [km/min] | The rate at which vehicle range (in km) is added to the BEV platform during charging |
| Power Storage Cost | [$/kWh] | Total cost of power storage within a BEV platform (at the battery pack level) in dollars per kilowatt |
| Carbon Dioxide Emissions | [g/km] | The total amount of carbon dioxide emissions generated by the vehicle platform per mile driven |
Note: Key FOM's are highlighted in bold text
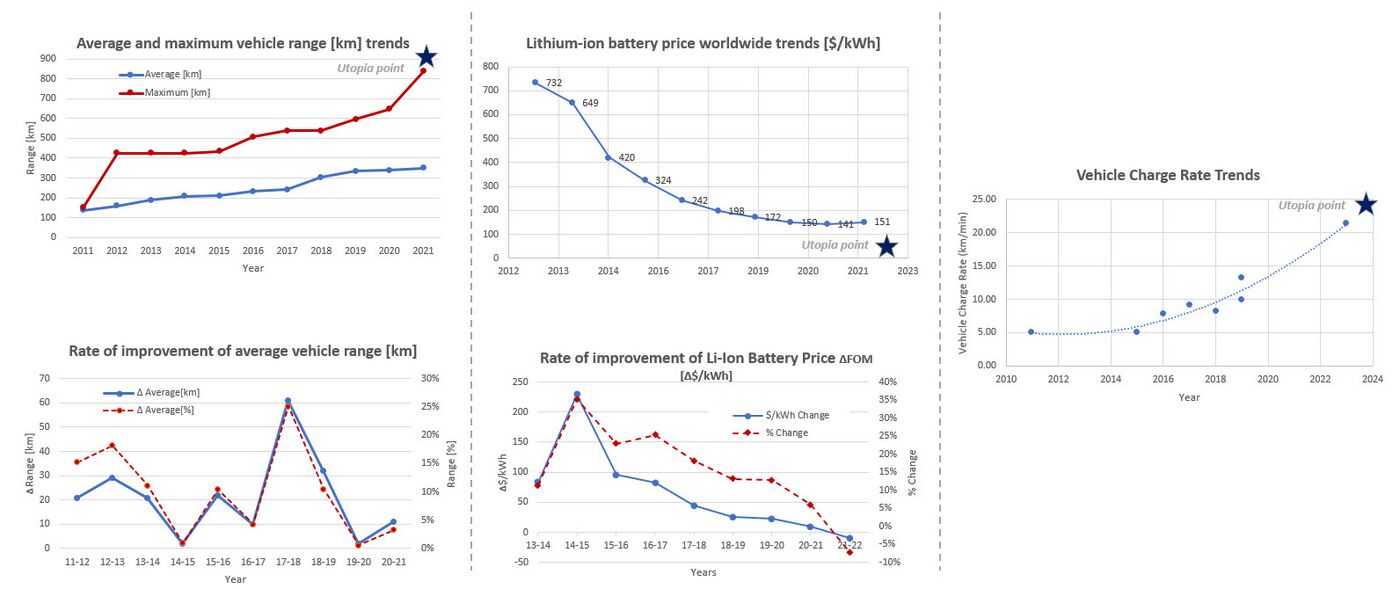
Below are some trends related to the figures of merit listed above. The charts show that the range of battery vehicles has been steadily increasing over the past decade, all while battery prices have rapidly declined. Both of these factors have contributed to increasing adoption of battery electric vehicle platforms, as the cost and performance of these systems continue to rise. Finally, charging trends are improving substantially, as new technology around superchargers enters the market (on both the BEV platform and charging station sides of the interface).
In addition to the figures of merit shown above, some of the key governing equations for battery electric vehicles are shown below.
| Input | Key Relationship or Governing Equation | Output |
|---|---|---|
|
ηm = P_out / P_in | ηm : motor efficiency (expressed as a %) |
|
T = (V_ac* I_ac * p_f ) / ((2π* N_rpm )/60) | T = motor torque |
Alignment with Company Strategic Drivers
The Automotive industry as a whole is in the midst of significant disruption. The market is shifting as new entrants such as Tesla, Rivian, BYD, and others bring advanced technology and supporting capabilities to a customer base wanting change. As our organization prepares to remain competitive with the likes of Tesla, Rivians, and others, there are three key pillars to our response in the market. First is embracing the transportation transformation. This means that we must realize that our customer base has a desire for an entirely new propulsion option when choosing the vehicle that they purchase. Customers want a vehicle with low or no emissions, and as such we must be prepared to offer this to them. In our case, this will be via a battery electric vehicle. Second is modularity and commonization of key subsystems and components. A key success factor to our ability to deliver new BEV platforms will be ensuring that we have identified where we can modularize major sub-systems and components, so that they can be easily reused across current and future platforms. Our third pillar is interoperability and integration. Our fourth pillar is lifecycle carbon neutrality.As our vehicles go out into the market, they cannot operate on their own any longer. We need to ensure that we have a level of interoperability with new infrastructure being brought online (e.g., charging stations of any brand), and we also must ensure that our products are integrated in a way that allows us to track the performance of vehicles in the field, deliver insights and diagnostics, and provide new features and updates to our customers.
Listed below are the strategic drivers for the company, and the alignment targets of our roadmap with these drivers:
| Number | Strategic Drivers | Alignment targets |
|---|---|---|
| 1 | To develop a battery electric vehicle platform that has an appropriate range for customers seeking to replace their existing internal combustion engine vehicle with a battery-powered electric vehicle. | The 2BEV roadmap is aligned to this strategic driver. The battery electric vehicle platform roadmap will target 1000 km as the desired maximum range of the BEV platform that is developed. This is benchmarked off of the top-end range of internal combustion engine vehicles on the market today. |
| 2 | To develop a set of battery electric vehicle platforms that will be utilized across all future vehicle production, with optimization of market segment coverage kept in mind and with the ability to scale the platform as necessary to meet the different needs of specific customers. The design of these platforms should minimize CAPEX and OPEX expenditures by allowing for engineering and design focus on a set of modular subsystems across platforms as well as commonization across manufacturing lines used to produce the platforms (reducing the cost of specified equipment). | The 2BEV roadmap is aligned to this strategic driver. This roadmap will support this strategic driver by identifying where modularity can be employed across a platform to better enable the optimization of platforms within market segments defined by the organization. |
| 3 | To support integration of battery electric vehicle platforms with critical external interfaces to better enable customer experience in areas such as charging, vehicle feature release, etc. | The 2BEV roadmap is aligned to this strategic driver. The battery electric vehicle platform roadmap will ensure compliance with the latest SAE charging protocols (e.g., charge port configuration), as well as other industry standards for key functions such as software development and deployment (e.g., AutoSar standards for OTA configuration). |
| 4 | To engineer a Battery Electric Vehicle (BEV) platform with minimal carbon emissions throughout the vehicle's lifecycle, ensuring carbon neutrality. | The 2BEV roadmap is aligned to this strategic driver. The battery electric vehicle platform roadmap will allocate 5% of its revenue to Research and Technology (R&T) projects to enhance battery efficiency and recyclability. The roadmap will include projects for lifecycle management, such as repurposing old car batteries in various applications. |
Positioning of Company vs. Competition
The images and table below show examples of other battery electric vehicle platforms available on the market today (or previously available on the market) along with representative data points for key figures of merit that BEV platforms are evaluated upon (data compiled from evspecifications.com [11]).
| Manufacturer | Model | Model Year | Range [km] | Battery Size [kwh] | Acceleration Time [s] | Vehicle Charge Rate [km/min] | Max Torque [N.m] | Electric Drive Configuration |
|---|---|---|---|---|---|---|---|---|
| General Motors | Chevrolet Bolt | 2023 | 416 | 65 | 6.5 | 5.3 | 360 | Single Electric Motor (FWD) |
| Tesla | Model S (performance) | 2023 | 652 | 100 | 2.4 | 21.3 | 967 | Dual Electric Motors |
| Lucid | Air (Touring) | 2023 | 684 | 94 | 3.4 | 21.3 | 1200 | Dual Electric Motors |
| BMW | i5 M60 | 2024 | 411 | 84 | 3.7 | 14.5 | 795 | Dual Electric Motors |
| Subaru | Soltera | 2023 | 357 | 73 | 6.5 | 14.6 | 338 | Dual Electric Motors |
| Nissan | Leaf | 2011 | 118 | 24 | 9.9 | 4.6 | 280 | Single Electric Motor (FWD) |
| Kia | Soul | 2015 | 150 | 30.5 | 11.2 | 3.6 | 285 | Single Electric Motor (FWD) |
| Tesla | Model S | 2012 | 426.5 | 85 | 5.4 | 7.6 | 440 | Single Electric Motor (RWD) |
| General Motors | Chevrolet Spark | 2014 | 132 | 21.3 | 7.9 | 4.2 | 542 | Single Electric Motor (FWD) |
| Hyundai | IONIQ | 2023 | 581 | 77 | 5.1 | 25.8 | 350 | Dual Electric Motors |
| BYD | Qin plus EV Pilot Diamond Type | 2023 | 610 | 72 | 3.8 | 20.3 | 250 | Dual Electric Motors |
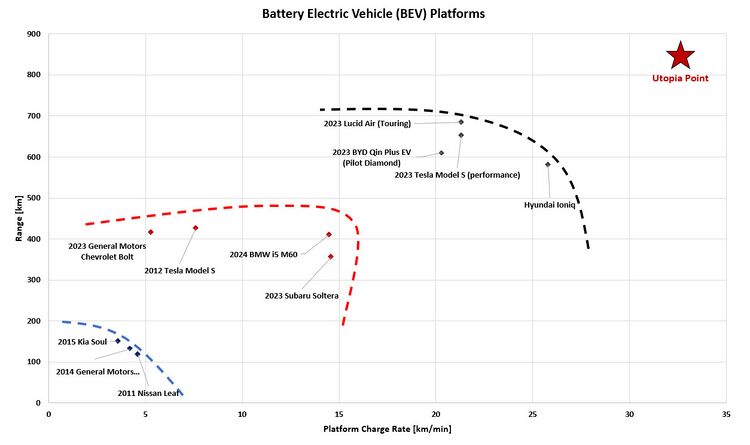
Below is a graph of range [km] vs vehicle charging rate [km/min] for the BEV platforms listed in the table above. This chart illustrates how the pareto front of BEV platform performance has shifted over time as it relates to the key FOM's of range and charging rate. In the bottom left of the chart, there is a cluster of early mass-production BEV platforms such as the Nissan Leaf and the Chevy Spark. In the middle of the chart, we see current-day BEV platforms such as the Chevy Bolt and BMW i5 M60. Towards the upper right side of the chart, we see a high-performing group of current-day BEV platforms in the Tesla Model S (performance), the Lucid Air, and the Hyundai Ioniq. This group of high-performing current-day mass production BEV platforms form the pareto front for existing advancement in BEV platform technology (Data from references [5], [6], and [7]).
This chart also shows how specific manufacturers have improved the performance of their technology over time, and what tradeoffs they have made in doing so. For example, General Motors (parent company of the brand Chevrolet) made significant improvements in vehicle range between their 2014 Chevy Spark and their 2023 Chevy Bolt. However, they made only marginal improvements in the performance of vehicle charging rate. On the other hand, Tesla made considerable improvements in both of these areas between their 2012 version of the Tesla Model S and their 2023 Tesla Model S (performance edition). It is also interesting to note that companies like Tesla truly appear to be pushing the Pareto front forward with their latest BEV platforms. They had the most advanced platform on the road when they introduced the model S in 2012, and the latest version of this BEV platform is also near the edge of the pareto front.
Technical Model
In order to assess the feasibility of the technical targets that we have set, at the level of the battery electric vehicle platform roadmap, we have developed a technical model. The purpose of this model is to evaluate the sensitivity of key FOM's (representing progress in technology development) to individual variables that can be adjusted through different architectural and design decisions. As a first step, we have compiled a morphological matrix that represents a set of options available in our future architectural decision-making process:
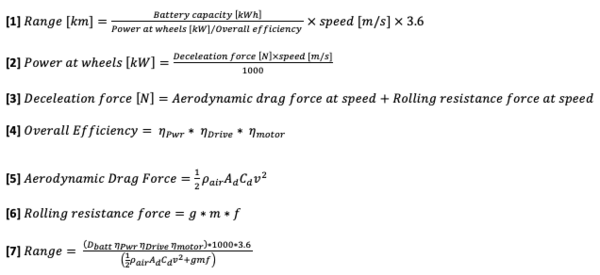
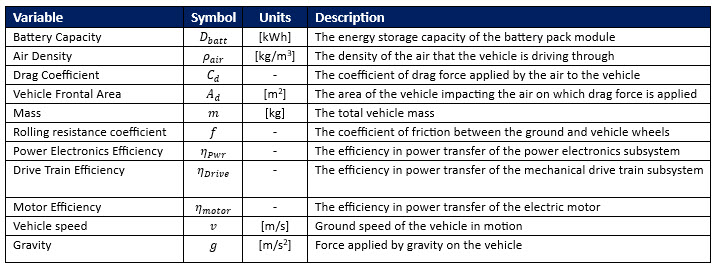
The morphological matrix for the battery electric vehicle technology represents decisions that can be made around several of the underlying technologies that comprise battery electric vehicle platforms. The selection of different options in these categories represents an impact on individual variables that describe the governing range equation associated with battery electric vehicle performance. Specifically, the variables impacted are those in the parametrized equation representing vehicle driving range. Below is the equation for battery electric vehicle range [equation 1], as well as the decomposition of battery electric vehicle range into underlying, foundational variable parameters [equation 7] (derived from reference [12]). Adjustment to any of the variables shown below will impact the resultant range that a BEV platform may drive.
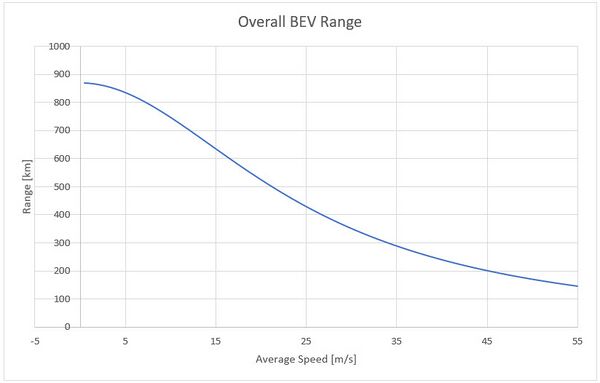
The variables and equations above can then be used to develop a model for battery electric vehicle range based upon the constant speed (v) that the vehicle is driving at. Below is a graph of that model for an example BEV - the 2023 Chevy Bolt. Data for the Chevy bolt was pulled from public sources to chart this model and predict the range. To confirm the feasibility of this analysis, the estimated range of 27 m/s was compared with the published range of the Chevy bolt. The range value calculated was within 5% of the published value for the vehicle range.
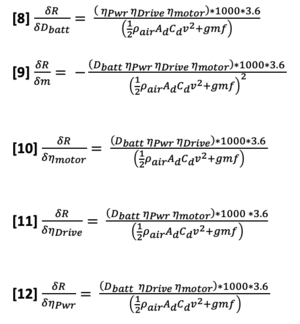
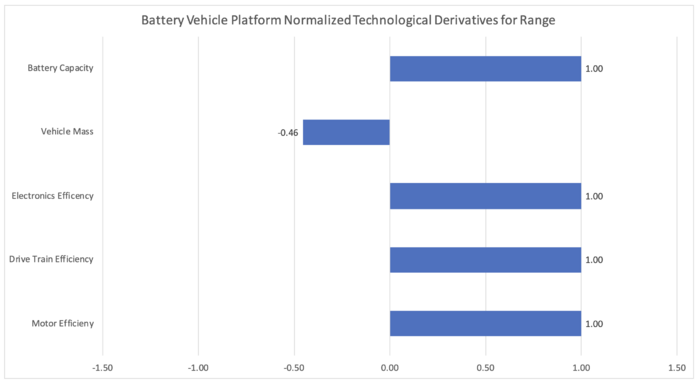
The variables in the range equation above can be adjusted to impact the range as shown in the derivatives below. Changes to the range are limited to variables, which are not fixed / constant. Those that cannot be varied include constants such as air density, gravity, drag coefficient, the rolling resistance coefficient, and the vehicle speed (which is controlled by the driver, not directly by design). By varying the mass of the platform, the efficiency of the motor, power electronics, and drive train, and by adjusting the battery capacity (based on pack size), the range of the BEV platform may, in turn be adjusted.
To examine the impact of these individual variables, the derivatives above were normalized and the values of such were plotted in the tornado chart below. From this it can be seen that reducing vehicle mass has a positive impact on the overall range of the vehicle. Increasing the efficiency of the motor, drive train, and power electronics along with increasing battery capacity leads to an equal increase in range for the BEV platform. The absolute impact on range by increasing the efficiency of the motor, drive train, and power electronics along with increasing battery capacity is greater than the one by reducing the vehicle mass.
Financial Model
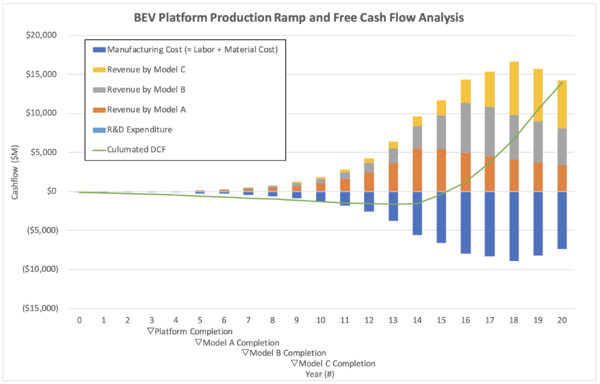
The figure below shows the financial model for the introduction of the all-new BEV platform. The model contains the R&D expenditure over the next 9 years to engineer a platform and three vehicles to support 2 of our 5 critical R&D projects - introduction of the sodium ion battery chemistry, and the modularization of the battery pack. The R&D expenditure is anticipated to improve the vehicles based on the customer's request after the three models are released. The model also contains the expected revenue over time for vehicle sales, as well as the cost associated with vehicle sales. Our expectation is that we will slowly ramp production over a period of years from 10,000 units per year to 1,016,000 units sold per year, which is the same number of sales of Toyota RAV4 in 2022. The platform is completed in year 3 and model A, B, and C are launched in year 5, 7, and 8. The model charts the discounted revenue and discounted costs over time, which can then be used to calculate yearly discounted free cash flow and our net present value.
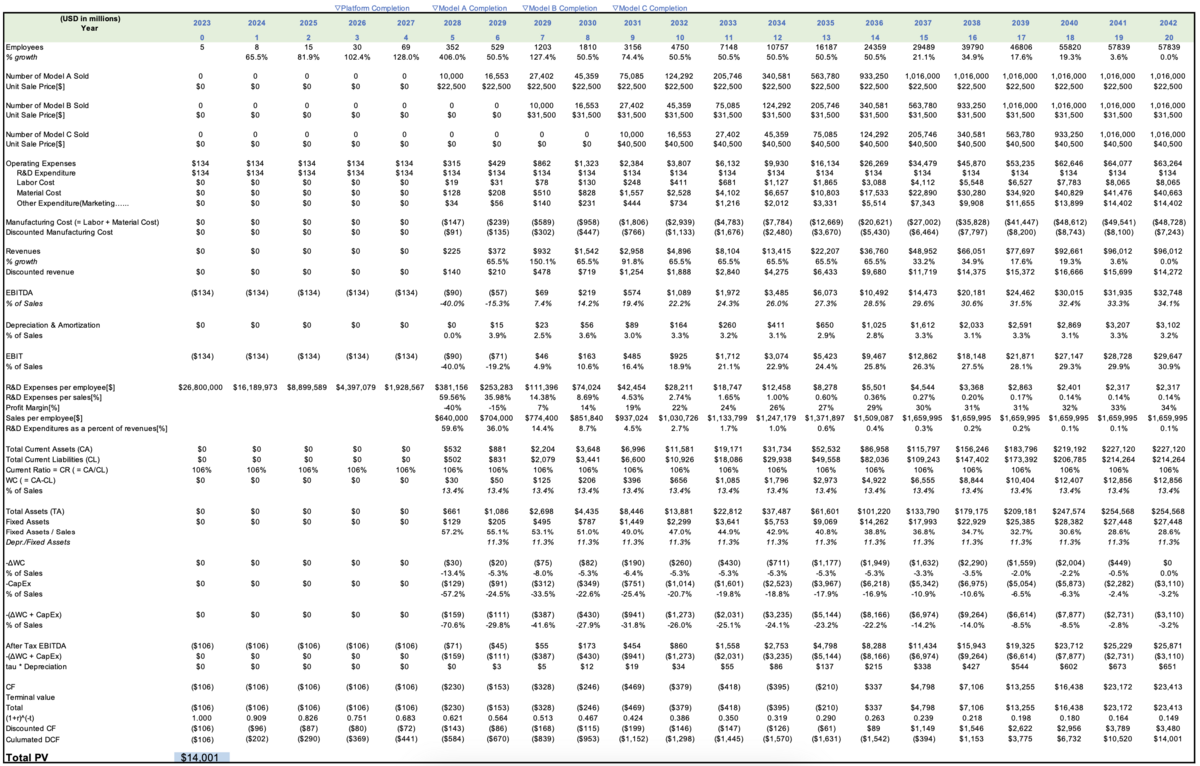
The table below contains the details behind the financial model shown above. As shown in the table, as production ramps, so does our revenue and cost. The three models are sold at the price of $22,500, $31,500, and $40,500 respectively. The manufacturing cost contains labor and material costs, which are estimated at 8.4% and 57% of the vehicle price. We expected EBITA to be positive in the 7th year. EBITA per sales is expected more than 14.4% in general, which is the industrial average. Additionally, working capital per sales is expected to be 13.4%, the industrial average.
Also shown in the table below is the time required to recover our investment and manufacturing cost. According to our analyses, it will take approximately 16 years (11 years after the first model is launched) to break even and begin profiting from the production of our all-new BEV platform. This is a high cost of introduction, but we expect that as we scale, we will gain a permanent foothold in the EV market and will see increased profitability in the years following the introduction of this initial BEV platform. The total PV of the project is $14,001 million.
List of R&D Projects and Prototypes
The choice of R&D projects to undertake is driven by priorities around company strategic drivers as well as key figures of merit. From a strategic perspective, it is important that our R&D projects are aligned to our key strategic drivers of developing a modular set of subsystems, increasing range to customer needs, and integrating with critical external interfaces / infrastructure. Figures of merit that also guide decisions around which R&D investments to make include maximizing battery electric vehicle platform range [km] as well as improving the speed at which battery electric vehicle platforms charge - charging rate [km/min]. The table below lists the R&D projects that we are focused on as investments.
| R&D Project | Technology Area & TRL | Description | Benefits | Challenges | Investment Decision |
|---|---|---|---|---|---|
| Sodium-ion battery technology infusion [13] | Battery Technology (TRL 7) | This project will focus on infusing existing technology around sodium ion based battery cells into our existing battery pack module design. |
|
|
Yes |
| Modularization of battery pack design | Platform Modularity (TRL 9) | This project will focus on redefining our battery pack design to make it more modular. As opposed to having one large battery pack, we will create several battery pack modules that can be combined together to meet the battery capacity needs of our different BEV platforms. |
|
|
Yes |
| Solid state battery technology [14] | Battery Technology (TRL 6) | Development of batteries that utilize a solid electrolyte within our battery cells to carry electrons between battery electrodes, as opposed to the traditional liquid electrolytes that are used in batteries today. |
|
|
Yes |
| Wireless charging [15] | Charging Technology (TRL 5) | Development of charging technology that utilizes electromagnetic fields to transfer electrical current from an in-ground charger to the battery pack of our BEV platform |
|
|
Yes |
| Electric Motor Efficiency Project | Electric Motor (TRL 8) | This is a proposed project to work on improving electric vehicle motor efficiency |
|
|
No |
| Lithium Ferrous Phosphate (LiFePO4 or LFP) vs Lithium Nickel Manganese Cobalt (Li-NMC) batteries | Battery Technology (TRL 5) | Build strategy for whether we should invest in LFP, NMC, or both for future battery production |
|
|
Yes |
| Second life to Batteries | Battery Technology (TRL 8) | The majority of Lithium-ion batteries in general are sent to landfill or incinerated and many of the first generation electric vehicles will soon reach their end of life. This project to look propose new ways to utilize these end of the life EV batteries |
|
|
TBD (may be a better investment for infrastructure organizations) |
Key Publications, Presentations and Patents
The following are a representative set of patents that have contributed to the overall development of Battery Electric Vehicle Platforms. Battery electric vehicle platforms fall under the umbrella CPC code of B60L - "Propulsion of electrically propelled vehicles". Many of the patents describing advances in subcomponent technology, control algorithms, etc. can be found beneath even more detailed CPC codes such as B60L 50/60 ("Electric propulsion with power supplied within the vehicle using power supplied by batteries), B60L 50/51 ("electric propulsion with power supplied within the vehicle using propulsion power supplied by batteries or fuel cells characterized by AC-motors”), and B60L 15/20 ("methods for controlling the traction motor speed of electrically-propelled vehicles").
High Power Low Voltage Electrified Powertrain
- US Patent: 9484852 B2
- Assignee: FCA US LLC
- Inventors: Timmons, Adam, Anand Sathyan, and Marian Mirowski
- Year:2016
- Description: This patent represents a way in which 4 low voltage battery modules could be used to power an electric motor by providing 4 distinct DC voltages to a power inverter that then switches the DC power to AC power to drive an electric motor of 4 or more phases. This represents one potential approach to how a BEV platform could be configured.
- Importance: This patent is relevant to BEV platforms, as it was an early description of what an electrified powertrain/propulsion system architecture would conceptually look like. The patent is relevant to BEV platforms, as it describes the different key modules of an electrified powertrain, such as an electric motor, an independent battery module, a power inverter module, and a controller. These are all critical elements that comprise modern-day BEV platforms.
Electrified Powertrain With Maximum Performance Mode Control Strategy Using Extended Inverter Limit
- US Patent: 2022/1069237
- Assignee: GM Global Technology Operations LLC
- Inventors: Hu, Yiran, Gagas Brent, Kee Kim, James Creehan, and Brian Welchko
- Year:2022
- Description: This patent describes the concept of electrified powertrain maximum performance mode control strategy using extended inverter limit.
- Importance: This patent is relevant to BEV platforms, as it describes an operating scenario for control of the BEV platform. The patent, similar to the one above, does a tremendous job in laying out the critical modules within a BEV. This includes the high voltage battery, power inverter module(s), electric motor(s), DC to DC converters, and more. The patent describes the control strategy to allow the electric motor to enter maximum performance mode, thereby putting out a torque near its own performance limit for a short period of time. Use cases for such a mode are documented as 0-60 tests and other maneuvers. Additionally, the patent calls out the fact that this operating mode is restricted to short periods due to the high load put on the inverter module by the electric motor when it is in maximum performance mode range. Again, this patent represents a potential operating state for BEV platforms.
System and Method of Controlling Power Distribution From Charging Source to Electric Vehicle
- US Patent: 2021/0031643 A1
- Assignee: GM Global Technology Operations LLC
- Inventors: Wang, Yue-Yun, J Brooks, Jun-Mo Kang, and Donald Grimm
- Year:2021
- Description: This patent describes the concept of controlling power distribution from a charging source to electric vehicle, including how the state of charge of the battery is controlled during the charging process.
- Importance: This patent does a very good job of detailing the interface and architecture between charger and the battery being charged, describing how the state of charge of the battery is controlled during the charging process. Again, this patent is relevant to our technology as it represents another operating state of BEV platforms – charging the energy storage mechanism of the BEV.
Key Publications Pertaining to Battery Electric Vehicle Platforms:
In addition to the many patents published on concepts that comprise battery electric vehicle platforms, many articles have also been published to describe BEV's, their market progression, and example architectures. Some early examples of articles that reviewed the BEV technology readiness and BEV technology progress are below:
- Andwari, Amin, Apostolos Pesiridis, Srithar Rajoo, Ricardo Martinez-Botas, and Vahid Esfahanian. “A Review of Battery Electric Vehicle Technology and Readiness Levels.” Renewable and Sustainable Energy Reviews 78 (2017): 414–30.
- Sun, Xiaoli, Zhengguo Li, Xiaolin Wang, and Chengjiang Li. “Technology Development of Electric Vehicles: A Review.” Energies 13, no. 1 (2019): 90.
Andwari et al (2017) lay out some of the core elements to consider the readiness of BEV’s for commercialization in their article. The article focuses on the potential of different materials to be used within batteries (e.g., Lithium-ion as compared to Lead-acid batteries), as well as the principles behind battery electric vehicle architecture – integration of a battery pack, power electronics, and electric motors. The article also considers charging infrastructure and compares BEV’s to other lower emission vehicles, such as hybrid vehicles and low emission ICE vehicles. Ultimately this article concluded in 2017 that BEV’s would be a critical piece of the transportation sector in the future, as climate and energy fears were on the rise.
“Technology development of Electric Vehicles” by Sun et al (2019) considers less of the economic and societal impact of the BEV’s, and rather focuses on the architecture of the battery electric vehicles – assessing current state and future state challenges for each piece of the architecture. The article does a good job in describing a BEV platform based upon the components of a battery pack, battery management system, charging module, power electronics, and electric motor. The article calls out the need for future development in these areas – higher capacity batteries, faster charging technology, and increased reliability of electric motors. But yet again, this article also comments on the bright future for BEV’s in the automotive transportation market
Technology Strategy Statement
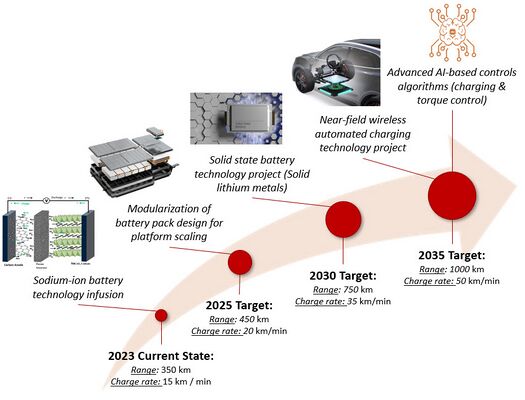
Our target is to develop the next generation of battery electric vehicle platforms with a target on a fully redefined platform by 2035, but with updates to our existing platforms along the way. Over this time we aim to achieve a range of 1000 km and charging rates of 50 km/min or greater in our platform. To achieve this target we will be focused on 5 projects, including some existing technology infusions. Our first project will be focused on the infusion of sodium-ion battery technology into our existing product portfolio. Our second project will be focused on modularizing our battery pack design to increase our ability to scale the size of battery pack across our three vehicle platforms (sedan, SUV, and heavy-duty platforms). Our third project will be focused on developing solid-state battery technology to reduce the volume of our battery pack to improve packaging in the design, and increase the charging speed of the pack. Our fourth project will be centered on integrating near-field wireless charging technology into our BEV platform. This will allow for faster charging and may enable us to far exceed our target of 50 km/min of charge. Finally, we will also be focused on developing advanced AI-algorithms that will support charging control of our nearfield wireless system as well as advanced battery discharge and torque controls.
References
[1] Szczesny, Joseph. “GM Targeting Bigger Share of Bev Market, CEO Barra Says.” WardsAuto, June 16, 2022. https://www.wardsauto.com/industry-news/gm-targeting-bigger-share-bev-market-ceo-barra-says.
[2] Seabaugh, Christian. “Beyond Plaid: A Quad-Motor Tesla Model S Is Possible.” MotorTrend, June 18, 2021. https://www.motortrend.com/news/tesla-model-s-quad-motor-report/.
[3] Oreizi, Darya. “Overview of Electric Vehicle Platforms in 2021.” Charged Future, February 16, 2021. https://www.chargedfuture.com/electric-vehicle-platforms-in-2021/.
[4] Kashikar, Gajanan. “Emerging Markets Will Play a Major Role in Hyundai’s Global EV Strategy.” CarWale, April 24, 2021. https://www.carwale.com/news/emerging-markets-will-play-a-major-role-in-hyundais-global-ev-strategy/.
[5] Ritchie, Hannah. “The End of Range Anxiety: How Has the Range of Electric Cars Changed over Time?” Sustainability by numbers, February 27, 2023. https://www.sustainabilitybynumbers.com/p/electric-car-range.
[6] Bhutada, G. (2022, September 30). Visualizing the range of electric cars vs. gas-powered cars. Visual Capitalist. https://www.visualcapitalist.com/visualizing-the-range-of-electric-cars-vs-gas-powered-cars/
[7] 2023 Bloomberg Finance L.P. (2022, December 6). Lithium-ion battery pack prices rise for first time to an average of $151/kwh. BloombergNEF. https://about.bnef.com/blog/lithium-ion-battery-pack-prices-rise-for-first-time-to-an average-of-151-kwh/
[8] Cai, Wenlong, Yu-Xing Yao, Gao-Long Zhu, Chong Yan, Li-Li Jiang, Chuanxin He, Jia-Qi Huang, and Qiang Zhang. “A Review on Energy Chemistry of Fast-Charging Anodes.” Chemical Society Reviews 49, no. 12 (June 2020): 3806–33. https://doi.org/10.1039/c9cs00728h.
[9] Andwari, Amin, Apostolos Pesiridis, Srithar Rajoo, Ricardo Martinez-Botas, and Vahid Esfahanian. “A Review of Battery Electric Vehicle Technology and Readiness Levels.” Renewable and Sustainable Energy Reviews 78 (2017): 414–30.
[10] Sun, Xiaoli, Zhengguo Li, Xiaolin Wang, and Chengjiang Li. “Technology Development of Electric Vehicles: A Review.” Energies 13, no. 1 (2019): 90.
[11] “Electric Vehicle Specifications, Electric Car News, EV Comparisons.” EV Specifications. Accessed December 1, 2023. https://www.evspecifications.com/.
[12] Grewal, K.S., and P.M. Darnell. “Model-Based EV Range Prediction for Electric Hybrid Vehicles.” Hybrid and Electric Vehicles Conference 2013 (HEVC 2013), 2013. https://doi.org/10.1049/cp.2013.1895.
[13] House, Robert. “How Sodium-Ion Batteries Could Make Electric Cars Cheaper.” The Conversation, October 10, 2023. https://theconversation.com/how-sodium-ion-batteries-could-make-electric-cars-cheaper-207342.
[14] Kelly, Tim. “Explainer: How Could Solid-State Batteries Improve next-Gen Evs?” Reuters, June 13, 2023. https://www.reuters.com/business/autos-transportation/how-could-solid-state-batteries-improve-next-gen-evs-2023-06-13/.
[15] “Everything You Need to Know about Wireless EV Charging” EV Charging Summit Blog, December 22, 2022. https://evchargingsummit.com/blog/everything-you-need-to-know-about-wireless-ev-charging/.
