Difference between revisions of "Ebikes"
| (86 intermediate revisions by 3 users not shown) | |||
| Line 1: | Line 1: | ||
The e-Bike (2EBK) roadmap is a level 2 roadmap | The e-Bike (2EBK) roadmap is a level 2 roadmap focusing on specific micromobility solutions (e.g., shared electric scooters, e-bikes). It is situated under the level 1 micromobility system market, representing the broader urban mobility market. Below e-Bikes exists the level 3 roadmaps that target the subsystems within these solutions (e.g., powertrain, connectivity, structural), and level 4 roadmaps delve into individual components (e.g., battery cells, sensors, motors). | ||
== Technology Roadmap Overview == | == Technology Roadmap Overview == | ||
Electric bicycles (e-bikes) are a key component of the micromobility revolution, offering electric-assisted cycling at speeds typically below 25 km/h (15 mph). These vehicles represent a significant advancement in urban transportation, providing a flexible and sustainable solution for short to medium-distance travel in city environments. | |||
The history of e-bikes traces back to the late 19th century, with early patents for electrically powered bicycles emerging in the 1890s. However, the modern e-bike era truly began in 1989 when Michael Kutter developed the Velocity Commuter, one of the first bikes with pedal-assist technology. | |||
Two iconic e-bikes that represented significant milestones in the development of e-bikes are the Yamaha PAS (1993)- widely considered the first commercially successful e-bike, introducing the revolutionary pedal-assist motor system and the RadRover by Rad Power Bikes (2015)- an iconic model that helped popularize affordable e-bikes for everyday use, making the technology more accessible to consumers. | |||
===E-Bike Evolution=== | |||
Significant technological developments around e-bikes are illustrated in the table below. | |||
{| class="wikitable sortable" style="margin-left: auto; margin-right: auto; border: none;" | |||
|- | |||
! Era !! Year !! Key Development !! Enabling Technology | |||
|- | |||
| Early Bicyle || 1817 || First "Draisine" || Human-powered mechanical propulsionAcceleration | |||
|- | |||
| Mechanical Era || 1860s || Chain-drive bicycle || Metal fabrication, gear systems | |||
|- | |||
| Electric Patents || 1895 || First e-bike patent (Bolton) || DC motor, lead-acid batteries | |||
|- | |||
| Early Production || 1930s-1980s || Limited commercial attempts || Crude motor/battery systems | |||
|- | |||
| Modern Foundation || 1989-1993 || Yamaha Power Assist System || Power control systems, sensors | |||
|- | |||
| Mass Market || 1990s-2000s || Practical e-bikes emerge || Li-ion batteries, efficient motors | |||
|- | |||
| Smart Integration || 2010-2020 || Connected e-bikes || Mobile apps, IoT, cloud computing | |||
|- | |||
| Next Generation || 2020+ || Advanced e-mobility || AI/ML, advanced batteries, lightweight materials | |||
|- | |||
|} | |||
[[File:ebikeevolution.png|750px|center]] | |||
===Key Components=== | |||
E-bikes integrate electric propulsion with traditional bicycle mechanics to create an efficient hybrid transportation solution. The core technology combines electric motors providing pedal assistance up to 25 km/h with advanced battery and control systems. Key subsystems include: | |||
# Electric propulsion systems (motors, controllers) | |||
# Energy storage and management (batteries, charging systems) | |||
# Structural systems (frames, components) | |||
# Connectivity and smart features | |||
===Market Evolution=== | |||
Today, an entire operating model and system is designed around not only e-bike manufacturers but also the broader micromobility system. | |||
[[File:ebikecategorymarket.png|1500px|center]] | |||
[https://www.marketsandmarkets.com/Market-Reports/electric-bike-market-110827400.html MarketandMarkets|center] | |||
E-bikes are at the forefront of smart mobility solutions, interfacing with user data and contextual information to enhance the riding experience. The industry is also exploring autonomous features and improved integration with smart city infrastructure. As urban planners focus on sustainable transportation, e-bikes are becoming central to city development strategies, from revitalizing historic city centers to shaping innovative urban projects. Their role in reducing traffic congestion, lowering emissions, and promoting active lifestyles positions e-bikes as a crucial element in the future of experiential urban mobility. | |||
This roadmap examines the technological development pathway for these subsystems, focusing on near-term improvements and longer-term innovations that will define next-generation e-bikes. Critical areas include battery technology advancement, motor efficiency, weight reduction, and smart system integration. | |||
== Design Structure Matrix (DSM) Allocation == | |||
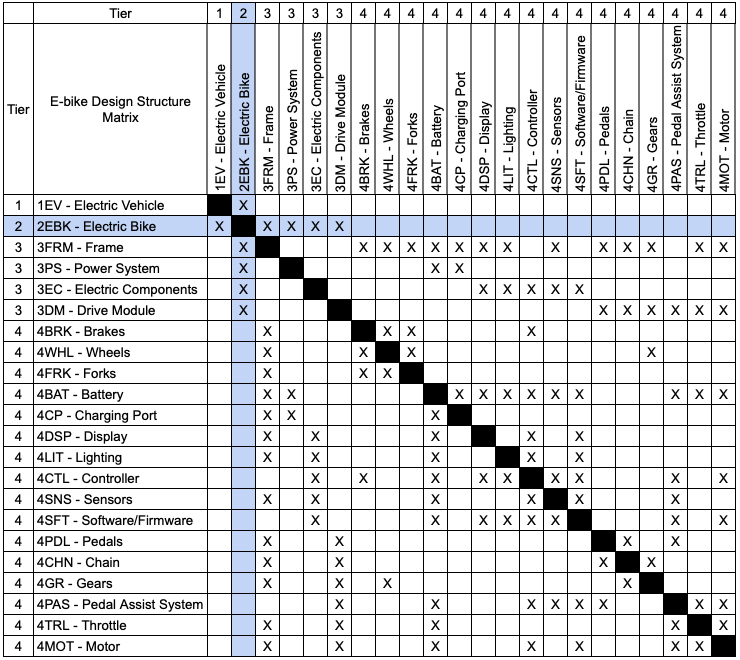
E-bikes can be broken down into the following technologies and inter-dependencies. E-bikes fall into the general category of electric vehicles. Some components have many more interdependencies than others (e.g. the battery), showing that improvements to some key components can have bigger improvements on the overall e-bike. | |||
1EV - Electric Vehicle | |||
:2EBK - Electric Bike | |||
::3FRM - Frame | |||
:::4BRK - Brakes | |||
:::4WHL - Wheels | |||
:::4FRK - Forks | |||
::3PS - Power System | |||
:::4BAT - Battery | |||
:::4CP - Charging Port | |||
::3EC - Electric Components | |||
:::4DSP - Display | |||
:::4LIT - Lighting | |||
:::4CTL - Controller | |||
:::4SNS - Sensors | |||
:::4SFT - Software/Firmware | |||
::3DM - Drive Module | |||
:::4PDL - Pedals | |||
:::4CHN - Chain | |||
:::4GR - Gears | |||
:::4PAS - Pedal Assist System | |||
:::4TRL - Throttle | |||
:::4MOT - Motor | |||
[[File:Ebike_DSM.png|1000x1000px|center]] | |||
== Roadmap Model using OPM == | == Roadmap Model using OPM == | ||
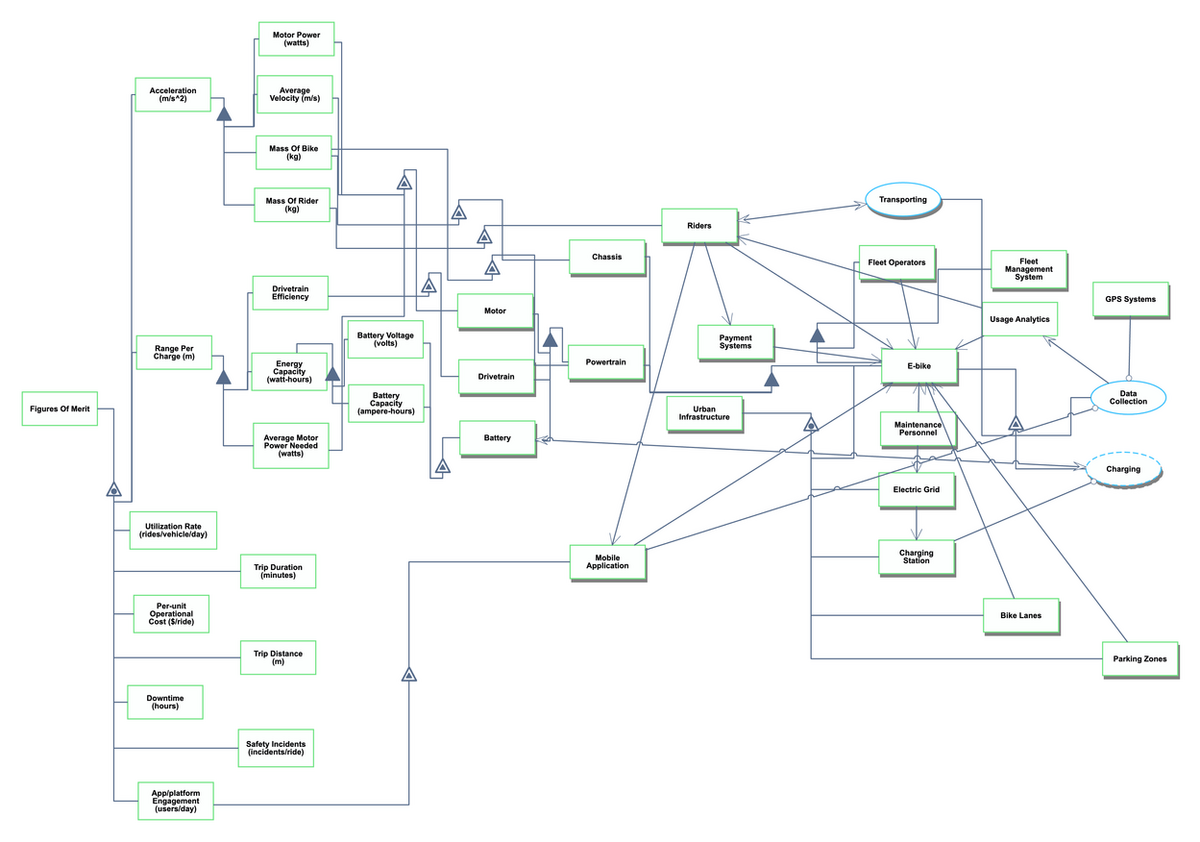
Below, we provide an object-process diagram (OPD) of the | Below, we provide an object-process diagram (OPD) of the 2BKE roadmap. This diagram captures the main object of the roadmap, its decomposition into subsystems (powertrain, connectivity, structural, etc.), its characterization by Figures of Merit (FOMs), as well as the main processes and actors involved. | ||
[[File:Micromobility_OPM.png]] | [[File:Micromobility_OPM.png|1200x1200px|center]] | ||
[[File:Micromobility_OPM_Details.png]] | [[File:Micromobility_OPM_Details.png|1200x1200px|center]] | ||
==Figures of Merit== | ==Figures of Merit== | ||
| Line 19: | Line 96: | ||
! Figure of Merit (FOM) !! Unit !! Description | ! Figure of Merit (FOM) !! Unit !! Description | ||
|- | |- | ||
| | | Acceleration || m/s^2 || The acceleration that the vehicle is capable of. | ||
|- | |||
| Range per charge || m || The distance that the vehicle is able to travel on a single charge. | |||
|- | |||
| Pedal Assistance || watts || Measures how much the e-bike is assisting when pedaling. | |||
|- | |- | ||
| Utilization Rate || rides/vehicle/day || Indicates how frequently a vehicle is used on average in a shared system. | | Utilization Rate || rides/vehicle/day || Indicates how frequently a vehicle is used on average in a shared system. | ||
|- | |- | ||
| Trip Duration || | | Trip Duration || minutes || Represents the average time taken for a typical trip by users. | ||
|- | |- | ||
| | | Trip Distance || meters || Measures the average distance covered during a single trip. | ||
|- | |- | ||
| Per-Unit Operational Cost || $/ride || Calculates the cost associated with maintaining and operating the vehicle for each ride. | | Per-Unit Operational Cost || $/ride || Calculates the cost associated with maintaining and operating the vehicle for each ride. | ||
|- | |- | ||
| Downtime || | | Downtime || hours || Represents the amount of time a vehicle is unavailable for use, typically due to maintenance or charging. | ||
|- | |- | ||
|} | |} | ||
==Alignment with Company Strategic Drivers: FOM targets== | ==Alignment with Company Strategic Drivers: FOM targets== | ||
| Line 73: | Line 148: | ||
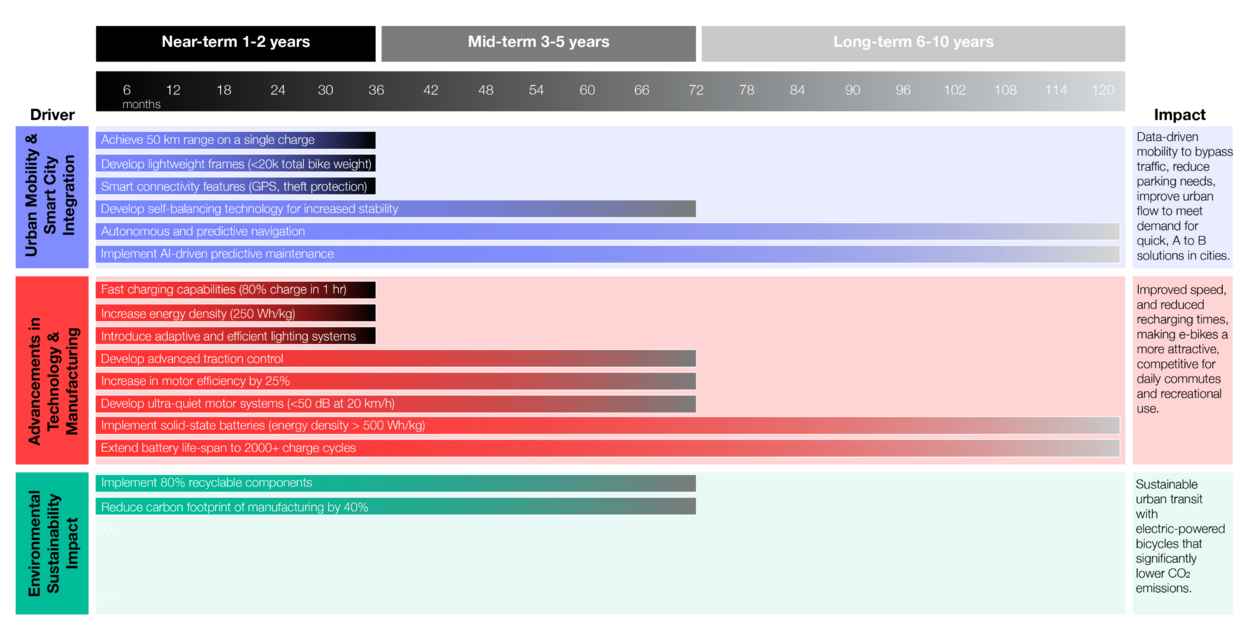
The figure below is a representation of the roadmap that is currently being built: | The figure below is a representation of the roadmap that is currently being built: | ||
[[File:E-bike roadmap.png| | [[File:E-bike roadmap v2.png|1250px|center]] | ||
==Positioning of Company vs. Competition | ==Positioning of Company vs. Competition== | ||
To effectively position our e-bike offering within the micromobility market, analyzing the value provided to customers against the cost incurred by producers is essential. Below is a conceptual representation of this relationship, highlighting our position relative to key competitors: | To effectively position our e-bike offering within the micromobility market, analyzing the value provided to customers against the cost incurred by producers is essential. Below is a conceptual representation of this relationship, highlighting our position relative to key competitors: | ||
| Line 100: | Line 175: | ||
|} | |} | ||
=== Value to Customers === | |||
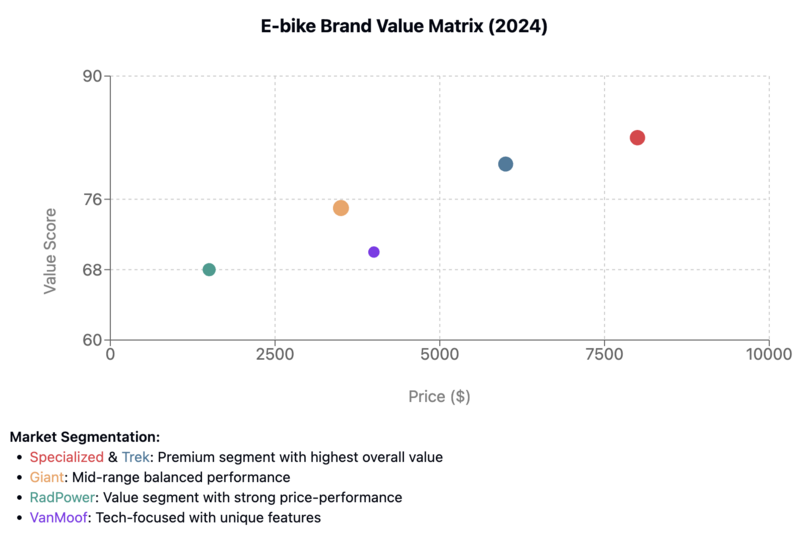
We aim to occupy a unique position by delivering high customer value through innovative features and affordability while keeping production costs manageable. This strategy aims to attract a broad user base seeking cost-effective and efficient urban transportation solutions. | We aim to occupy a unique position by delivering high customer value through innovative features and affordability while keeping production costs manageable. This strategy aims to attract a broad user base seeking cost-effective and efficient urban transportation solutions. | ||
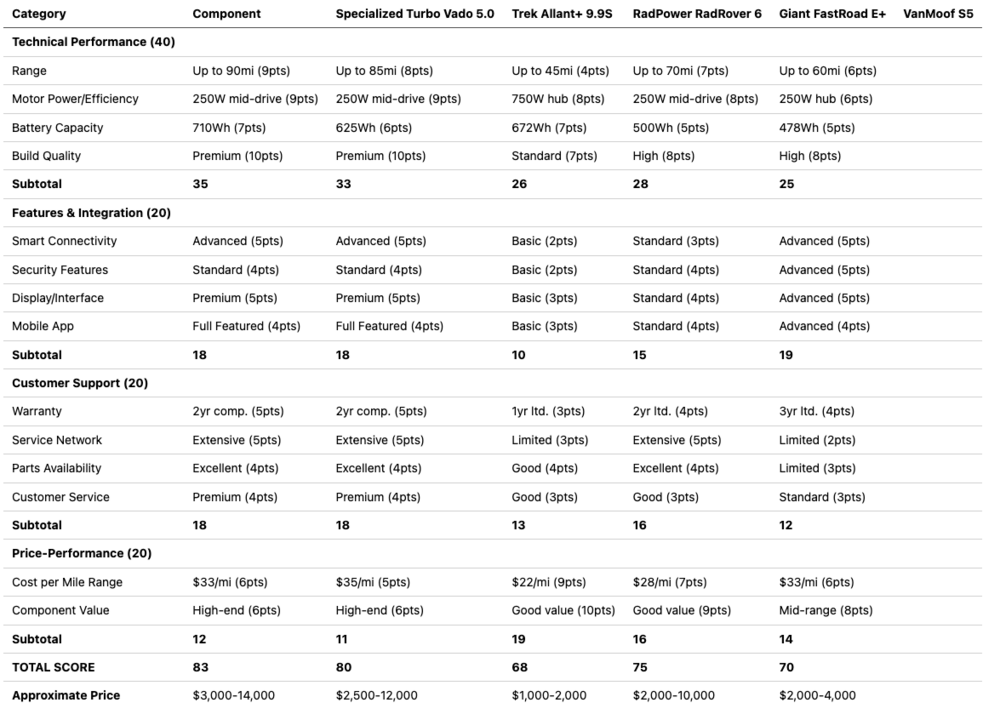
[[File: | The e-bike market shows clear segmentation across price points and value propositions, with distinct tradeoffs between technical performance, features, support, and price. | ||
Key insights from the value comparison: | |||
'''''Market Segmentation:''''' | |||
# Premium: Specialized, Trek (high quality, extensive features) | |||
# Mid-range: Giant (good value/price balance) | |||
# Value: RadPower (competitive pricing, direct sales) | |||
# Tech-focused: VanMoof (unique features, design-oriented) | |||
'''''Value Propositions:''''' | |||
* Specialized: Premium quality, advanced technology, extensive dealer network | |||
* Trek: Strong brand, reliable performance, comprehensive warranty | |||
* RadPower: Affordability, direct-to-consumer efficiency | |||
* Giant: Mass market appeal, reliable performance | |||
* VanMoof: Urban design, integrated smart features | |||
'''''Price-Value Relationship:''''' | |||
* Higher price points generally correlate with higher value scores | |||
* Some brands like RadPower achieve good value scores at lower price points | |||
* Premium brands justify higher prices through additional features and support | |||
=====Value Score Calculations===== | |||
[[File:valuecalc.png|1000px|center]] | |||
[[File: | The size of each bubble represents relative market presence, showing that established brands like Giant maintain large market share despite mid-range positioning. While premium brands score highest overall, each segment offers distinct value propositions matching different customer needs and preferences. The market clearly differentiates between brands optimizing for performance, price, or innovation. | ||
[[File:updatedvaluetocustomers.png|800px|center]] | |||
==Technical Model: Morphological Matrix and Tradespace== | ==Technical Model: Morphological Matrix and Tradespace== | ||
| Line 110: | Line 211: | ||
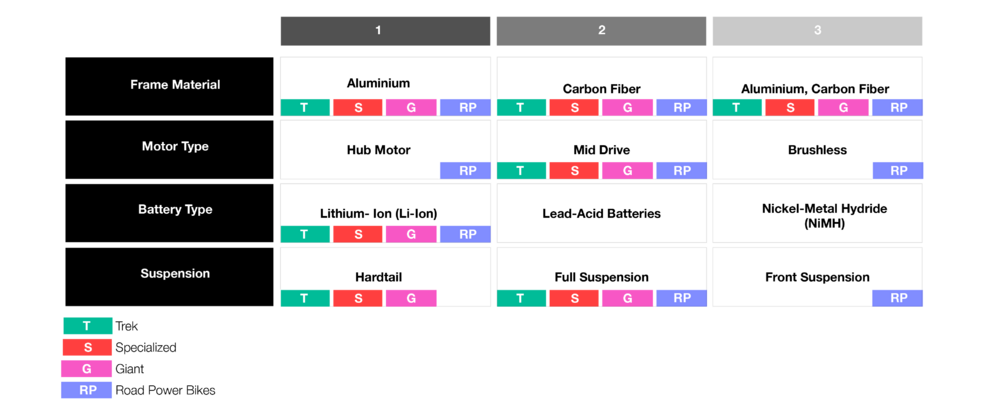
Below is a morphological matrix for leading e-bike manufacturers: Trek, Specialized, Giant, and Rad Power Bikes. This matrix outlines the different design choices each company makes across various components. A myriad of different component decisions must be considered when designing an e-bike. We chose the top four of the most important decision areas in the matrix below. For each, we listed three possible solution types under each component. | Below is a morphological matrix for leading e-bike manufacturers: Trek, Specialized, Giant, and Rad Power Bikes. This matrix outlines the different design choices each company makes across various components. A myriad of different component decisions must be considered when designing an e-bike. We chose the top four of the most important decision areas in the matrix below. For each, we listed three possible solution types under each component. | ||
[[File:E-bike morphological matrix.png|1000px]] | [[File:E-bike morphological matrix v2.png|1000px|center]] | ||
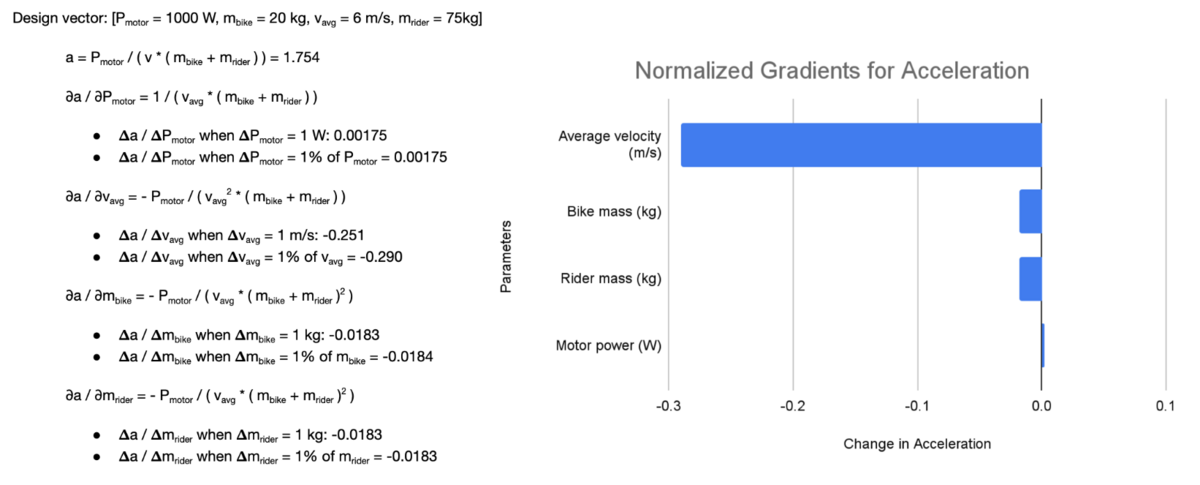
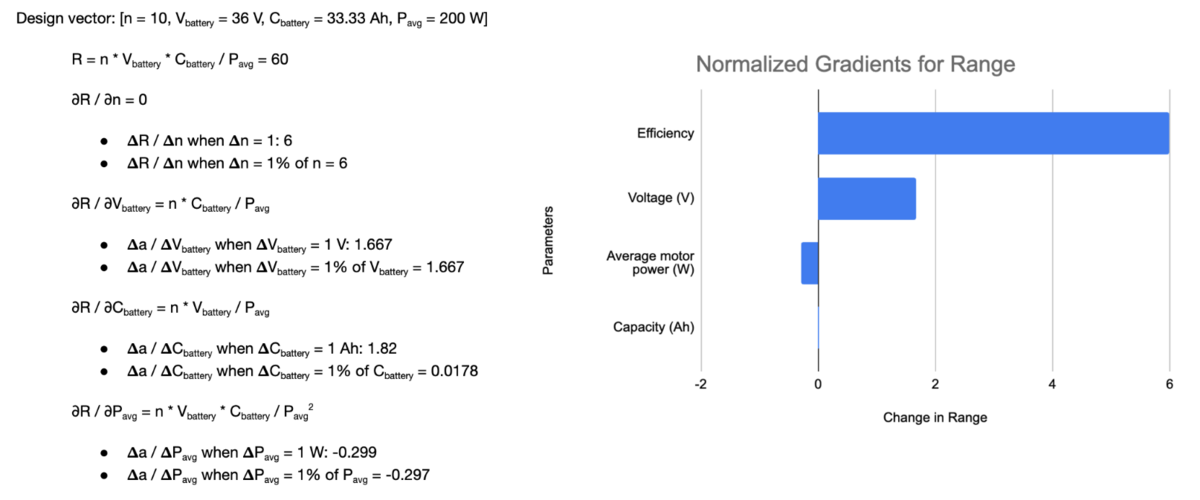
===Governing Equations=== | |||
We also provide two a mathematical breakdown of two governing equations for the e-bike space: acceleration and range. | |||
====Acceleration==== | |||
[[File:acceleration2.png|1200px|center]] | |||
====Range==== | |||
[[File:Range2.png|1200px|center]] | |||
==Keys Publications and Patents== | ==Keys Publications and Patents== | ||
<b> Patent Analysis </b> | |||
The search for relevant patents was initially conducted using keywords such as “ebike” and “electronic bicycle” using the US Patent and Trademark Office Patent Public Search tool, as well as Google Scholar and Google Patent. This revealed hundreds of records, many of which were related to the growth of technology and, more so on the growth of the space in recent years. To better focus on more relevant technologies, the search focused on more recent updates in the technology, especially targeting component updates, such as electronic integrations, connectivity, and battery. This revealed a smaller subset of patents with more direct ties to recent designs. | The search for relevant patents was initially conducted using keywords such as “ebike” and “electronic bicycle” using the US Patent and Trademark Office Patent Public Search tool, as well as Google Scholar and Google Patent. This revealed hundreds of records, many of which were related to the growth of technology and, more so on the growth of the space in recent years. To better focus on more relevant technologies, the search focused on more recent updates in the technology, especially targeting component updates, such as electronic integrations, connectivity, and battery. This revealed a smaller subset of patents with more direct ties to recent designs. | ||
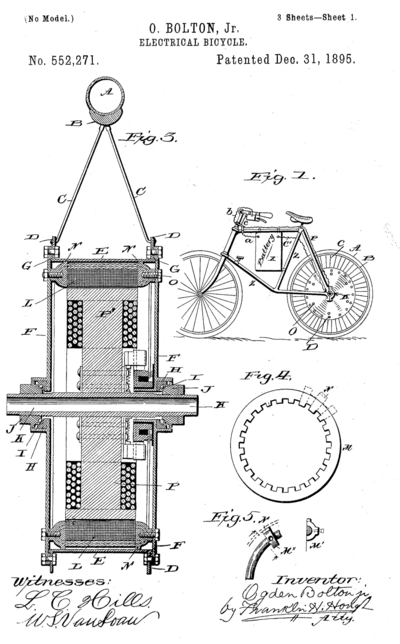
<b><u>Patent:</b> </u> "Electrical Bicycle [https://patents.google.com/patent/US552271]" <br> | |||
<b>Patent #:</b> US552271 </br> | |||
<b>Date of Patent:</b> December 31, 1895 </br> | |||
<b>Patent Owner:</b> Ogden Bolton Jr. <br> | |||
<b>Details: </b> The patent filed by Ogden Bolton Jr. represents the first documented invention of an electric bicycle. It introduced the concept of a hub motor, integrated into the rear wheel, which directly powered the bicycle using a lead-acid battery. The motor's speed was controlled via a rheostat mounted on the handlebars, enabling user-adjustable propulsion. This design emphasized simplicity, with no gears or manual propulsion options. | |||
<br> | |||
<b>Key Takeaways:</b> | |||
* One of the first documented concepts for an electric bicycle. | |||
* Focused on simplicity and compactness, pioneering the integration of batteries and motors into the bike frame. | |||
* Limited by battery technology of the time, relying on sulfuric acid batteries, which were bulky and inefficient. | |||
* No significant e-bike systems existed at this time, making this patent a cornerstone for future designs. | |||
[[File:US552271A.png|400px|center]] | |||
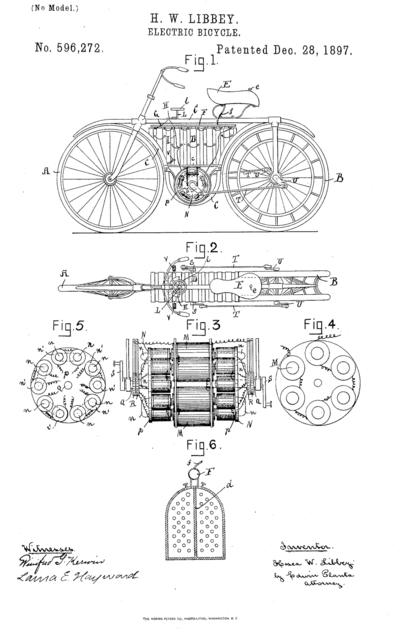
<b><u>Patent:</b> </u> "Electrical Bicycle [https://patents.google.com/patent/US596272]" <br> | |||
<b>Patent #:</b> US596272 </br> | |||
<b>Date of Patent:</b> December 28, 1897 </br> | |||
<b>Patent Owner:</b> Hosea W. Libbey <br> | |||
<b>Details: </b> Hosea W. Libbey’s patent refined the e-bike concept introduced by Bolton by adding features aimed at enhancing stability and operational efficiency. This design featured a dual-motor system integrated into the rear wheel, powered by two primary batteries. Riders could switch between batteries or use both simultaneously, depending on the terrain. Additionally, Libbey's duplex tread design improved balance and reduced the risk of tipping over. | |||
<br> | |||
<b>Key Takeaways:</b> | |||
* Refinement of the Hub Motor Concept: Built on Bolton's single-motor design by introducing dual motors for improved power distribution. | |||
* Dual Battery System: Allowed riders to adapt to different terrains, showcasing early attempts to enhance operational flexibility. | |||
* Focus on Stability: The duplex tread design addressed potential safety concerns, particularly for uneven or challenging terrain. | |||
* Complexity: While innovative, the dual-motor and battery system made the design harder to scale or commercialize at the time. | |||
* Prior Art: Improved upon Bolton's 1895 design by addressing its limitations, particularly in power delivery and stability. | |||
[[File:US596272A.png|400px|center]] | |||
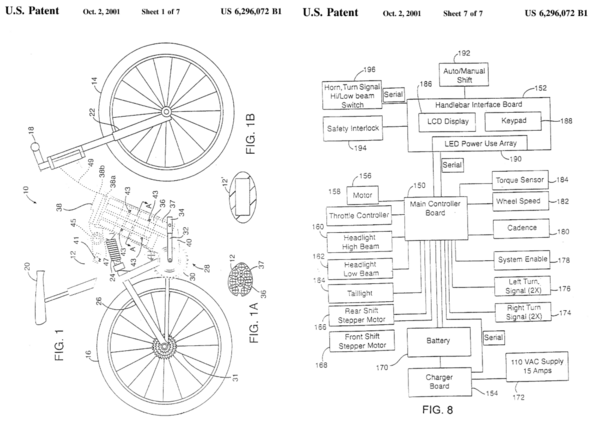
<b><u>Patent:</b> </u> "Electric Bicycle and Methods [https://patents.google.com/patent/US6296072B1/en?oq=US6296072]" <br> | |||
<b>Patent #:</b> US6296072 </br> | |||
<b>Date of Patent:</b> October 2, 2001 </br> | |||
<b>Patent Owner:</b> James R. Turner <br> | |||
<b>Details: </b> This patent by James R. Turner revolutionized e-bikes with an electric assist motor integrated into the bottom bracket. It introduced gears to improve motor efficiency, extending battery life. The design emphasized compatibility with existing bicycle equipment and featured a modular motor system with integrated clutch and gear reduction mechanisms. | |||
<br> | |||
<b>Key Takeaways:</b> | |||
* Advanced e-bike efficiency with the use of gear systems and modular motor designs. | |||
* Supported manual, motor-assisted, or hybrid modes, increasing user flexibility. | |||
* Improved aesthetics and functionality by integrating batteries into the bike frame and reducing unsprung weight. | |||
* Prior Art: Built on earlier concepts of motorized bicycles, such as hub motors, but emphasized efficiency and integration, making it a modern benchmark. | |||
[[File:ebikepatent3.png|600px|center]] | |||
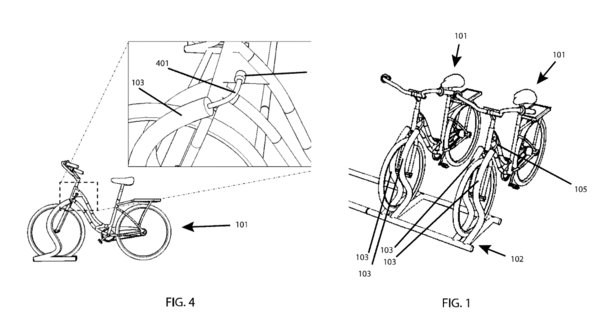
<b><u>Patent:</b> </u> "System and Method for Bicycle Sharing and Rental [https://patents.google.com/patent/US9567025B2]" <br> | |||
<b>Patent #:</b> US6296072 </br> | |||
<b>Date of Patent:</b> October 8, 2015 </br> | |||
<b>Patent Owner:</b> Ansgar Varick Strother, Keith Ballew Porter <br> | |||
<b>Details: </b> Introduces an innovative approach to secure, efficient bicycle-sharing systems. The invention focuses on rack-based docking systems, user authentication, and centralized management to address challenges like theft, misuse, and operational inefficiency in urban environments. Key features include a rack design that prevents unauthorized use, bicycles equipped with controllable locking mechanisms, and real-time monitoring to optimize fleet distribution. | |||
<br> | |||
<b>Key Takeaways:</b> | |||
* Secure Rack Design: Prevents unauthorized docking or locking, reducing theft and misuse. | |||
* Integrated Bicycle Features: Automated locking and unlocking enhance ease of use. | |||
* User Authentication: Apps, cards, or codes ensure only registered users access bicycles. | |||
* Centralized Management: Real-time inventory tracking optimizes fleet distribution. | |||
* Influence on Modern Systems: Inspired features in current bike-sharing programs like CitiBike and Lime, emphasizing security and operational efficiency. | |||
[[File:bikesharingpatent2.png|600px|center]] | |||
[[File:E-bike market forecast.png| | ====Additinal Market Insights for E-Bike Market around Ridesharing==== | ||
Digging further into the e-bike space, data came from 'Stastisa' and 'Markets and Markets' provided an overall view of the space and market sizing. The initial market size valuation 2024 is valued at $48.7B and is expected to reach $71.5B by 2030, growing at a CAGR of 6.6%. This indicates that the global demand for e-bikes has increased rapidly, especially during COVID-19, as users saw them as a low-cost, eco-friendly solution for commuting. Government bodies worldwide have also supported initiatives for bicycle infrastructure, such as integrated lanes in urban environments. | |||
[[File:E-bike market forecast.png|750px|center|Image credit to Stastisa]] | |||
[https://www.marketsandmarkets.com/Market-Reports/electric-bike-market-110827400.html MarketandMarkets|center] | |||
For publications, it was valuable to dive deep into the core of micromobility and the drivers behind more short-term transport. For example, the trip distance metrics and feasibility analysis of computed distributions of trip distances for bike, taxi, and FHV car-sharing datasets should be reviewed. It was valuable to understand some key needs and areas of competition necessary for future improvements in the roadmap. | For publications, it was valuable to dive deep into the core of micromobility and the drivers behind more short-term transport. For example, the trip distance metrics and feasibility analysis of computed distributions of trip distances for bike, taxi, and FHV car-sharing datasets should be reviewed. It was valuable to understand some key needs and areas of competition necessary for future improvements in the roadmap. | ||
[[File:Trip duration distribution.png|1000px]] | [[File:Trip duration distribution.png|1000px|center]] | ||
==Financial Model== | ==Financial Model== | ||
===Market Growth and Revenue Trajectory=== | |||
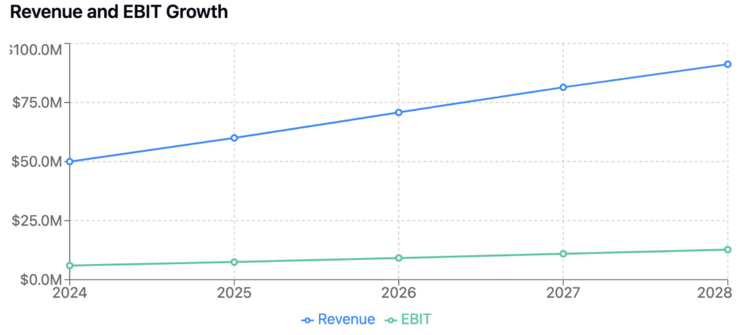
The e-bike industry projects robust growth from $50 million in 2024 to $91.2 million by 2028, following a CAGR that moderates from 22% to 12% as the market matures. This growth trajectory, while showing natural market evolution, remains significantly higher than traditional manufacturing industries, reflecting strong sustained demand for e-bikes and related technologies. The pattern accounts for increasing market penetration, growing consumer acceptance of e-bikes as primary transportation solutions, and expanding applications across both consumer and commercial sectors. | |||
[[File:RevenueandEBITgrowth.png|750px|center]] | |||
===Research and Development Investment Framework=== | |||
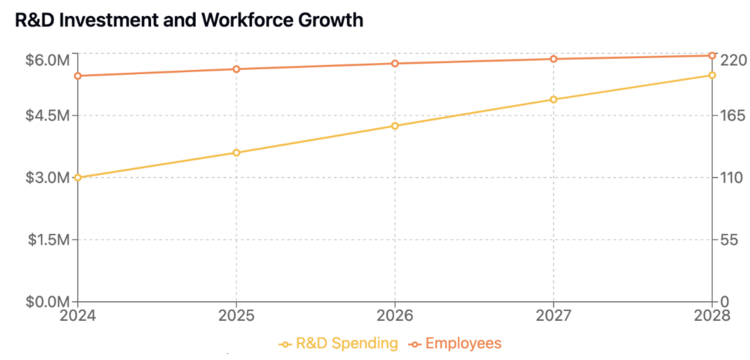
The e-bike industry maintains a strategic R&D intensity of 6% of revenue, with investment growing from $3 million in 2024 to $5.47 million in 2028, significantly exceeding traditional bicycle industry rates. This elevated R&D commitment reflects the technology-intensive nature of e-bikes and the constant need for innovation in a competitive market while balancing technological leadership with financial sustainability. The consistent 6% R&D intensity throughout the period demonstrates a long-term commitment to innovation and product development, ensuring continuous improvement in key performance areas while supporting new feature development and manufacturing optimization. | |||
== | [[File:RDInvestment.png|750px|center]] | ||
===Strategic R&D Investment Allocation=== | |||
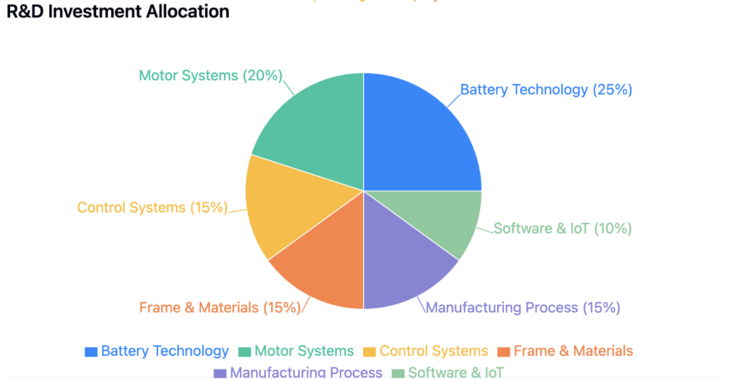
The R&D budget is strategically distributed across six key technology areas, with the largest allocations directed to battery technology (25%) and motor systems (20%), reflecting their critical importance in market competitiveness. The remaining budget is balanced across control systems, frame and materials development, and manufacturing process improvements (15% each), with 10% dedicated to software and IoT integration, creating a comprehensive innovation strategy. This allocation acknowledges battery and motor technology as primary differentiators while maintaining strategic investment in manufacturing efficiency, structural innovations, and digital capabilities, positioning manufacturers for sustainable competitive advantage in an evolving market. | |||
[[File:RDInvestmentAllocation.png|750px|center]] | |||
==Future Projects and R&Ds== | |||
# [https://doee.dc.gov/release/request-applications-e-bike-solar-charging-demonstration-project E-Bike Solar Charging Demonstration]: Sponsored by the Department of Energy and Environment, this aims to increase mobility options to shift away from single occupancy vehicles, improve air quality, and reduce greenhouse gas emissions. | |||
# [https://radpowerbikes.eu/pages/the-rad-lab Rad Power Bikes' Rad Lab]: An R&D facility focused on designing and testing e-bike components. The lab emphasizes rigorous testing protocols, including fatigue, durability, and impact assessments, to ensure product reliability and performance. | |||
# [https://mahle-smartbike.com/news-event/mahle-smartbike-systems-rd-projects/ MAHLE SmartBike Systems R&D Projects]: Key objectives include developing ultralight and ultra-efficient systems, innovating 43V battery concepts, and creating new solutions with 43V e-bike motors. | |||
# [https://global.yamaha-motor.com/design_technology/technology/news/TY-E/ Yamaha's TY-E Electric Trials Bike]: Through its "Evolving R&D" initiative, this project explores the potential of electric vehicles in trials competition, focusing on delivering powerful low-end torque and responsive acceleration. This is used for testing and refining electric propulsion technologies in competitive settings to further the technology. | |||
# [https://www.triumphmotorcycles.com/for-the-ride/brand/project-triumph-te-1/phase-2 Project Triumph TE-1]: The main objectives include developing electric motorcycle capabilities, innovative integrated solutions, and creating UK electric motorcycle capability. | |||
# [https://batteryindustry.net/korean-ev-battery-waste-remanufacturer-poen-secures-28-million-in-series-b-investment/ POEN Battery Remanufacture]: To lead the eco-friendly battery industry by commercializing technology for remanufacturing electric vehicle waste batteries, establishing a robust environmental protection foundation, achieving a global standard circular economy, and focusing on sustainable practices in the electric vehicle industry. | |||
# [https://www.nottingham.ac.uk/research/beacons-of-excellence/propulsion-futures/themes/high-impact-demonstrators/index.aspx University of Nottingham's High Impact Demonstrators]: Designed to to validate low-weight, high-energy-density powertrains for electric motorcycles. Their e-bike prototype placed second at the Isle of Man TT Zero, averaging close to 120 mph, demonstrating significant advancements in their electric motorbike performance. | |||
# [https://www.prnewswire.com/news-releases/soteria-battery-innovation-group-files-patent-on-technology-to-battle-e-bike-fires-302249228.html Soteria E-Bike Battery Safety]: To reduce the risk of e-bike battery fires by developing a thermally insulating, fire-retardant blanket for battery cells, thereby improving overall battery safety. | |||
# [https://web.mit.edu/6.101/www/s2019/projects/bengutie_Project_Design_Presentation.pdf MIT's E-Bike Speed Controller with Regenerative Braking]: Researchers at MIT designed a speed controller for e-bike motors that incorporates regenerative braking. This project aims to enhance energy efficiency by recharging the battery during braking, contributing to extended range and improved performance. | |||
# [https://stories.orbea.com/en/oolab-expands-its-limits-to-develop-ebikes-of-the-future/ Orbea Optimization Lab (OOLab)]: Started in 2022, OOLab is Orbea's R&D program for electric mountain bikes. They work with Shimano and focus on enhancing systems (e.g. motors, drivetrains, and batteries) to push the limits of e-bike performance. | |||
==Technology Strategy Statement== | ==Technology Strategy Statement== | ||
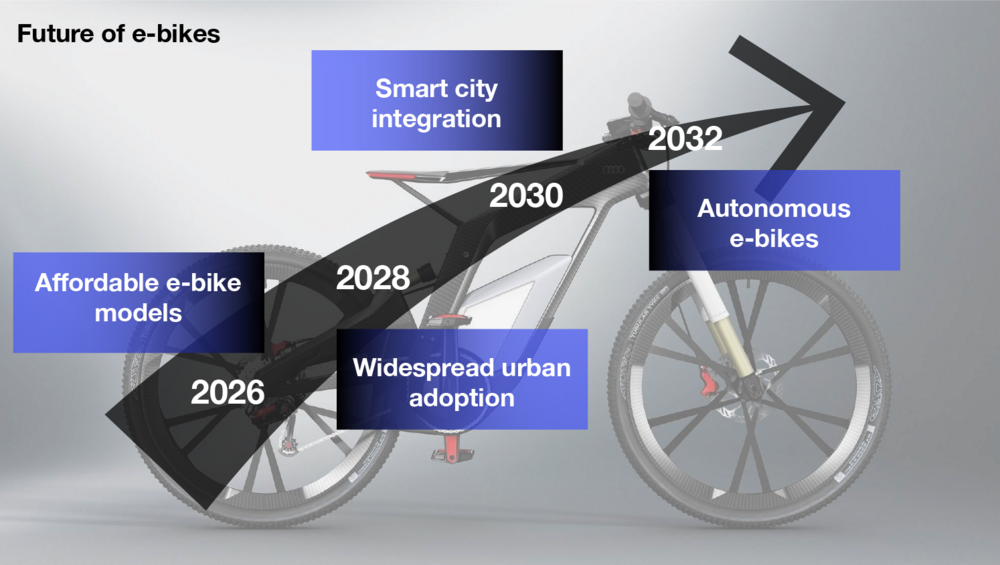
The target is to develop next-generation electric bicycles that revolutionize urban mobility through progressive technological advancement and seamless integration with smart city infrastructure. Achieving autonomous e-bike capabilities requires advances in underlying technologies like battery efficiency, lightweight materials, smart connectivity, and AI-driven systems. The roadmap spans from near-term goals of achieving 50 km range and implementing basic smart features, through mid-term objectives of enhancing efficiency and adopting sustainable practices, to long-term aims of full smart city integration and autonomy. In the next 1-2 years, there will be a focus on affordability and fundamental improvements, including lightweight frames and fast charging. The subsequent 3-5 years will see the development of self-balancing technology, AI-driven maintenance, and significant increases in motor efficiency, alongside a strong push for sustainability with highly recyclable components. The 6-10 year vision culminates in the implementation of solid-state batteries, extended battery life spans, and autonomous navigation systems fully integrated with smart city infrastructure. This progression will enable data-driven mobility that bypasses traffic, reduces parking needs, and improves urban flow, making e-bikes more attractive for daily use while significantly lowering CO2 emissions. The strategy aims to transform urban transit, offering a sustainable, efficient, and technologically advanced alternative that seamlessly integrates with the smart cities of the future. | |||
[[File:TechStatement.png|1000px|center]] | |||
Latest revision as of 19:59, 5 December 2024
The e-Bike (2EBK) roadmap is a level 2 roadmap focusing on specific micromobility solutions (e.g., shared electric scooters, e-bikes). It is situated under the level 1 micromobility system market, representing the broader urban mobility market. Below e-Bikes exists the level 3 roadmaps that target the subsystems within these solutions (e.g., powertrain, connectivity, structural), and level 4 roadmaps delve into individual components (e.g., battery cells, sensors, motors).
Technology Roadmap Overview
Electric bicycles (e-bikes) are a key component of the micromobility revolution, offering electric-assisted cycling at speeds typically below 25 km/h (15 mph). These vehicles represent a significant advancement in urban transportation, providing a flexible and sustainable solution for short to medium-distance travel in city environments. The history of e-bikes traces back to the late 19th century, with early patents for electrically powered bicycles emerging in the 1890s. However, the modern e-bike era truly began in 1989 when Michael Kutter developed the Velocity Commuter, one of the first bikes with pedal-assist technology.
Two iconic e-bikes that represented significant milestones in the development of e-bikes are the Yamaha PAS (1993)- widely considered the first commercially successful e-bike, introducing the revolutionary pedal-assist motor system and the RadRover by Rad Power Bikes (2015)- an iconic model that helped popularize affordable e-bikes for everyday use, making the technology more accessible to consumers.
E-Bike Evolution
Significant technological developments around e-bikes are illustrated in the table below.
| Era | Year | Key Development | Enabling Technology |
|---|---|---|---|
| Early Bicyle | 1817 | First "Draisine" | Human-powered mechanical propulsionAcceleration |
| Mechanical Era | 1860s | Chain-drive bicycle | Metal fabrication, gear systems |
| Electric Patents | 1895 | First e-bike patent (Bolton) | DC motor, lead-acid batteries |
| Early Production | 1930s-1980s | Limited commercial attempts | Crude motor/battery systems |
| Modern Foundation | 1989-1993 | Yamaha Power Assist System | Power control systems, sensors |
| Mass Market | 1990s-2000s | Practical e-bikes emerge | Li-ion batteries, efficient motors |
| Smart Integration | 2010-2020 | Connected e-bikes | Mobile apps, IoT, cloud computing |
| Next Generation | 2020+ | Advanced e-mobility | AI/ML, advanced batteries, lightweight materials |
Key Components
E-bikes integrate electric propulsion with traditional bicycle mechanics to create an efficient hybrid transportation solution. The core technology combines electric motors providing pedal assistance up to 25 km/h with advanced battery and control systems. Key subsystems include:
- Electric propulsion systems (motors, controllers)
- Energy storage and management (batteries, charging systems)
- Structural systems (frames, components)
- Connectivity and smart features
Market Evolution
Today, an entire operating model and system is designed around not only e-bike manufacturers but also the broader micromobility system.
E-bikes are at the forefront of smart mobility solutions, interfacing with user data and contextual information to enhance the riding experience. The industry is also exploring autonomous features and improved integration with smart city infrastructure. As urban planners focus on sustainable transportation, e-bikes are becoming central to city development strategies, from revitalizing historic city centers to shaping innovative urban projects. Their role in reducing traffic congestion, lowering emissions, and promoting active lifestyles positions e-bikes as a crucial element in the future of experiential urban mobility.
This roadmap examines the technological development pathway for these subsystems, focusing on near-term improvements and longer-term innovations that will define next-generation e-bikes. Critical areas include battery technology advancement, motor efficiency, weight reduction, and smart system integration.
Design Structure Matrix (DSM) Allocation
E-bikes can be broken down into the following technologies and inter-dependencies. E-bikes fall into the general category of electric vehicles. Some components have many more interdependencies than others (e.g. the battery), showing that improvements to some key components can have bigger improvements on the overall e-bike.
1EV - Electric Vehicle
- 2EBK - Electric Bike
- 3FRM - Frame
- 4BRK - Brakes
- 4WHL - Wheels
- 4FRK - Forks
- 3PS - Power System
- 4BAT - Battery
- 4CP - Charging Port
- 3EC - Electric Components
- 4DSP - Display
- 4LIT - Lighting
- 4CTL - Controller
- 4SNS - Sensors
- 4SFT - Software/Firmware
- 3DM - Drive Module
- 4PDL - Pedals
- 4CHN - Chain
- 4GR - Gears
- 4PAS - Pedal Assist System
- 4TRL - Throttle
- 4MOT - Motor
- 3FRM - Frame
Roadmap Model using OPM
Below, we provide an object-process diagram (OPD) of the 2BKE roadmap. This diagram captures the main object of the roadmap, its decomposition into subsystems (powertrain, connectivity, structural, etc.), its characterization by Figures of Merit (FOMs), as well as the main processes and actors involved.
Figures of Merit
This table outlines the key metrics for evaluating the performance and effectiveness of micromobility systems.
| Figure of Merit (FOM) | Unit | Description |
|---|---|---|
| Acceleration | m/s^2 | The acceleration that the vehicle is capable of. |
| Range per charge | m | The distance that the vehicle is able to travel on a single charge. |
| Pedal Assistance | watts | Measures how much the e-bike is assisting when pedaling. |
| Utilization Rate | rides/vehicle/day | Indicates how frequently a vehicle is used on average in a shared system. |
| Trip Duration | minutes | Represents the average time taken for a typical trip by users. |
| Trip Distance | meters | Measures the average distance covered during a single trip. |
| Per-Unit Operational Cost | $/ride | Calculates the cost associated with maintaining and operating the vehicle for each ride. |
| Downtime | hours | Represents the amount of time a vehicle is unavailable for use, typically due to maintenance or charging. |
Alignment with Company Strategic Drivers: FOM targets
Overview
The table below provides the high-level strategic drivers and alignment for the 1MMS and 2EBK technology roadmap. There are additional detailed drivers that provide more context for the FOM targets with a multi-horizon lens.
| Number | Strategic Driver | Alignment |
|---|---|---|
| 1 | Urban Mobility and Smart City Integration: Increasing congestion and the need for flexible last-mile solutions highlight e-bikes as a compact, efficient option. | E-bikes allow users to bypass traffic, reduce parking needs, and improve the flow of urban transport, meeting the demand for quick, point-to-point solutions in crowded city centers. This creates a data-driven mobility solution that supports safer, sustainable urban living. |
| 2 | Advancements in Technology and Manufacturing: Support the battery, motor systems, and electronic controls for more optimal and efficient electric transportation systems | Advances in battery technology, motor efficiency, and lightweight materials enable extended range, improved speed, and reduced recharging times, making e-bikes a more attractive, competitive choice for daily commutes and recreational use. |
| 3 | Environmental Sustainability Impact: As cities strive to meet emissions targets and reduce pollution, e-bikes present an environmentally friendly alternative to short car trips. | Sustainable urban transit with electric-powered bicycles that significantly lower CO₂ emissions. |
By focusing on these strategic drivers and capability milestones, the e-bike industry can continue to innovate and expand its market presence over the next decade, addressing key challenges in urban mobility, sustainability, and technological integration.
Strategic Driver FOM Targets by Time Horizon
The following is a detailed list of FOM targets by time horizon relative to the broader technology roadmap that connects to the strategic drivers. The planned roadmap would take a phased horizon approach with separate swimlanes for various technical, system integration, and connectivity drivers.
| Time Horizon | FOM Targets |
|---|---|
| Near-term |
|
| Mid-term |
|
| Long-term |
|
The figure below is a representation of the roadmap that is currently being built:
Positioning of Company vs. Competition
To effectively position our e-bike offering within the micromobility market, analyzing the value provided to customers against the cost incurred by producers is essential. Below is a conceptual representation of this relationship, highlighting our position relative to key competitors:
| Brand | “Company” | Rad Power | Trek | Specialized | Giant |
|---|---|---|---|---|---|
| Best Seller | “Model X” | RadRover 6 | Allant+ 9.9S | Turbo Vado 5.0 | FastRoad E+ EX Pro |
| Bike Weight (kg) | Targets TBD | 32.2 | 23.4 | 25.4 | 18.6 |
| Charge Time (hrs) | Targets TBD | 6 | 4.5 | 4 | 5 |
| Range (km) | Targets TBD | 72-88 | 120-180 | 145 | 120-180 |
| Battery Capacity (Wh) | Targets TBD | 672 | 625 | 710 | 500 |
| Price Range | Targets TBD | $1,000-2,000 | $2,500-12,000 | $3,000-$14,000 | $2,000-10,000 |
| Value to Customer | Targets TBD | Medium | High | High | Medium |
| Cost to Producer | Targets TBD | Low | High | High | Medium |
Value to Customers
We aim to occupy a unique position by delivering high customer value through innovative features and affordability while keeping production costs manageable. This strategy aims to attract a broad user base seeking cost-effective and efficient urban transportation solutions.
The e-bike market shows clear segmentation across price points and value propositions, with distinct tradeoffs between technical performance, features, support, and price. Key insights from the value comparison:
Market Segmentation:
- Premium: Specialized, Trek (high quality, extensive features)
- Mid-range: Giant (good value/price balance)
- Value: RadPower (competitive pricing, direct sales)
- Tech-focused: VanMoof (unique features, design-oriented)
Value Propositions:
- Specialized: Premium quality, advanced technology, extensive dealer network
- Trek: Strong brand, reliable performance, comprehensive warranty
- RadPower: Affordability, direct-to-consumer efficiency
- Giant: Mass market appeal, reliable performance
- VanMoof: Urban design, integrated smart features
Price-Value Relationship:
- Higher price points generally correlate with higher value scores
- Some brands like RadPower achieve good value scores at lower price points
- Premium brands justify higher prices through additional features and support
Value Score Calculations
The size of each bubble represents relative market presence, showing that established brands like Giant maintain large market share despite mid-range positioning. While premium brands score highest overall, each segment offers distinct value propositions matching different customer needs and preferences. The market clearly differentiates between brands optimizing for performance, price, or innovation.
Technical Model: Morphological Matrix and Tradespace
Below is a morphological matrix for leading e-bike manufacturers: Trek, Specialized, Giant, and Rad Power Bikes. This matrix outlines the different design choices each company makes across various components. A myriad of different component decisions must be considered when designing an e-bike. We chose the top four of the most important decision areas in the matrix below. For each, we listed three possible solution types under each component.
Governing Equations
We also provide two a mathematical breakdown of two governing equations for the e-bike space: acceleration and range.
Acceleration
Range
Keys Publications and Patents
Patent Analysis The search for relevant patents was initially conducted using keywords such as “ebike” and “electronic bicycle” using the US Patent and Trademark Office Patent Public Search tool, as well as Google Scholar and Google Patent. This revealed hundreds of records, many of which were related to the growth of technology and, more so on the growth of the space in recent years. To better focus on more relevant technologies, the search focused on more recent updates in the technology, especially targeting component updates, such as electronic integrations, connectivity, and battery. This revealed a smaller subset of patents with more direct ties to recent designs.
Patent: "Electrical Bicycle [1]"
Patent #: US552271
Date of Patent: December 31, 1895
Patent Owner: Ogden Bolton Jr.
Details: The patent filed by Ogden Bolton Jr. represents the first documented invention of an electric bicycle. It introduced the concept of a hub motor, integrated into the rear wheel, which directly powered the bicycle using a lead-acid battery. The motor's speed was controlled via a rheostat mounted on the handlebars, enabling user-adjustable propulsion. This design emphasized simplicity, with no gears or manual propulsion options.
Key Takeaways:
- One of the first documented concepts for an electric bicycle.
- Focused on simplicity and compactness, pioneering the integration of batteries and motors into the bike frame.
- Limited by battery technology of the time, relying on sulfuric acid batteries, which were bulky and inefficient.
- No significant e-bike systems existed at this time, making this patent a cornerstone for future designs.
Patent: "Electrical Bicycle [2]"
Patent #: US596272
Date of Patent: December 28, 1897
Patent Owner: Hosea W. Libbey
Details: Hosea W. Libbey’s patent refined the e-bike concept introduced by Bolton by adding features aimed at enhancing stability and operational efficiency. This design featured a dual-motor system integrated into the rear wheel, powered by two primary batteries. Riders could switch between batteries or use both simultaneously, depending on the terrain. Additionally, Libbey's duplex tread design improved balance and reduced the risk of tipping over.
Key Takeaways:
- Refinement of the Hub Motor Concept: Built on Bolton's single-motor design by introducing dual motors for improved power distribution.
- Dual Battery System: Allowed riders to adapt to different terrains, showcasing early attempts to enhance operational flexibility.
- Focus on Stability: The duplex tread design addressed potential safety concerns, particularly for uneven or challenging terrain.
- Complexity: While innovative, the dual-motor and battery system made the design harder to scale or commercialize at the time.
- Prior Art: Improved upon Bolton's 1895 design by addressing its limitations, particularly in power delivery and stability.
Patent: "Electric Bicycle and Methods [3]"
Patent #: US6296072
Date of Patent: October 2, 2001
Patent Owner: James R. Turner
Details: This patent by James R. Turner revolutionized e-bikes with an electric assist motor integrated into the bottom bracket. It introduced gears to improve motor efficiency, extending battery life. The design emphasized compatibility with existing bicycle equipment and featured a modular motor system with integrated clutch and gear reduction mechanisms.
Key Takeaways:
- Advanced e-bike efficiency with the use of gear systems and modular motor designs.
- Supported manual, motor-assisted, or hybrid modes, increasing user flexibility.
- Improved aesthetics and functionality by integrating batteries into the bike frame and reducing unsprung weight.
- Prior Art: Built on earlier concepts of motorized bicycles, such as hub motors, but emphasized efficiency and integration, making it a modern benchmark.
Patent: "System and Method for Bicycle Sharing and Rental [4]"
Patent #: US6296072
Date of Patent: October 8, 2015
Patent Owner: Ansgar Varick Strother, Keith Ballew Porter
Details: Introduces an innovative approach to secure, efficient bicycle-sharing systems. The invention focuses on rack-based docking systems, user authentication, and centralized management to address challenges like theft, misuse, and operational inefficiency in urban environments. Key features include a rack design that prevents unauthorized use, bicycles equipped with controllable locking mechanisms, and real-time monitoring to optimize fleet distribution.
Key Takeaways:
- Secure Rack Design: Prevents unauthorized docking or locking, reducing theft and misuse.
- Integrated Bicycle Features: Automated locking and unlocking enhance ease of use.
- User Authentication: Apps, cards, or codes ensure only registered users access bicycles.
- Centralized Management: Real-time inventory tracking optimizes fleet distribution.
- Influence on Modern Systems: Inspired features in current bike-sharing programs like CitiBike and Lime, emphasizing security and operational efficiency.
Additinal Market Insights for E-Bike Market around Ridesharing
Digging further into the e-bike space, data came from 'Stastisa' and 'Markets and Markets' provided an overall view of the space and market sizing. The initial market size valuation 2024 is valued at $48.7B and is expected to reach $71.5B by 2030, growing at a CAGR of 6.6%. This indicates that the global demand for e-bikes has increased rapidly, especially during COVID-19, as users saw them as a low-cost, eco-friendly solution for commuting. Government bodies worldwide have also supported initiatives for bicycle infrastructure, such as integrated lanes in urban environments.
For publications, it was valuable to dive deep into the core of micromobility and the drivers behind more short-term transport. For example, the trip distance metrics and feasibility analysis of computed distributions of trip distances for bike, taxi, and FHV car-sharing datasets should be reviewed. It was valuable to understand some key needs and areas of competition necessary for future improvements in the roadmap.
Financial Model
Market Growth and Revenue Trajectory
The e-bike industry projects robust growth from $50 million in 2024 to $91.2 million by 2028, following a CAGR that moderates from 22% to 12% as the market matures. This growth trajectory, while showing natural market evolution, remains significantly higher than traditional manufacturing industries, reflecting strong sustained demand for e-bikes and related technologies. The pattern accounts for increasing market penetration, growing consumer acceptance of e-bikes as primary transportation solutions, and expanding applications across both consumer and commercial sectors.
Research and Development Investment Framework
The e-bike industry maintains a strategic R&D intensity of 6% of revenue, with investment growing from $3 million in 2024 to $5.47 million in 2028, significantly exceeding traditional bicycle industry rates. This elevated R&D commitment reflects the technology-intensive nature of e-bikes and the constant need for innovation in a competitive market while balancing technological leadership with financial sustainability. The consistent 6% R&D intensity throughout the period demonstrates a long-term commitment to innovation and product development, ensuring continuous improvement in key performance areas while supporting new feature development and manufacturing optimization.
Strategic R&D Investment Allocation
The R&D budget is strategically distributed across six key technology areas, with the largest allocations directed to battery technology (25%) and motor systems (20%), reflecting their critical importance in market competitiveness. The remaining budget is balanced across control systems, frame and materials development, and manufacturing process improvements (15% each), with 10% dedicated to software and IoT integration, creating a comprehensive innovation strategy. This allocation acknowledges battery and motor technology as primary differentiators while maintaining strategic investment in manufacturing efficiency, structural innovations, and digital capabilities, positioning manufacturers for sustainable competitive advantage in an evolving market.
Future Projects and R&Ds
- E-Bike Solar Charging Demonstration: Sponsored by the Department of Energy and Environment, this aims to increase mobility options to shift away from single occupancy vehicles, improve air quality, and reduce greenhouse gas emissions.
- Rad Power Bikes' Rad Lab: An R&D facility focused on designing and testing e-bike components. The lab emphasizes rigorous testing protocols, including fatigue, durability, and impact assessments, to ensure product reliability and performance.
- MAHLE SmartBike Systems R&D Projects: Key objectives include developing ultralight and ultra-efficient systems, innovating 43V battery concepts, and creating new solutions with 43V e-bike motors.
- Yamaha's TY-E Electric Trials Bike: Through its "Evolving R&D" initiative, this project explores the potential of electric vehicles in trials competition, focusing on delivering powerful low-end torque and responsive acceleration. This is used for testing and refining electric propulsion technologies in competitive settings to further the technology.
- Project Triumph TE-1: The main objectives include developing electric motorcycle capabilities, innovative integrated solutions, and creating UK electric motorcycle capability.
- POEN Battery Remanufacture: To lead the eco-friendly battery industry by commercializing technology for remanufacturing electric vehicle waste batteries, establishing a robust environmental protection foundation, achieving a global standard circular economy, and focusing on sustainable practices in the electric vehicle industry.
- University of Nottingham's High Impact Demonstrators: Designed to to validate low-weight, high-energy-density powertrains for electric motorcycles. Their e-bike prototype placed second at the Isle of Man TT Zero, averaging close to 120 mph, demonstrating significant advancements in their electric motorbike performance.
- Soteria E-Bike Battery Safety: To reduce the risk of e-bike battery fires by developing a thermally insulating, fire-retardant blanket for battery cells, thereby improving overall battery safety.
- MIT's E-Bike Speed Controller with Regenerative Braking: Researchers at MIT designed a speed controller for e-bike motors that incorporates regenerative braking. This project aims to enhance energy efficiency by recharging the battery during braking, contributing to extended range and improved performance.
- Orbea Optimization Lab (OOLab): Started in 2022, OOLab is Orbea's R&D program for electric mountain bikes. They work with Shimano and focus on enhancing systems (e.g. motors, drivetrains, and batteries) to push the limits of e-bike performance.
Technology Strategy Statement
The target is to develop next-generation electric bicycles that revolutionize urban mobility through progressive technological advancement and seamless integration with smart city infrastructure. Achieving autonomous e-bike capabilities requires advances in underlying technologies like battery efficiency, lightweight materials, smart connectivity, and AI-driven systems. The roadmap spans from near-term goals of achieving 50 km range and implementing basic smart features, through mid-term objectives of enhancing efficiency and adopting sustainable practices, to long-term aims of full smart city integration and autonomy. In the next 1-2 years, there will be a focus on affordability and fundamental improvements, including lightweight frames and fast charging. The subsequent 3-5 years will see the development of self-balancing technology, AI-driven maintenance, and significant increases in motor efficiency, alongside a strong push for sustainability with highly recyclable components. The 6-10 year vision culminates in the implementation of solid-state batteries, extended battery life spans, and autonomous navigation systems fully integrated with smart city infrastructure. This progression will enable data-driven mobility that bypasses traffic, reduces parking needs, and improves urban flow, making e-bikes more attractive for daily use while significantly lowering CO2 emissions. The strategy aims to transform urban transit, offering a sustainable, efficient, and technologically advanced alternative that seamlessly integrates with the smart cities of the future.


