Difference between revisions of "Sustainable Syngas"
| (4 intermediate revisions by 2 users not shown) | |||
| Line 60: | Line 60: | ||
Involves the integration of energy storage solutions (e.g., lithium-ion batteries or regenerative fuel cells) to manage the intermittent nature of renewable energy sources, ensuring a consistent energy supply for the syngas production process. | Involves the integration of energy storage solutions (e.g., lithium-ion batteries or regenerative fuel cells) to manage the intermittent nature of renewable energy sources, ensuring a consistent energy supply for the syngas production process. | ||
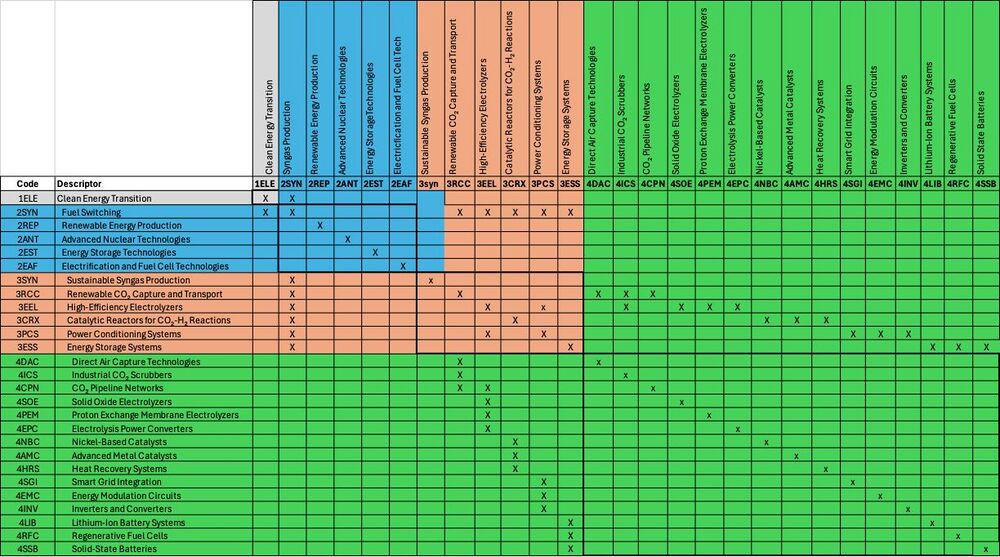
[[File:DSM | [[File:DSM UPDATED_rev1.jpeg|1000px|center|]] | ||
<strong><center> Figure 2.1: Design Structure Matrix </center></strong> | <strong><center> Figure 2.1: Design Structure Matrix </center></strong> | ||
| Line 69: | Line 69: | ||
==Roadmap Model using OPM== | ==Roadmap Model using OPM== | ||
Detailed below is the conceptual OPM model of the syngas production system. (a) System Diagram of the Syngas Production at Level 0 in OPM. (b) System Diagram obtained by zooming into processing. | |||
[[File:Syngas System OPM_L0.png|1000px|center|]] | |||
[[File:FY24Team4_OPM.png|600px|center|]] | [[File:FY24Team4_OPM.png|600px|center|]] | ||
| Line 148: | Line 154: | ||
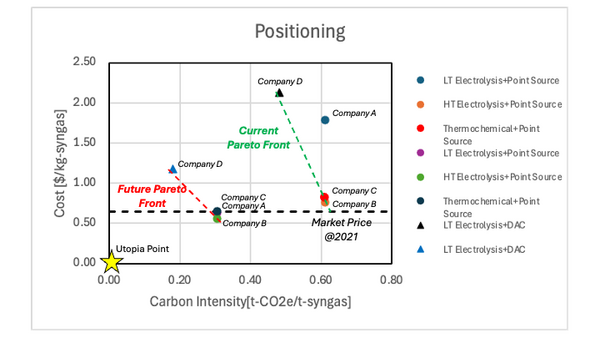
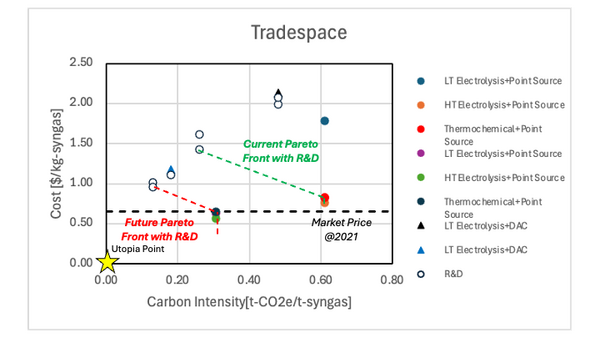
Figure 6.1 shows the positioning of the syngas production technologies. The future technologies will meet the market price of syngas. However, these technologies have high carbon intensity since the CO2 is embodied into the syngas. On the other hand, the carbon intensity is decreased when the CO2 is directly captured from the atmosphere. Since the current technology of DAC+LT electrolysis still has high cost, the technology development is required to be competitive to other technologies. | Figure 6.1 shows the positioning of the syngas production technologies. The future technologies will meet the market price of syngas. However, these technologies have high carbon intensity since the CO2 is embodied into the syngas. On the other hand, the carbon intensity is decreased when the CO2 is directly captured from the atmosphere. Since the current technology of DAC+LT electrolysis still has high cost, the technology development is required to be competitive to other technologies. | ||
[[File:FY24Team4_Figure6. | [[File:FY24Team4_Figure6.1_rev4.png|600px|center|]] | ||
<strong><center> Figure 6.1: Positioning of syngas production technologies </center></strong> | <strong><center> Figure 6.1: Positioning of syngas production technologies </center></strong> | ||
| Line 524: | Line 530: | ||
Based on the tradespace analysis (Figure 9.1) and the NPV analysis (Table 9.1), three R&D area are selected, i.e., Synthetic Fuel Applications, Carbon Management and Emissions, and Enhanced Conversion Technologies. First, the team will start Synthetic Fuel Applications project from 2025. The cost and the carbon intensity might not reach the targets, however, the team will focus on finding the early adopter of the technology to open the market. Second, in 2027, Enhanced Conversion Technologies project will be started. Since the project includes the catalyst development, the research is started before the demonstration for the future technical competitiveness. In 2030, The prototype is launched by implementing the developed technologies. The team will earn revenue from this stage, and validate the customer needs. At the same time, Carbon Management and Emissions project will be started to lower the CO2 feedstock cost and the carbon intensity. Finally, in 2040, all technologies are implemented into the scale-up facility, and the demonstration will be started. | Based on the tradespace analysis (Figure 9.1) and the NPV analysis (Table 9.1), three R&D area are selected, i.e., Synthetic Fuel Applications, Carbon Management and Emissions, and Enhanced Conversion Technologies. First, the team will start Synthetic Fuel Applications project from 2025. The cost and the carbon intensity might not reach the targets, however, the team will focus on finding the early adopter of the technology to open the market. Second, in 2027, Enhanced Conversion Technologies project will be started. Since the project includes the catalyst development, the research is started before the demonstration for the future technical competitiveness. In 2030, The prototype is launched by implementing the developed technologies. The team will earn revenue from this stage, and validate the customer needs. At the same time, Carbon Management and Emissions project will be started to lower the CO2 feedstock cost and the carbon intensity. Finally, in 2040, all technologies are implemented into the scale-up facility, and the demonstration will be started. | ||
[[File:FY24Team4_TechnologyStrategy.png| | [[File:FY24Team4_TechnologyStrategy.png|700px|center|]] | ||
<strong><center> Figure11.1: Technology Strategy Statement of Sustainable Syngas </center></strong> | <strong><center> Figure11.1: Technology Strategy Statement of Sustainable Syngas </center></strong> | ||
Latest revision as of 19:36, 3 December 2024
Technology Roadmap Sections and Deliverables
The technology roadmap identifier:
- 2SSG - Sustainable Syngas
The number 2 indicates that we built a "level 2" roadmap at the product level, where "level 1" would indicate a market level roadmap and “level 3” or “level 4” would indicate an individual technology roadmap.
Roadmap Overview
Synthesis gas (syngas) is a versatile blend of carbon monoxide (CO), hydrogen (H₂), and hydrocarbons that plays a crucial role in the production of sustainable fuels and raw materials for plastics. It is obtained from splitting water (H₂O) into hydrogen (H₂) and oxygen (O₂) through electrolysis, followed by combining hydrogen with captured carbon dioxide (CO₂) from feedstock to produce CO and H₂. This roadmap presents a technological pathway for advancing syngas production with a focus on improving the FOMs : carbon emissions and energy efficiency through the integration of renewable energy, water electrolysis, and carbon capture technologies.
Roadmap Scope
The focus of this roadmap is on syngas production via the electrolysis of water, powered by renewable energy sources such as wind, solar, and hydropower. The roadmap aims to leverage renewable power, reactor technologies, and carbon capture integration to establish a low-carbon, sustainable approach to syngas production. The syngas production process comprises two key stages:
Electrolysis of Water: Using renewable electricity, water (H₂O) is split into hydrogen (H₂) and oxygen (O₂) through electrolysis. This process is powered entirely by renewable energy sources to ensure minimal carbon footprint.
Catalytic Reaction in the Reactor: The hydrogen produced from electrolysis is fed into a reactor chamber, where it reacts with captured carbon dioxide (CO₂). In the presence of a catalyst and under controlled conditions, CO₂ and H₂ combine to produce syngas (a mix of CO and H₂), which is subsequently used for producing sustainable fuels.
Technological Infusions into Proposed Technology
Renewable Energy Integration: The electrolysis process is driven by renewable energy sources, effectively reducing the carbon emissions associated with syngas production. By connecting to wind, solar, or hydropower, the technology aims to utilize excess renewable energy during periods of peak generation.
Carbon Capture, Utilization, and Storage (CCUS): CCUS technologies provide a consistent supply of CO₂ to the reactor, sourced from industrial emissions, direct air capture, or other streams. This contributes to a closed-loop carbon cycle and maximizes the sustainability of the syngas production process.
Catalyst Efficiency: Catalyst technology is key to boosting the reaction efficiency between hydrogen and CO₂ in the reactor chamber. Efficient catalysts reduce the energy requirements of the process, increasing the overall yield of syngas production.
Reference Case: Power-to-X (P2X)
The reference case for this syngas production technology is based on the Power-to-X (P2X) approach, where renewable electricity is converted into carbon-neutral fuels and chemicals. P2X has been implemented in several pilot projects to create synthetic fuels and chemicals, serving sectors such as transportation, plastics manufacturing, and energy storage. This roadmap aims to build on the success of P2X by expanding the integration of renewable energy and carbon capture systems.
Need to replace the below with the system OPM.
Design Structure Matrix (DSM) Allocation
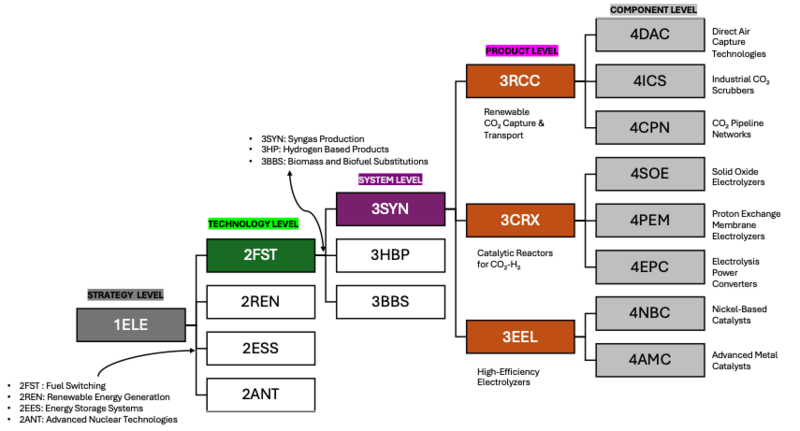
The Design Structure Matrix (DSM) that shows the connection between syngas production as a technology and other technologies is summarized below. The DSM below is chiefly organized into three levels, starting from a high-level market strategy down to key enabling technologies that make syngas production possible.
Level 1: Market Strategy focuses on aligning clean energy and sustainable fuels with market needs. It sets performance goals like low carbon intensity, cost-effectiveness, energy efficiency, and scalability.
Level 2: Fuel Switching Technologies aims at transitioning to cleaner fuels to meet sustainability goals. Syngas production, through renewable energy-powered electrolysis and carbon capture, is highlighted as a key solution to replace conventional fuels with sustainable alternatives.
Level 3: Syngas Production outlines the critical enabling technologies that drive efficient and sustainable syngas production, including Carbon Capture, Electrolysis Efficiency, Catalytic Reactors, Power Conditioning, and Energy Storage.
Level 4: Key Enabling Component Technologies These are the subsystem-level technologies needed to drive syngas production efficiently and sustainably:
3RCC Renewable Carbon Capture (CO₂ Capture and Transport Technologies): Enables the trapping of CO₂ from industrial emissions or direct air capture, which is essential for syngas production. 3EEL Electrolysis Efficiency (High-Efficiency Electrolyzers): Focuses on electrolysis units that split water with minimal energy loss, leveraging renewable energy like solar and wind to power the system. 3CRX Catalytic Reactors for CO₂-H₂ Reactions: Catalytic systems designed to maximize the efficiency of the reaction between hydrogen and carbon dioxide to form syngas, ensuring high yield and minimal energy consumption. 3PCS Power Conditioning Systems: This system ensures that the renewable energy input is stable, reliable, and properly conditioned to meet the demands of the electrolysis and reactor processes, including day-night cycle energy management. 3ESS Energy Storage Systems: Involves the integration of energy storage solutions (e.g., lithium-ion batteries or regenerative fuel cells) to manage the intermittent nature of renewable energy sources, ensuring a consistent energy supply for the syngas production process.
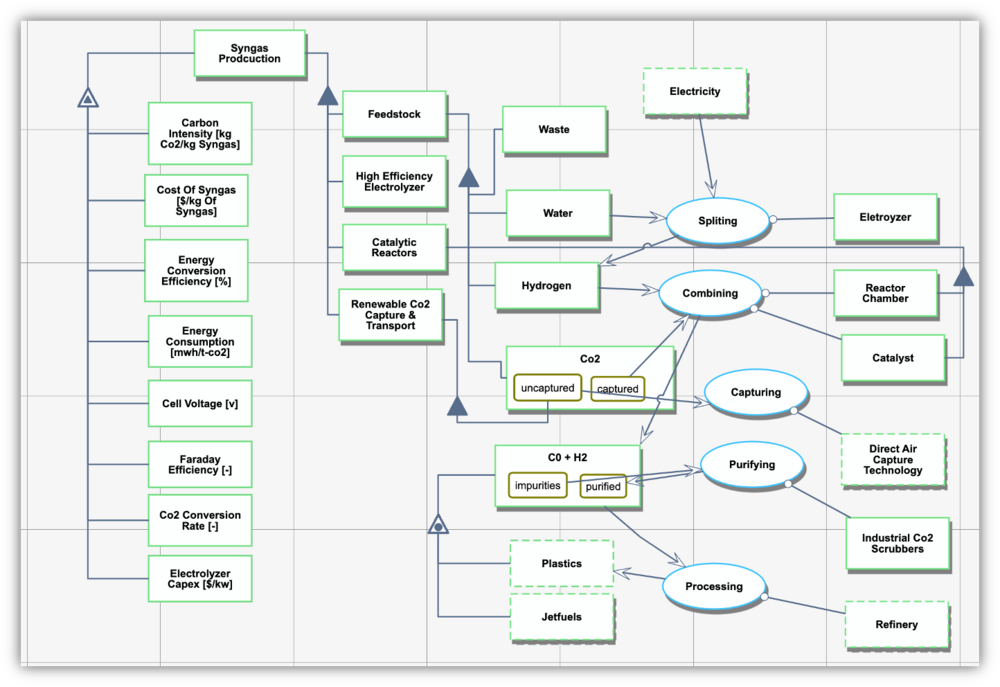
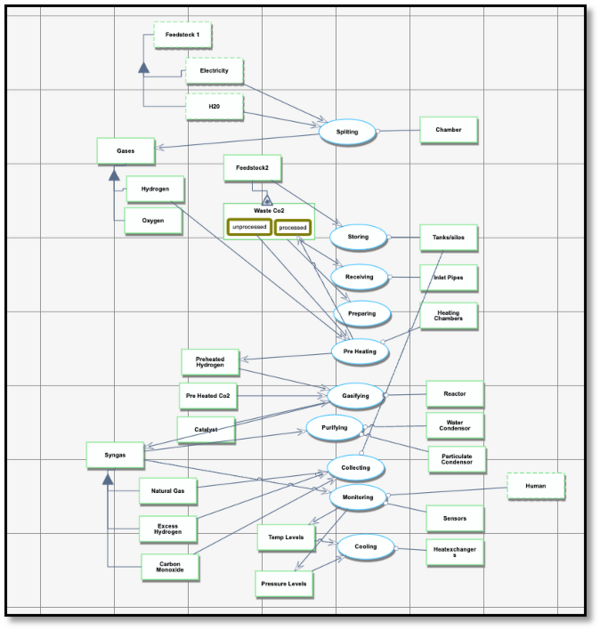
Roadmap Model using OPM
Detailed below is the conceptual OPM model of the syngas production system. (a) System Diagram of the Syngas Production at Level 0 in OPM. (b) System Diagram obtained by zooming into processing.
Figure of Merit (FOM)
FOMs of sustainable syngas are listed below, where the first three are the primary FOMs, and the rest of them are decompositions of the primary FOMs.
| FOM Name | Units | Description | Trend |
|---|---|---|---|
| Levelized Cost of Syngas | [$/kg-syngas] | Sum of OPEX and CAPEX divided by annual syngas production. Indicates technology implementation costs. | Decreasing |
| Carbon Intensity | [kg-CO2e/kg-syngas] | CO2 emissions per unit of syngas produced. Measured to assess emissions depending on energy source. | Decreasing |
| Energy Conversion Efficiency | [%] | Efficiency of feedstock energy conversion into syngas. | Increasing |
| Energy Consumption | [MWh/t-CO] | Energy required for the CO2 electrolyzer. | Decreasing |
| Cell Voltage | [V] | Voltage applied to the CO2 electrolyzer. | Decreasing |
| Faraday Efficiency | [dml] | Efficiency of electric charge transfer to produce CO. | Increasing |
| CO2 Conversion Rate | [dml] | Ratio of CO2 converted to total input. | Increasing |
| Electrolyzer CAPEX | [$/kW] | Capital expenditure for the CO2 electrolyzer. | Decreasing |
| CO2 Emission of DAC | [t-CO2e/t-CO2] | CO2 emissions per unit captured by DAC. | Decreasing |
Alignment with Company Strategic Drivers
Below are several strategic drivers and targets that could be pursued by a company that aims to develop sustainable syngas.
| ID | Strategic Driver | Alignment and Targets |
|---|---|---|
| 1 | To develop a syngas production pipeline that causes 90% less carbon emissions than the industry standard process today. | The Sustainable Syngas Technology Roadmap aims for a CO2 electrolyzer to be developed that can produce syngas with a carbon intensity of 0.14 kg-CO2e/kg-syngas. |
| 2 | To develop a sustainable syngas production pipeline that can satisfy 1% of global syngas demand cost-competitively with traditional production methods (accounting for carbon credits or offsets). | The Sustainable Syngas Technology Roadmap aims for a CO2 electrolyzer to be developed that can produce 212 t-CO/hr at a price of 0.65 $/kg-syngas. |
The Sustainable Syngas Production Company would be set up as a new business that aims to create a sustainable, cost-effective and scalable alternative to conventional syngas production processes today. The technology roadmap guiding the Company’s product development formulates a set of FOM targets that state that the CO2 electrolyzers owned and operated by the company should be able to produce 212 t-CO/hr at a price of 0.65 $/kg-syngas and at a maximum carbon intensity of 0.14 kg-CO2e/kg-syngas produced.
Positioning of Company vs. Competition
Electrolyzer-based syngas production has only started to commercialize in the past 5 years and many technologies are still undergoing rapid development. Given the limited data points available in public, the cost estimation of carbon monoxide (CO) [6.1] are used to calculate the cost of syngas production technologies. The reference [6.1] focuses on Low-temperature (LT) electrolysis, High-temperature (HT) electrolysis, and thermochemical CO production, where the current and the future cost estimation are provided. The cost of CO is converted into the cost of syngas using the ratio of molecular weight. The carbon intensity is calculated according to the eq (7.10).
| Name | CO2 Reduction | CO2 Capture | Single Pass Conversion [%] | Cell Voltage [V] | Faraday Efficiency [%] | CO2 Emission of Carbon Capture [t-CO2 emission/t-CO2] | Levelized Cost of Syngas [$/kg-syngas] | Carbon Intensity [kg-CO2e/kg-syngas] |
|---|---|---|---|---|---|---|---|---|
| Company A | LT Electrolysis | Point Source | 20 | 3.0 | 98 | 0.44 | 1.79 | 0.61 |
| Company B | HT Electrolysis | Point Source | 65 | 1.4 | 99 | 0.44 | 0.76 | 0.61 |
| Company C | Thermochemical | Point Source | 68 | - | 41 | 0.44 | 0.82 | 0.61 |
| Company D | LT Electrolysis | DAC | 27 | 3.3 | 90 | 0.09 | 2.13 | 0.48 |
Figure 6.1 shows the positioning of the syngas production technologies. The future technologies will meet the market price of syngas. However, these technologies have high carbon intensity since the CO2 is embodied into the syngas. On the other hand, the carbon intensity is decreased when the CO2 is directly captured from the atmosphere. Since the current technology of DAC+LT electrolysis still has high cost, the technology development is required to be competitive to other technologies.
Technical Model
Governing Equations [7.1]
CO2 electrolysis is the electrochemical reduction of CO2 into various products. The selective reduction of CO2 into CO is the matured pathway in the low-temperature CO2 electrolysis, and the reaction follows the eq. (7.1);
where, the CO2 is reduced into CO at the cathode side and the oxygen evolution reaction is observed at the anode side.
The total current required for the CO2 electrolysis is calculated from the transferred electrons from the anode to the cathode by the eq (7.2);
where, I is the total current [A], FE_CO is the Faradaic efficiency, m ̇_CO is the production rate of CO [t-CO/hr], MW_CO is the molecular weight of CO [g/mol], z_(e^-,CO) is the number of electrons passed through [mol-e–/mol-CO], and F is the Faraday’s constant [C/mol]. Therefore, the power consumption of the CO2 electrolysis is calculated by the eq. (7.3);
where, P is the power consumption [MW], and V_cell is the applied voltage to the cell [V].
The energy consumption per ton of CO is similarly calculated by the eq. (7.4), considering the transferred electrons;
where, E is the energy consumption [MWh/t-CO], and n_(e^- ) is the number of required electrons.
Cost Model
In this roadmapping, the cost is chosen as one of the FOM. The cost of producing a ton of syngas is decomposed into the OPEX and the CAPEX as follows;
where, the cost, OPEX, and CAPEX are measured in $/t-syngas.
The OPEX is further decomposed into the feedstock cost and the electricity cost (eq. (7.6)). The feedstock cost is associated with the cost of hydrogen and CO2 used for CO2 electrolysis. Since the molecular ratio of hydrogen and CO2 in the syngas is 2:1, the feedstock cost is derived by the eq (7.7);
where, FS_(H_2 ) is the required amount of hydrogen [t-H2/t-syngas], C_(H_2 ) is the cost of hydrogen [$/t-H2], FS_(CO_2 ) is the required amount of CO2 [t-CO2/t-syngas], C_(CO_2 ) is the cost of CO2 [$/t-CO2], MW_(H_2 ) is the molecular weight of hydrogen [g/mol], and MW_(CO_2 ) is the molecular weight of CO2 [g/mol].
The electricity cost is derived from the energy consumption (eq. (7.4)) by adjusting its amount through the weight ratio;
The CAPEX is calculated from the sum of equipment cost and the amount of syngas production through the lifetime of equipment. The equipment cost is estimated as linear to the power consumption [7.1]. Therefore, the CAPEX is calculated by the eq. (7.9);
where, C_Electrolyzer is the cost of electrolyzer per power consumption [$/kW], ANP is the annual production of syngas [t-syngas/yr], L is the lifetime [yr].
Carbon Intensity Model
The other FOM chosen in this roadmapping is the carbon intensity (CI), which is defined as follows;
where, CI is the carbon intensity [kg-CO2e/kg-syngas], E_Feedstock is the CO2 emission associated with the feedstock processing [kg-CO2e], E_Embodied is the CO2 embodied into the product (in this case, syngas) [kg-CO2e], E_Operation is the CO2 emission during the operation and processing [kg-CO2e], and E_Sequestration is the CO2 abated through sequestration [kg-CO2e].
In this roadmapping, the assumption is made where the CO2 feedstock is obtained by the Direct Air Capture (DAC) and hydrogen is obtained by water electrolysis. The DAC reduces E_Feedstock since the CO2 is directly taken from the atmosphere. However, the process of DAC requires thermal energy that is produced by natural gas. According to the reference [7.1] and our estimation, it was found that the CO2 emission of DAC is about 0.094 [t-CO2e/t-CO2]. Therefore, E_Feedstock is decomposed as follows;
The CO2 electrolysis does not produce operational emissions. However, there are unreacted CO2 that might be released to the atmosphere and counted as E_Operation. The sum of the embodied CO2 and the unreacted CO2 is equal to the captured CO2 in eq. (7.11). Considering there is no CO2 sequestration, the eq. (7.10) is simplified as follows;
where, E_DAC is the carbon emission of DAC to capture a ton of CO2 [t-CO2e/t-CO2] and is equal to 0.094.
Sensitivity Analysis
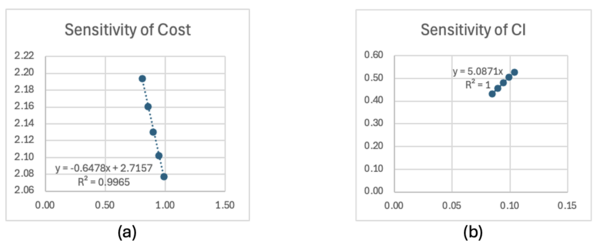
Using the technical models developed in this section, the sensitivity analysis was performed. The finite difference approach was used to estimate the sensitive of each variable. The Option 2 in Table 7.1 was used as the baseline of variables, and the variables are changed by -10%, -5%, +5%, +10%. The FOMs, i.e., cost and CI, were accordingly calculated, and the slope of FOM (dFOM/dx, where x is variable) was calculated. Figure 7.2 shows the example of dFOM/dx. All of the variables are in linear relation with the FOM, where the R2 values were close to 1.
Normalized Sensitivities
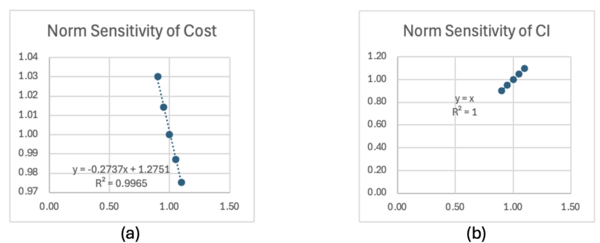
Normalized sensitivities are similarly calculated. The same approach was used as the sensitivity analysis, however, the normalized FOMS and variables were used for the finite difference calculation. Figure 7.3 shows the example of normalized dFOM/dx. All of the normalized variables are in linear relation with the normalized FOM, where the R2 values were close to 1.
Tornado chart
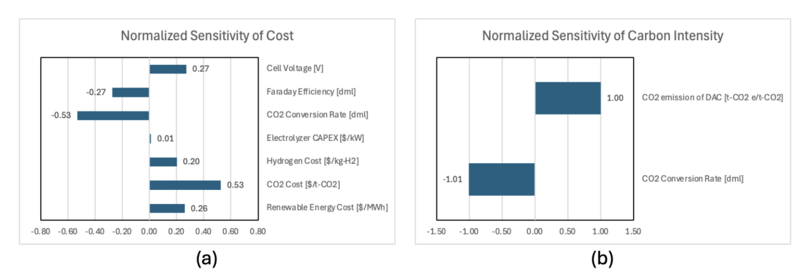
The results of sensitivity analysis are summarized in Table 7.2, and the tornado charts of normalized sensitivity are described in Figure 7.4. It was found that the cost and the conversion rate of CO2 are most sensitive to the syngas cost. This is because the production of syngas requires the same amount of CO2 in mole. Considering that only 27% of the CO2 is converted into CO in the baseline, there are space in CO2 conversion rate for technical development. On the other hand, two variables in CI model have the same sensitivity to the CI. The carbon emission in CO2 electrolysis is associated with the emission of thermal energy used in DAC. Therefore, decreasing the unreacted CO2 by increasing the CO2 conversion rate, or decreasing CO2 emission of DAC are both effective to decrease the carbon intensity.
| Cost | Sensitivity | Norm Sensitivity |
|---|---|---|
| Cell Voltage [V] | 0.175 | 0.27 |
| Faraday Efficiency [dml] | -0.648 | -0.27 |
| CO2 Conversion Rate [dml] | -4.184 | -0.53 |
| Electrolyzer CAPEX [$/kW] | 0.0001 | 0.01 |
| Hydrogen Cost [$/kg-H2] | 0.126 | 0.20 |
| CO2 Cost [$/t-CO2] | 0.005 | 0.53 |
| Renewable Energy Cost [$/MWh] | 0.012 | 0.26 |
| Carbon Intensity | Sensitivity | Norm Sensitivity |
| CO2 emission of DAC [t-CO2 e/t-CO2] | 5.09 | 1.00 |
| CO2 Conversion Rate [dml] | -1.79 | -1.01 |
Morphological Matrix and Tradespace Analysis
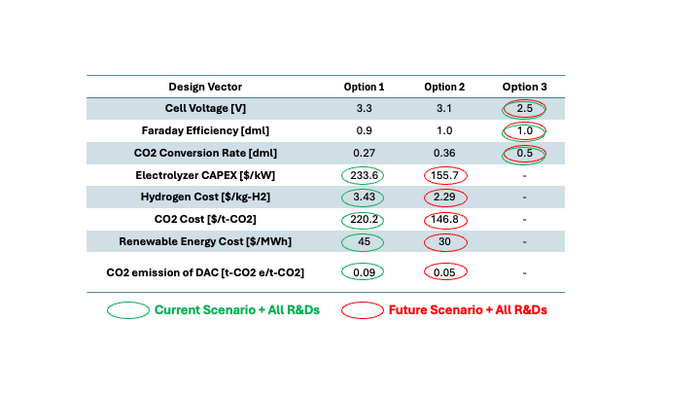
There are multiple variables in the technical models of cost and carbon intensity, described by the eqs. (7.5-9) and eq. (7.12) respectively. For an initial investigation of a tradespace, the morphological matrix is defined as shown in Table 7.1. The values of variables are determined from the reference [7.1], where the Option 1, the Option 2, and the Option 3 assumes the conservative case, the nominal case, and the optimistic case respectively.
Using the values in the Table 7.1, the cost and CI are calculated and plotted in Figure 7.1. It was found that even the optimistic scenario does not meet the current market price of the syngas, which implies further technology development is required.
Financial Model
List of R&T/R&D Projects and Prototypes
Table 8.1 shows a detailed presentation of R&D projects for advancing synthesis gas (syngas) as an alternative to fossil fuels. A list of ten R&D projects was developed, each targeting incremental or radical improvements in the FOM listed below. We use the information from technology R&D to evaluate which technology project should be prioritized by means of a financial model and visualization of a swoosh.
Key FOMs
- CO₂ Conversion Efficiency – Maximizing the utilization of CO₂ in syngas production.
- Carbon Intensity – Reducing carbon emissions associated with syngas production.
- Cost – Ensuring economic feasibility through reduced capital and operational costs
| ID | R&D Area | R&D Project Set | FOMs Improved | Type of Improvement | Design Vector Improved | Reasoning |
|---|---|---|---|---|---|---|
| 1 | Synthetic Fuel Applications | Methanol synthesis with low energy inputs | CO₂ Conversion Intensity, Cost | Sustaining | CO₂ Conversion Rate [-], CO₂ Cost [$/t-CO2] | Builds on existing processes to lower energy and costs |
| Hydrogen production for fuel cells and industrial uses | Carbon Intensity, CO₂ Conversion Efficiency | Sustaining | Hydrogen Cost [$/kg-H2], CO₂ Conversion Rate [-] | Increases hydrogen production efficiency with lower emissions | ||
| Synthetic aviation fuels to decarbonize air travel | Carbon Intensity | Sustaining | CO₂ Conversion Rate [-], CO₂ Cost [$/t-CO2] | Reduces emissions in the aviation sector through syngas | ||
| 2 | Carbon Management and Emissions | Modular carbon capture systems | CO₂ Conversion Intensity | Sustaining | CO₂ Emission of DAC [t-CO2 e/t-CO2], CO₂ Cost [$/t-CO2] | Modular systems improve scalability and reduce CO₂ capture costs |
| CO₂ mineralization for permanent storage | CO₂ Conversion Intensity | Radical | CO₂ Cost [$/t-CO2], CO₂ Emission of DAC [t-CO2 e/t-CO2] | Offers a long-term storage solution for carbon | ||
| Carbon-negative systems (e.g., biochar + syngas) | CO₂ Conversion Intensity | Radical | CO₂ Emission of DAC [t-CO2 e/t-CO2], CO₂ Cost [$/t-CO2] | Enables negative emissions through innovative combinations | ||
| 3 | Enhanced Conversion Technologies | Plasma gasification for better thermal efficiency | CO₂ Conversion Efficiency, Carbon Intensity | Sustaining | CO₂ Conversion Rate [-], Renewable Energy Cost [$/MWh] | Utilizes renewable energy to reduce emissions and improve conversion |
| Electrochemical syngas production directly from CO₂ | CO₂ Conversion Efficiency, Carbon Intensity | Radical | CO₂ Conversion Rate [-], Renewable Energy Cost [$/MWh], CO₂ Cost [$/t-CO2] | Leverages renewables for a paradigm shift in conversion technology | ||
| Low-temperature catalytic reactors | CO₂ Conversion Efficiency, Cost | Sustaining | CO₂ Conversion Rate [-], Electrolyzer CAPEX [$/kW], Renewable Energy Cost [$/MWh] | Improves thermal efficiency and reduces operating costs | ||
| 4 | Advanced Feedstock Utilization | Pre-treatment processes for biomass and waste | CO₂ Conversion Efficiency, Cost | Sustaining | CO₂ Conversion Rate [-], CO₂ Cost [$/t-CO2] | Optimizes feedstock, reducing CO₂ emissions and costs |
| Utilizing CO₂-rich industrial waste as feedstock | CO₂ Conversion Efficiency, Carbon Intensity | Sustaining | CO₂ Conversion Rate [-], CO₂ Cost [$/t-CO2],CO₂ Emission of DAC [t-CO2 e/t-CO2] | Increases CO₂ recycling, reducing emissions and costs | ||
| Blended feedstock systems | CO₂ Conversion Efficiency, Carbon Intensity | Sustaining | CO₂ Conversion Rate [-], CO₂ Cost [$/t-CO2], CO₂ Emission of DAC [t-CO2 e/t-CO2] | Improves efficiency of mixed feedstocks, reducing emissions | ||
| 5 | Catalyst Innovation | Next-generation high-selectivity catalysts | CO₂ Conversion Efficiency | Sustaining | CO₂ Conversion Rate [-], Electrolyzer CAPEX [$/kW] | Improves conversion rates and reduces CAPEX through selectivity |
| Regenerable catalysts to reduce degradation | Cost | Sustaining | Electrolyzer CAPEX [$/kW], Hydrogen Cost [$/kg-H2] | Lowers costs by extending catalyst lifecycle | ||
| Nanostructured catalysts for reaction rate improvements | CO₂ Conversion Efficiency, Cost | Sustaining | CO₂ Conversion Rate [-], Hydrogen Cost [$/kg-H2] | Enhances reaction rates, reducing costs and improving efficiency |
Cash Flow Analysis
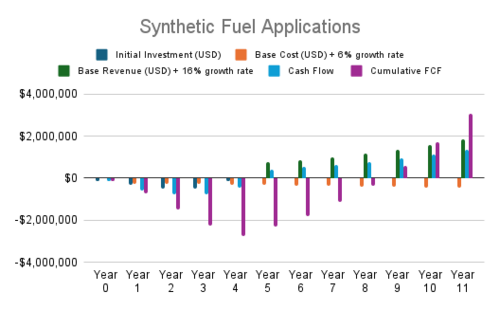
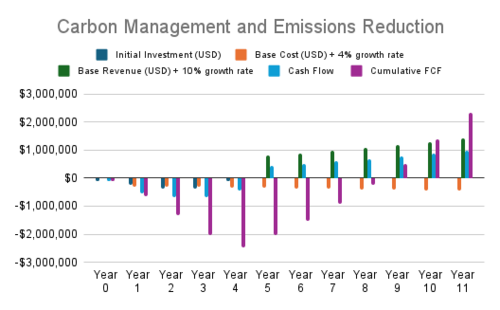
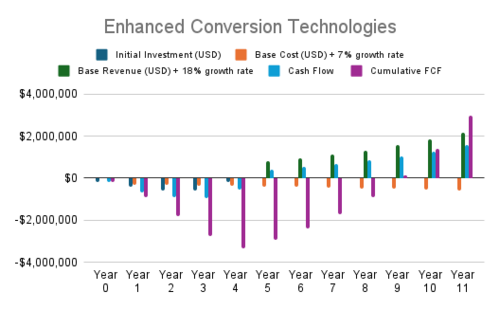
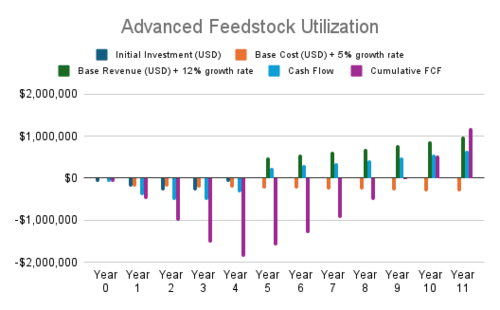
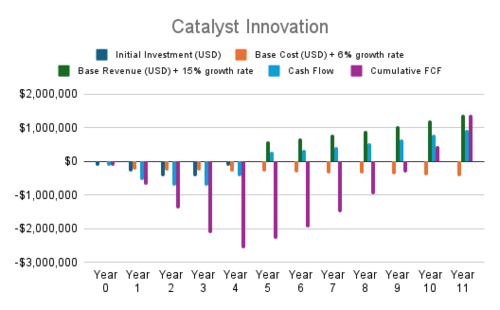
The financial analysis focuses on projects aimed at advancing syngas technology and its applications. Figures from 8.1 to 8.5 are the results of cash flow analysis. The assumptions made in the analysis are listed below. These assumptions provide a basis for evaluating financial models for the listed R&D projects.
Assumptions:
Given the lack of direct market data for syngas technology, we based our financial model on informed assumptions:
1. Investment Levels:
- Moderate initial investments typical of early-stage clean energy R&D.
2. Revenue Estimates:
- Derived from adjacent industries:
- Catalyst innovation revenues scaled from chemical and materials industry data.
- Synthetic fuel applications benchmarked against biofuel and hydrogen markets.
- Adjusted to reflect projected syngas market share and assumed linear market entry with scalability in later years.
3. Cost Estimates:
- Included capital expenditures (CAPEX), operational expenses (OPEX), and maintenance/logistics.
- Costs scaled based on the complexity of each R&D project.
4. Growth and Discount Rates:
- Assumed reasonable growth rates for revenue and costs, with a standard discount rate applied to future cash flows.
Key Takeaways
1. High NPVs:
- Synthetic Fuel Applications and Enhanced Conversion Technologies are the most profitable projects, driven by high revenue growth and scalability.
- These projects are excellent candidates for prioritization due to their financial viability.
- Synthetic Fuel Applications: These projects focus on integrating syngas into existing systems or producing synthetic fuels from syngas. Their strong revenue growth and scalability yield the highest NPVs among all evaluated projects.
- Enhanced Conversion Technologies: Projects in this category target improving syngas production efficiency through advanced methods, achieving notable financial returns due to rapid scaling potential.
2. Moderate Returns:
- Carbon Management and Emissions and Renewable Energy Integration provide solid returns with positive NPVs, reflecting steady revenue growth and manageable costs.
3. Negative NPVs:
- Advanced Feedstock Utilization and Catalyst Innovation currently show negative NPVs, largely due to high initial costs and slower revenue scaling. Optimization in cost structure or strategy may improve their outlook.
List of R&T/R&D Projects and Prototypes
List of R&T/R&D Projects and Prototypes
Table 9.1 summarizes the list of R&T/R&D projects and prototypes with financial metrics. The tradespace analysis Is also performed to compare the technical improvements of each R&D Area as shown in Figure 9.1.
| ID | R&D Area | Project Set | R&D Cost [M$] | Revenue [M$] | OPEX [M$] | NPV [M$] |
|---|---|---|---|---|---|---|
| 1 | Synthetic Fuel Applications | Methanol synthesis with low energy inputs, Hydrogen production for fuel cells and industrial uses, Synthetic aviation fuels to decarbonize air travel | $1.60 | $8.56 | $3.89 | $0.35 |
| 2 | Carbon Management and Emissions | Modular carbon capture systems, CO₂ mineralization for permanent storage, Carbon-negative systems (e.g., biochar + syngas) | $1.20 | $7.59 | $4.05 | $0.19 |
| 3 | Enhanced Conversion Technologies | Plasma gasification for better thermal efficiency, Electrochemical syngas production directly from CO₂, Low-temperature catalytic reactors | $2.00 | $9.71 | $4.74 | $0.07 |
| 4 | Advanced Feedstock Utilization | Pre-treatment processes for biomass and waste, Utilizing CO₂-rich industrial waste as feedstock, Blended feedstock systems | $1.00 | $5.04 | $2.84 | -$0.13 |
| 5 | Catalyst Innovation | Next-generation high-selectivity catalysts, Regenerable catalysts to reduce degradation, Nanostructured catalysts for reaction rate improvements | $1.50 | $6.64 | $3.74 | -$0.34 |
Keys Publications, Presentations and Patents
| ID | Title | Reference | Description | Relevancy |
|---|---|---|---|---|
| 1 | Attenuated Combustion for Clean Power and Hydrogen Capture | US 20240360785 A1 (10/31/2024), (Nucor Corporation, Charlotte, NC (US)) (F02C 3/22) | Focuses on attenuated combustion for enhanced clean power generation and hydrogen capture. Involves controlling combustion conditions to reduce emissions and effectively capture hydrogen. | 1. The patent’s claims include innovations in managing combustion processes, capturing hydrogen, and potentially optimizing the heat and energy usage during hydrogen production. These factors could improve the overall efficiency of your syngas production technology. 2. The patent may involve a hydrogen generation process that complements the use of electrolysis in syngas production. The captured hydrogen can be directly used to react with CO2, forming syngas (CO + H2). |
| 2 | Maximizing Syngas Carbon Utilization And Conversion to Biofuel | US 20240359979 A1 (10/31/2024), (ENERKEM INC., Montreal (CA) (C01B 3/52)) | Focuses on maximizing carbon utilization in syngas, leading to reduced waste and increased efficiency in downstream processing. | 1. The patent is highly relevant to figure of merits (FOM) which our technology hopes to improve - efficiency in syngas production, specifically in terms of CO2 utilization and energy efficiency. 2. The patent emphasizes maximizing carbon utilization in the syngas production process. By improving how efficiently the carbon from CO2 is used, the process reduces CO2 waste and enhances the effective conversion into valuable syngas. This directly impacts the CO2 input-to-output efficiency by ensuring more of the carbon input (as CO2) ends up as a product rather than being emitted as waste. |
| 3 | Conversion of Flue Gas Carbon Dioxide to Valuable Carbons and Hydrocarbons | US 12128355 B2, (10/29/2024), (Wilson Hago, Camarillo, CA (US)), (C01B 3/02) | Describes a method for converting CO2 from flue gases into valuable carbons and hydrocarbons using a reactor and catalytic systems. Produces valuable carbon materials and light hydrocarbons for industrial applications. | While the patent focuses on hydrocarbons and carbon, the methodology of catalytic conversion and reactor design is closely related to the technologies used in syngas production. This technology highlights the potential for CO2 utilization to produce valuable products, contributing to circular economy practices and addressing greenhouse gas emissions. |
Paper
Title: Evaluating the techno-economic potential of defossilized air-to-syngas pathways
Reference: H. M. Almajed et al., Energy Environ. Sci., 2023, 16, 6127 [7.1]
Description: The paper performed the holistic cost evaluation of air-to-syngas processes. The paper selected direct air capture for CO2 feedstock, steam methane reforming and water electrolysis for hydrogen feedstock, and reverse water gas shift and CO2 electrolysis for carbon monoxide (CO) production. The combinations of these processes resulted in four pathways, and the cost and the carbon emission were evaluated. The paper also performed scenario analyses, where the future electricity cost and the performance improvement in CO2 and water electrolysis were considered.
Relevancy: The paper clearly addressed the current performance of CO2 electrolysis and associated cost with the electrolyzer, which can be a baseline of our FOMs. In addition, the holistic cost evaluation, including feedstocks, provides insights into an appropriate system boundary of technology roadmapping.
Paper
Title: Electrochemical Conversion of CO2 to Syngas with Palladium-Based Electrocatalysts
Reference: B. M. Tackett et al., Acc. Chem. Res. 2020, 53, 1535−1544 [10.1]
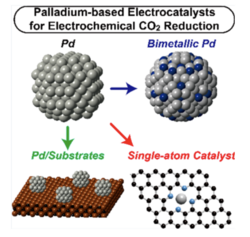
Description: The authors of the paper developed the Pd-based electrocatalysts to directly produce syngas from CO2 and water. In the electrochemical reaction of CO2 electrolysis, unwanted hydrogen is usually produced at the cathode and the purification was required to obtain high purity CO. Instead, the newly developed catalysts enabled tunable CO:H2 ratio, where the hydrogen is actively produced and the desired CO:H2 ratio of syngas is directly obtained. The authors investigated the fundamental characteristics of PD-based catalysts through XAS (X-ray Absorption Spectroscopy) and XRD (X-Ray diffraction) analyses, and density functional theory calculations.
Relevancy: The paper demonstrated a potential application of tunable CO:H2 ratio for syngas production. In general, the sustainable syngas production requires both CO2 electrolyzer and water electrolyzer, which increases the CAPEX of the total system. The direct production of syngas from CO2 and water will significantly reduces the cost associated with the energy consumption and the electrolyzers.
Paper
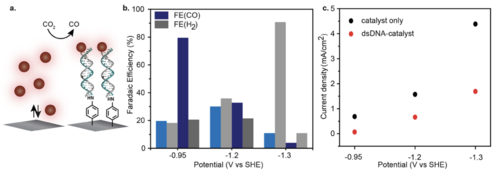
Title: Highly Efficient Carbon Dioxide Electroreduction via DNA-Directed Catalyst Immobilization
Reference: G. Fang et al., JACS Au 2024, 4, 1413−1421 [10.2]
Description: The paper employed the advanced technology to increase the efficiency of CO2 electrolysis. In the paper, DNA was applied to work as a molecular-scale “Velcro” so that the small-molecule catalyst can be proximal to the electrode surface. The authors expected that the stability of catalyst and the Faradaic efficiency (identical to energy conversion ratio) were improved by the approach. As a result, 79.1% of the Faradaic efficiency was observed, which was the four times of the homogeneous molecular catalysts.
Relevancy: The approach addressed in the paper could be a disruptive technology to significantly improve the reaction efficiency of CO2 electrolysis. The technology will reduce the cost (one of our FOM) associated with the energy consumption and the electrolyzer.
Technology Strategy Statement
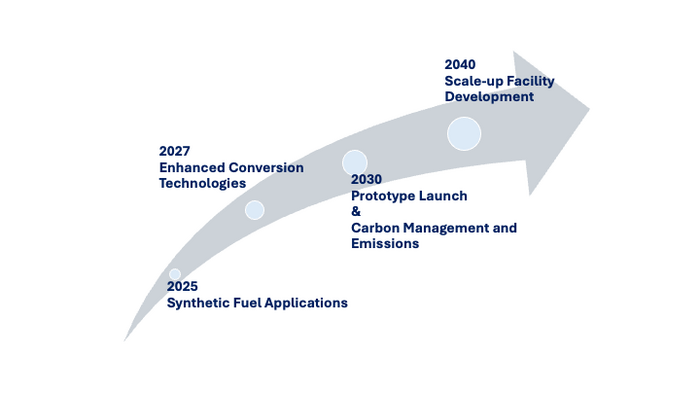
Based on the tradespace analysis (Figure 9.1) and the NPV analysis (Table 9.1), three R&D area are selected, i.e., Synthetic Fuel Applications, Carbon Management and Emissions, and Enhanced Conversion Technologies. First, the team will start Synthetic Fuel Applications project from 2025. The cost and the carbon intensity might not reach the targets, however, the team will focus on finding the early adopter of the technology to open the market. Second, in 2027, Enhanced Conversion Technologies project will be started. Since the project includes the catalyst development, the research is started before the demonstration for the future technical competitiveness. In 2030, The prototype is launched by implementing the developed technologies. The team will earn revenue from this stage, and validate the customer needs. At the same time, Carbon Management and Emissions project will be started to lower the CO2 feedstock cost and the carbon intensity. Finally, in 2040, all technologies are implemented into the scale-up facility, and the demonstration will be started.
References
[6.1] National Renewable Energy Laboratory, Economy Feasibility for CO2 Utilization Data Visualization Tool, https://www.nrel.gov/bioenergy/co2-utilization-economics/, accessed 11/29/2024
[7.1] H. M. Almajed et al., Evaluating the techno-economic potential of defossilized air-to-syngas pathways, Energy Environ. Sci., 2023,16, 6127-6146.
[10.1] B. M. Tackett et al., Electrochemical Conversion of CO2 to Syngas with Palladium-Based Electrocatalysts, Acc. Chem. Res. 2020, 53, 1535−1544.
[10.2] G. Fang et al., Highly Efficient Carbon Dioxide Electroreduction via DNA-Directed Catalyst Immobilization, JACS Au 2024, 4, 1413−1421.

