Difference between revisions of "Geothermal Power Plant"
| (42 intermediate revisions by 2 users not shown) | |||
| Line 1: | Line 1: | ||
Roadmap Creators: Mehawesh Alkhalil, David Brown, [https://www.linkedin.com/in/codyseckfort/ Cody Seckfort] | |||
=Technology Roadmap= | =Technology Roadmap= | ||
| Line 4: | Line 5: | ||
Technology Description: | Technology Description: | ||
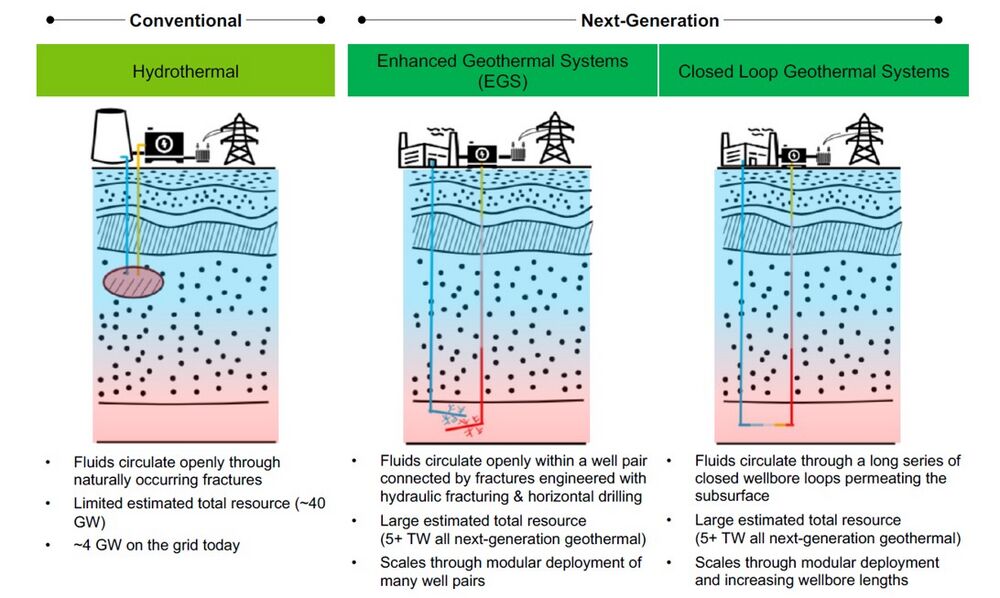
Geothermal power plants generate electricity by harnessing geothermal energy through a series of steps. First | Geothermal power plants generate electricity by harnessing geothermal energy through a series of steps. First hot geothermal fluid is brought to the surface and passed through a heat exchanger, transferring its heat to a working fluid. This working fluid, now heated, drives a turbine, which powers a generator to produce electricity. Afterward, the working fluid is cooled and condensed back into a liquid form before being recirculated through the heat exchanger to repeat the process. Conventional geothermal energy relies on a reservoir of hot fluid that is close to the surface, and has high enough porosity and permeability for fluid to be extracted at sufficient rates to power the turbine. The locations where such reservoirs exist are fairly limited, which is why overall geothermal is not a large part of the current energy mix. Recent advancements in next generation geothermal technologies are greatly expanding the geographic area where geothermal energy is viable. There are 2 main categories of next generation geothermal: enhanced geothermal systems (EGS), and closed loop systems, also known as advanced geothermal systems (AGS). In EGS injector and producer wells are drilled into deep hot rock formations, and then connected via hydraulic fracturing to create a geothermal reservoir. AGS directly connects the injector and producer and the whole system is cased in steel so the circulated fluid does not directly interact with the rock. EGS is able to extract more heat from a volume of rock because of the much greater surface area of the fracture network as compared to the surface area of a steel pipe. Proponents of AGS point to its lower maintenance, lower risk of induced seismicity, and lack of water-rock interactions which can result in undesirable chemical reactions. | ||
[[File: | [[File:Next_Gen_Geothermal.jpg|1000px]] | ||
Source: Blankenship, D., 2024. Pathways to Commercial Liftoff: Next Generation Geothermal Power, US. Department of Energy report. | |||
[[File:US Geothermal Maps.jpg|1000px]] | |||
Source: Blackwell, D., Richards, M., Frone, Z., Ruzo, A., Dingwall, R., & Williams, M. (2011). Temperature-At-Depth Maps For the Conterminous US and Geothermal Resource Estimates. GRC Transactions, 35(GRC1029452). | |||
The maps above show the distribution of high temperature rocks suitable for next generation geothermal development across the US. In general, geothermal electricity generation is feasible anywhere where the temperatures are above ~150 C. Cooler geothermal resources may still be of interest for direct use applications such as heating buildings. The left map shows temperatures at a depth of 3.5 km, which is accessible using current drilling technologies. The right map shows temperature at 10 km depth, which is currently out of reach and/or highly uneconomical with current drilling capabilities. There are several efforts underway to develop advanced drilling techniques to access the enormous amount of energy stored in these deep rocks. | |||
==Design Structure Matrix (DSM) Allocation== | ==Design Structure Matrix (DSM) Allocation== | ||
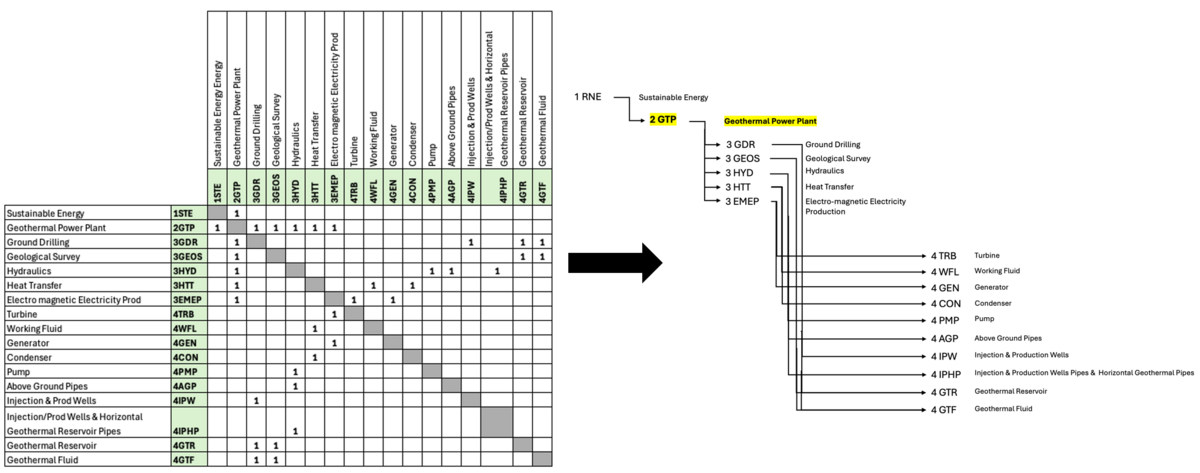
[[File: | The Geothermal Power Plant (2GTP) is a key component of sustainable energy objectives, requiring five Level 3 enabling technologies categorized as follows: | ||
[[File: | |||
Above Surface Technologies: | |||
3EMEP (Electro-magnetic Electricity Production): Critical for electricity generation above ground. | |||
Subsurface Technologies: | |||
3GEOS (Geological Survey): Identifies areas with high geothermal potential. | |||
3GDR (Ground Drilling): Enables drilling and fracking near geothermal reservoirs. | |||
Integrated Surface and Subsurface Technologies: | |||
3HYD (Hydraulics) and 3HTT (Heat Transfer): Applicable across both surface and subsurface operations. | |||
This roadmap primarily focuses on the subsurface aspects of the geothermal power plant, highlighting the following Level 4 technologies essential for the Level 3 systems: | |||
4IPWP: Injection, production, and horizontal geothermal pipes. | |||
4GTR: Geothermal reservoir. | |||
4GTF: Geothermal fluid. | |||
[[File:GPP_Tree.png|1200px]] | |||
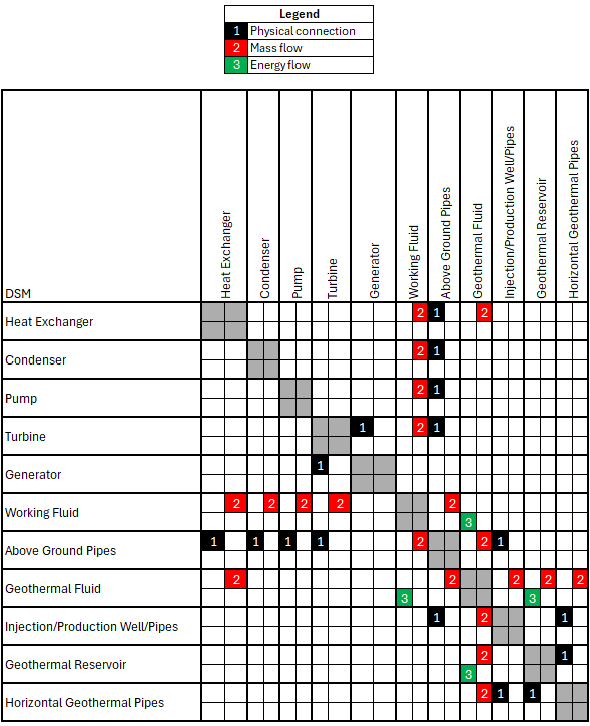
This Design Structure Matrix comprises 11 Level 3 elements representing both subsurface and above-surface components of geothermal power plants. It maps 40 total connections among these elements, including 18 physical connections, 18 mass flow connections, and 4 energy flow connections. | |||
[[File:GPP_Connection_DSM.png|700px]] | |||
==Roadmap Model using OPM== | ==Roadmap Model using OPM== | ||
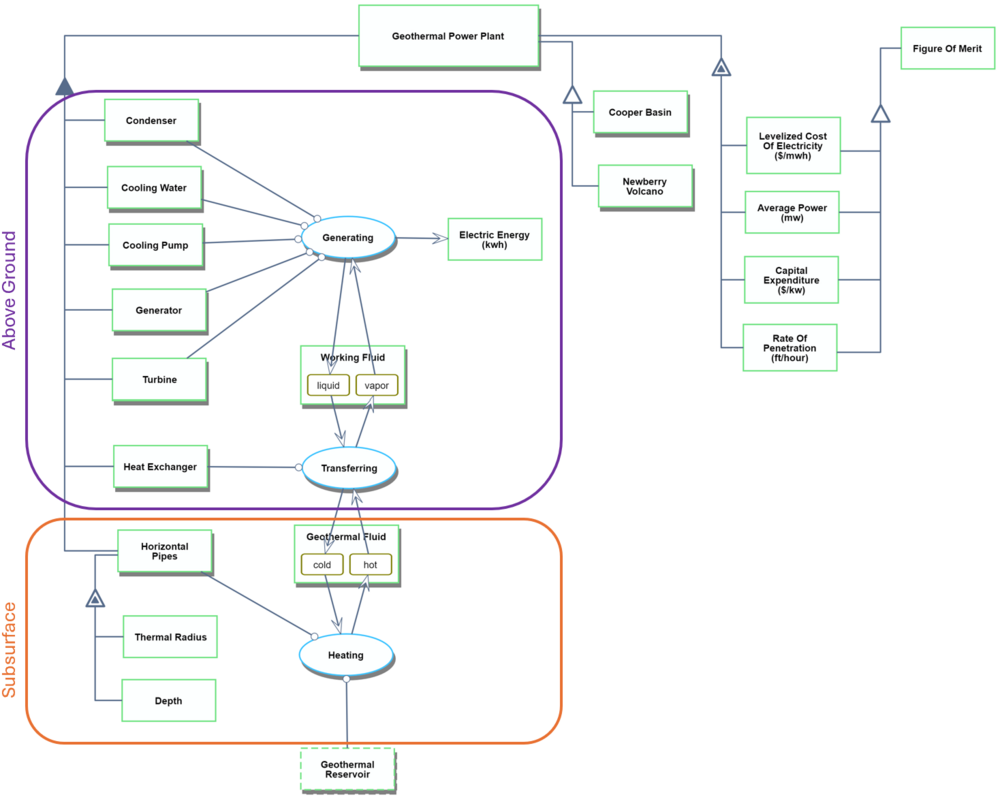
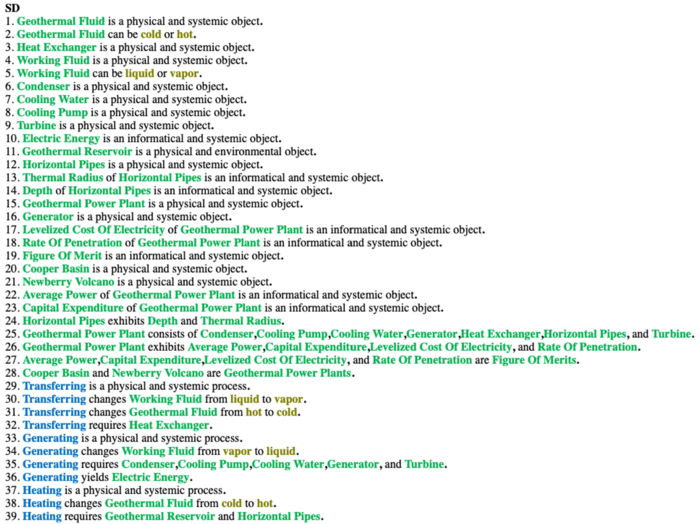
This Object-Process Methodology (OPM) diagram outlines the key components of a geothermal power plant and the processes involved in converting geothermal heat into electricity. | |||
• Geothermal Reservoir and Fluid Heating: | |||
The geothermal reservoir heats the circulating geothermal fluid, whether in Enhanced Geothermal Systems (EGS) or Advanced Geothermal Systems (AGS). The heat transfer depends on the reservoir temperature, which is influenced by the depth of horizontal pipes—greater depth results in higher temperatures. The effective thermal radius, defining the accessible heat radius of the reservoir, also affects the fluid’s final temperature. | |||
• Heat Transfer and Power Generation: | |||
Heated geothermal fluid transfers energy to a working fluid via a heat exchanger if a separate working fluid is used. The vaporized working fluid drives a turbine, spinning a generator to produce electricity. The system uses a condenser, cooling water, and a cooling pump to condense the working fluid, which is then reinjected into the reservoir. | |||
• Competitors and Metrics: | |||
[[File: | The diagram highlights key competitors, such as Utah Forge and the Fervo Cape Project, and identifies critical performance metrics, which are explored further in this roadmap. | ||
[[File:GPP_OPM_with_Annotations.png|1000px]] | |||
[[File:GPP OPL.png|700px]] | |||
==Figures of Merit== | ==Figures of Merit== | ||
[[File: | {| class="wikitable" style="margin:auto" | ||
|+ Figures of Merit | |||
|- | |||
! FOM !! Unit !! Description | |||
|- | |||
| Levelized Cost of Energy (LCOE) || $/MWh || The cost per unit of energy generation considering the lifetime costs of the facility | |||
|- | |||
| Avearge Power || MW || The average power capacity of the plant. This is a determined by the geothermal fluid heat capacity, flow rate, and the heat available in the geothermal reservoir | |||
|- | |||
| Project Capital Expexditure (CAPEX) || $/kW || The total cost of the geothermal power plant normalized by the plant power production | |||
|- | |||
| Drilling Rate of Penetration || ft/hour || The rate at which the geothermal system can be drilled. While this only considers the installation of the geothermal power plant, the bore cost and time represent between 40-75% of the plant's lifecycle costs (Robins et al.) | |||
|- | |||
|} | |||
[[File:Geothermal_ROP.jpg|1000px]] | |||
Plot made with data from El-Sadi et al., 2024, and Blankenship 2024. | |||
==Alignment with Company Strategic Drivers== | ==Alignment with Company Strategic Drivers== | ||
| Line 30: | Line 100: | ||
Alignment with company strategic drivers | Alignment with company strategic drivers | ||
{| class="wikitable" style="margin:auto" | |||
|+ Alignment with Company Strategic Drivers | |||
|- | |||
! Strategic Driver !! Alignment and Target | |||
|- | |||
| To develop a reliable geothermal powerplant that utilizes advanced drilling technologies, creating a closed-loop system that intersects a large volume of the geothermal reservoir to compete with the capacity of EGS while maintaining the reliability of AGS || The roadmap will target an average power output of 10 MW while decreasing the CAPEX to $7000/kW | |||
|- | |||
|} | |||
==Positioning of Company vs. Competition== | ==Positioning of Company vs. Competition== | ||
| Line 37: | Line 114: | ||
[[File:Geothermal_Competition.png|1200px]] | [[File:Geothermal_Competition.png|1200px]] | ||
This roadmap targets an AGS with an average power of 10 MW and a CAPEX of $7,000/kW. This target would establish an AGS with competative power generation in relation to existing EGS, while significanlty reducing the CAPEX to align with current EGS. This would provide the economic utility of an EGS while maintaining the longer anticipated plant lifetime associated with AGS. | |||
[[File:GPP_Competition_Plot.png|1200px]] | |||
==Technical Model== | ==Technical Model== | ||
| Line 52: | Line 133: | ||
[[File:Geothermal LCOE Equation.png|500px]] | [[File:Geothermal LCOE Equation.png|500px]] | ||
This equation includes the lifetime costs of the system in the numerator and the lifetime energy produced in the denominator. The costs are determined by the type of geothermal power plant used and the process used to extract heat from the Earth. The energy produced is determined by understanding how much heat is available in a finite volume of the Earth, how much can be extracted, and how efficiently the chosen geothermal power plant system can convert that heat into usable energy.Due to the complexity of the energy generation model and the differences in technical heat extraction principles with varying design vectors, we chose to first focus on the first-order energy production equation, utilizing the theoretical potential equation. We then use this energy generation equation and estimated costs to determine the LCOE. | This equation includes the lifetime costs of the system in the numerator and the lifetime energy produced in the denominator. In this equation, I is the total capital cost of the project paid in year t, M is the total operations and maintenance cost (O&M) paid in year t, F is the total fuel cost paid in year t, r is the discount rate applied to the project, E is the earnings for year t, and t represents the year of the project. The costs are determined by the type of geothermal power plant used and the process used to extract heat from the Earth. The energy produced is determined by understanding how much heat is available in a finite volume of the Earth, how much can be extracted, and how efficiently the chosen geothermal power plant system can convert that heat into usable energy.Due to the complexity of the energy generation model and the differences in technical heat extraction principles with varying design vectors, we chose to first focus on the first-order energy production equation, utilizing the theoretical potential equation. We then use this energy generation equation and estimated costs to determine the LCOE. | ||
A single general equation for electricity generation from these systems is desirable to generate a tradespace of advanced geothermal concepts, including both enhanced geothermal systems (EGS) and closed loop systems (AGS). One approach to accomplish this is to use a volume-based estimation of recoverable heat with input variables that apply to both systems. | A single general equation for electricity generation from these systems is desirable to generate a tradespace of advanced geothermal concepts, including both enhanced geothermal systems (EGS) and closed loop systems (AGS). One approach to accomplish this is to use a volume-based estimation of recoverable heat with input variables that apply to both systems. | ||
| Line 83: | Line 164: | ||
====Theoretical Potential Thermal Model==== | ====Theoretical Potential Thermal Model==== | ||
The theoretical potential thermal model sensitivity analysis was done using a 200°C EGS design vector. Variables considered are effective thermal radius, efficiency, recovery factor, lateral length, and delta temperature. See partial derivatives below evaluated for the 200°C EGS design vector. | The theoretical potential thermal model sensitivity analysis was done using a 200°C EGS design vector. Variables considered are effective thermal radius, efficiency, recovery factor, lateral length, and delta temperature. See partial derivatives below evaluated for the 200°C EGS design vector.After normalization of the partial derivatives considered, we see that electricity generation is equally sensitive to η, R, ΔT, and L since these variables are all multiplicative in the numerator. The effective thermal radius is the most sensitive variable considered since it is squared. | ||
After normalization of the partial derivatives considered, we see that electricity generation is equally sensitive to η, R, ΔT, and L since these variables are all multiplicative in the numerator. The effective thermal radius is the most sensitive variable considered since it is squared. | |||
[[File:Geothermal_Thermal_Normalization_T_Chart.png]] | [[File:Geothermal_Thermal_Normalization_T_Chart.png]] | ||
| Line 103: | Line 180: | ||
===Tradespace=== | ===Tradespace=== | ||
The following initial tradespace explores the relationship between a project's drilling costs, in a million USD, and the anticipated | The following initial tradespace explores the relationship between a project's drilling costs, in a million USD, and the anticipated power plant capacity in MW. The design vectors displayed identify the differences in EGS and AGS technologies. The use case for this tradespace includes a geothermal reservoir at 350 degrees Celcius. The growth in drilling costs represents increases in the lateral length drilled. The longer the lateral length, the higher the drilling cost, but also the higher the theoretical plant capacity. This is due to the increase in volume of the reservoir area affected by the system. The larger the reservoir, the higher the theoretical plant capacity. In this plot, the orange points and pareto front represent an EGS while the blue points and pareto front represent an AGS. This shows the comparible theoretical plant capacities between EGS and AGS with identical depths and lateral lengths (effective drilling length). With the same effective drilling length, EGS provides significantly more capacity than AGS, with the difference growing with increased drilling costs. | ||
[[File: | [[File:GPP_Tradespace_V2.png|1000px]] | ||
==Financial Model== | ==Financial Model== | ||
The financial | A Net Present Value (NPV) financial model is used to determine the financial feasibility of the geothermal power plant. The NPV model is a common method for evaluating multiple projects by converting all future revenues and expenses into a present value to account for time and opportunity costs. To determine the overall NPV of the geothermal power plant project, the expected cashflows for each year of the project are estimated and then converted to a present value using a discount rate. The NPV for the geothermal power plant will be used to compare potential R&D and other improvement projects to help determine the financial benefit of these projects. To establish the baseline NPV, a geothermal power plant use case and facility design vector must be established to conduct a comparrison. The following design parameters to establish this baseline: | ||
{| class="wikitable" style="margin:auto" | {| class="wikitable" style="margin:auto" | ||
| Line 165: | Line 242: | ||
These geothermal power plant design parameters were evaluated using the NREL GEOPHIRES software | These geothermal power plant design parameters were evaluated using the NREL GEOPHIRES software (Beckers et al. 2023) to determine the annual expenses and revenue for the plant. This is an model improvement from the potential heat and drilling cost model used in the previous section. The GEOPHIRES model provides a more robust estimate for net power output and costs associated with the plant. In this model, the net power output captures plant conversion efficiencies and the reserviour thermal decay over time. It also captures the expected operation and maintenance cost and surface plant installation costs based on the power output from the facility. | ||
Using the parameters shown above, this model produces a total plant installation cost and the estimated net power output by year and the expected operation and maintenance costs (O&M) per year of operation. The to determine the yearly cashflow for this NPV model, the capital expenditure (CAPEX) for the plant is financed at 6% over the 30 year lifetime of the plant. This produces a yearly loan payment for our model. This CAPEX loan payment, O&M costs, and revenue from electricity sales produces the yearly cashflow. The following table shows the average value for each of these components through the lifetime of the plant: | |||
{| class="wikitable" style="margin:auto" | |||
|+ Plant Average Annual Financial Values | |||
|- | |||
! Component !! Value | |||
|- | |||
| Revenue from Electricity Sales || $645,712.10 | |||
|- | |||
| CAPEX Loan Payment || $1,758,103.66 | |||
|- | |||
| OPEX (O&M) || $62,500.00 | |||
|- | |||
| Cash Flows || -$1,174,891.56 | |||
|- | |||
|} | |||
The values for CAPEX Loan Payment and OPEX are subtracted from the Revenue from Electricity Sales to produces the annual cashflow. The graph below shows how each of these values compares over the 30 year lifetime of the project. | |||
[[File:Geothermal_Cashflows.png|1000px]] | [[File:Geothermal_Cashflows.png|1000px]] | ||
Overall, this produces a NPV of -$14,993,990.64. This negative NPV shows that as of now, an AGS system with one lateral is not a viable commercial project. Currently, AGS facilities are not financially self-sustainable and focus more on R&D efforts to reduce installation costs and improve electricity output. The next section covers potentail R&D projects and how they can improve the NPV of the baseline geothermal power plant evaluated here. | |||
==Portfolio of R&D Projects and Prototypes== | ==Portfolio of R&D Projects and Prototypes== | ||
This section evaluates potentail R&D efforts to improve the NPV for the baseline geothermal power plant used in the financial model. In the table below, each potentail R&D innovation is evaluated for it's NPV change. This NPV change is broken down into two components, the value change for the "Installer" or entity that drills the geothermal boreholes and installs the surface power plant, and the "Operator" or entity that purchases the completed facility and is responisble for operation and electricity sales through the plant lifetime. It is important to note that for this change in NPV analysis for each innovation, the entire cost of R&D is covered by the Installer. This generally produces a negative project NPV for the installer, while producing a positve NPV for the operator. This is due to the cost of the R&D not being transfered into the overall cost of the facility. The change in facility installation benefits are captured and represented in the sale price of the facility from the Installer to the Operator, but the R&D costs required to achieve that change rest solely with the Installer. This remains constant through all innovation comparisons. These comparrisons do not capture the changes to future projects from the Installer, which would also benefit from the R&D investment. | |||
[[File:Geothermal_NPV_Analysis.png|1000px]] | [[File:Geothermal_NPV_Analysis.png|1000px]] | ||
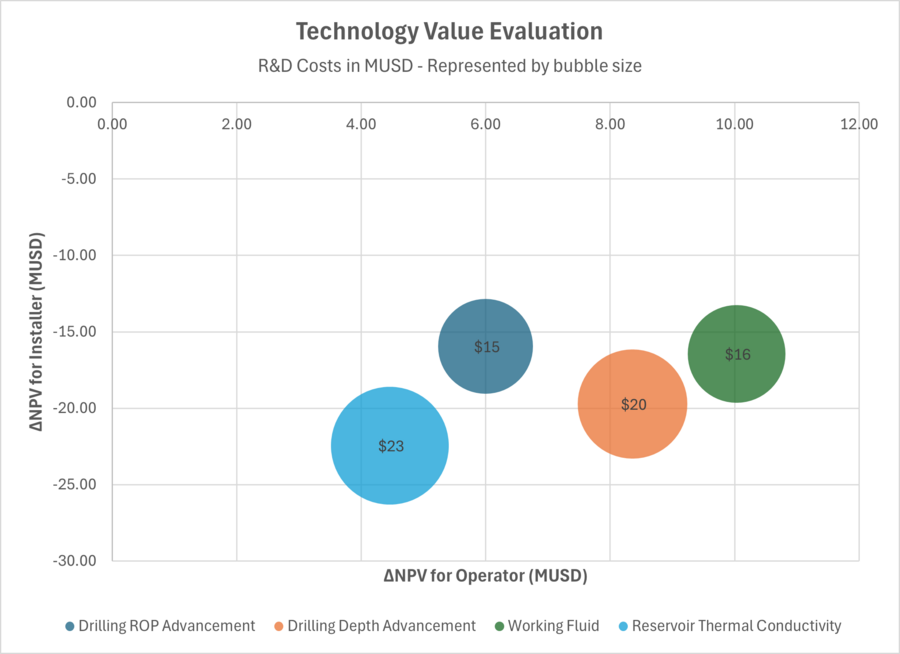
The following Technology Value Evaluation plot shows how each innovation provides value for the Installer and the Operator. The ultimate goal for each innovation is to provide value to both parties in excess of the cost of the innovation. The "Utopia Point" for this particular plot is the upper righthand corner where the change in NPV for the Operator is the highest and the change in NPV for the Installer is the least negative. The size of the bubble represents the relative cost of the R&D investment and the total R&D cost is shown inside each bubble. | |||
[[File:Geothermal_Technology_Value_Evaluation.png|900px]] | [[File:Geothermal_Technology_Value_Evaluation.png|900px]] | ||
This plot can be used to prioritize future R&D efforts to create the maximum value per unit of R&D cost. | |||
==Key Publications and Patents== | ==Key Publications and Patents== | ||
| Line 198: | Line 304: | ||
[[File:Millimeter_Wave_Drill_Patent_Diagram.png|center|Millimeter-Wave Boring System|700px]] | [[File:Millimeter_Wave_Drill_Patent_Diagram.png|center|Millimeter-Wave Boring System|700px]] | ||
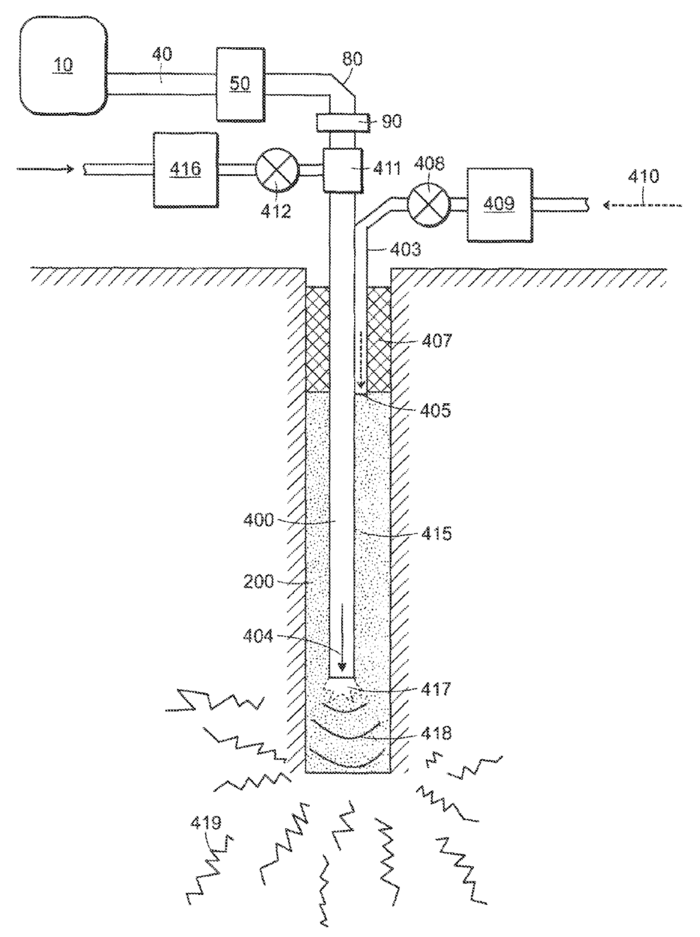
The Millimeter-Wave Drilling System patent (US Patent # 8,393,410 B2) is classified as E21B 7/14 in the Cooperative Patent Classification (CPC) system. In this system, E21B refers to technology related to Earth of Rock Drilling; Obtaining oil, gas, water, soluble or meltable materials or a slurry of minerals from wells and 7/14 | The Millimeter-Wave Drilling System patent (US Patent # 8,393,410 B2) is classified as E21B 7/14 in the Cooperative Patent Classification (CPC) system. In this system, E21B refers to technology related to Earth of Rock Drilling; Obtaining oil, gas, water, soluble or meltable materials or a slurry of minerals from wells and 7/14 adds the modifier Drilling by use of heat; e.g. flame drilling (CPC: E21B 7/14). We identified this system during our disruptive technology analysis. The classification of this system as using “flame drilling” instead of high energy waves likely identifies the novelty of the technology in the E21B “Earth and Rock Drilling” field. The Millimeter-Wave Drilling System identified in this patent uses millimeter waves generated by a gyrotron and funneled into a borehole by a proprietary waveguide to radically heat the rock at the leading edge of the hole. This rock can be heated to temperatures sufficient to vaporize the rock. This vapor is then exfiltrated out of the borehole using a purge gas system to allow for continuous advancement. If brought into commercial operation, this technology claims to radically decrease the cost of well boring at extreme depths. This would significantly change the cost considerations when considering implementing a geothermal power system. | ||
| Line 219: | Line 325: | ||
We aim to develop an Advanced Geothermal System (AGS) capable of functioning at moderate depths and within geothermal reservoirs in excess of 375 degrees Celcius. This AGS system will need to utilize advanced well-drilling techniques and experience to increase the drilling rate of penetration (ROP) by 25% faster than the current standards. This will reduce the overall cost of our AGS installation, ensuring the project is economically viable. This system will also use enhanced borehole materials and fracture configurations to increase the system's overall thermal conductivity by 20% beyond the capabilities of the native reservoir formation. | We aim to develop an Advanced Geothermal System (AGS) capable of functioning at moderate depths and within geothermal reservoirs in excess of 375 degrees Celcius. This AGS system will need to utilize advanced well-drilling techniques and experience to increase the drilling rate of penetration (ROP) by 25% faster than the current standards. This will reduce the overall cost of our AGS installation, ensuring the project is economically viable. This system will also use enhanced borehole materials and fracture configurations to increase the system's overall thermal conductivity by 20% beyond the capabilities of the native reservoir formation. | ||
The technology required to build this AGS will be developed and iterated on through four R&D projects. The first project will incorporate supercritical CO2 as the working fluid. This will allow us to maintain greater net electrical output from our current shallow closed-loop wells. Our next focus will be increasing our drilling ROP through our Rapid Drilling Project. This project will focus on developing advanced drilling techniques and reducing the learning curve associated with borehole drilling. The next project will utilize this more rapid drilling and new materials R&D to reach greater depths for AGS installation. This will allow us to access hotter geothermal reservoirs, increasing our system's net electricity output. Lastly, we will develop new methods of enhanced borehole fracturing and installation to increase the overall thermal conductivity of the geothermal well. This will involve utilizing materials with higher thermal conductivity, like carbon nanotubes, and increasing the overall conductivity surface area to increase the rate at which heat can be drawn from a reservoir. | The technology required to build this AGS will be developed and iterated on through four R&D projects. The first project will incorporate supercritical CO2 as the working fluid. This will allow us to maintain greater net electrical output from our current shallow closed-loop wells. Our next focus will be increasing our drilling ROP through our Rapid Drilling Project. This project will focus on developing advanced drilling techniques and reducing the learning curve associated with borehole drilling. The next project will be a demonstrator. It will utilize this more rapid drilling and new materials R&D to reach greater depths for AGS installation. This will allow us to access hotter geothermal reservoirs, increasing our system's net electricity output. Lastly, we will develop new methods of enhanced borehole fracturing and installation to increase the overall thermal conductivity of the geothermal well. This will involve utilizing materials with higher thermal conductivity, like carbon nanotubes, and increasing the overall conductivity surface area to increase the rate at which heat can be drawn from a reservoir. | ||
[[File: | [[File:GPP_Swoosh.png|1000px]] | ||
==References== | ==References== | ||
*Augustine, C. (2011). Updated U.S. Geothermal Supply Characterization and Representation for Market Penetration Model Input. NREL/TP-6A20-47459. Golden, CO: National Renewable Energy Laboratory. Accessed June 25, 2018: https://www.osti.gov/biblio/1027673. | |||
*Beckers, K. F., Lukawski, M. Z., Reber, T. J., Anderson, B. J., Moore, M. C., & Tester, J. W. (n.d.). INTRODUCING GEOPHIRES V1.0: SOFTWARE PACKAGE FOR ESTIMATING LEVELIZED COST OF ELECTRICITY AND/OR HEAT FROM ENHANCED GEOTHERMAL SYSTEMS. | |||
*Blackwell, D., Richards, M., Frone, Z., Ruzo, A., Dingwall, R., & Williams, M. (2011). Temperature-At-Depth Maps For the Conterminous US and Geothermal Resource Estimates. GRC Transactions, 35(GRC1029452). | |||
*Blankenship, D., 2024. Pathways to Commercial Liftoff: Next Generation Geothermal Power, US. Department of Energy report. | |||
*El-Sadi, Kareem, et al. "Review of drilling performance in a horizontal EGS development." Proceedings, 49th Stanford Workshop on Geothermal Reservoir Engineering. 2024. | |||
*Fercho, S., Matson, G., McConville, E., Rhodes, G., Jordan, R. and Norbeck, J., 2024. Geology, temperature, geophysics, stress orientations, and natural fracturing in the Milford Valley, UT informed by the drilling results of the first horizontal wells at the Cape Modern Geothermal Project. In Proceedings, 49th Workshop on Geothermal Reservoir Engineering, Stanford University. | |||
*Finnila, A., Damjanac, B. and Podgorney, R., 2023, February. Development of a discrete fracture network model for Utah FORGE using microseismic data collected during stimulation of well 16A (78)-32. In 48th Workshop on Geothermal Reservoir Engineering, Stanford University, Stanford, California. | |||
*Limberger, J., Calcagno, P., Manzella, A., Trumpy, E., Boxem, T., Pluymaekers, M. P. D., & Van Wees, J.-D. (2014). Assessing the prospective resource base for enhanced geothermal systems in Europe. Geothermal Energy Science, 2(1), 55–71. https://doi.org/10.5194/gtes-2-55-2014 | |||
*Litwin, R. Z, Zillmer, A. J, Hoffmand, N. J, von Arx, A. V, Wait, D. (2010). Supercritical CO2 Turbine For Use In Solar Power Plants. U.S. Patent No. 7,685,820 B2. U.S. Patent and Trademark Office | |||
*Lowry, T. S., Finger, J. T., Carrigan, C. R., Foris, A., Kennedy, M. B., Corbet, T. F., Doughty, C. A., Pye, S., & Sonnenthal, E. L. (n.d.). GeoVision Analysis Supporting Task Force Report: Reservoir Maintenance and Development. | |||
*Muir, Mark P. and Eastman, Alan D (2023). Geothermal Loop Energy Production Systems. U.S. Patent No. 11,674,504 B2. U.S. Patent and Trademark Office | |||
*Robins, J. C., Kesseli, D., Witter, E., & Rhodes, G. (2022). 2022 GETEM Geothermal Drilling Cost Curve Update: Preprint. Renewable Energy. | |||
*Toews, M. and Holmes, M., 2021. Eavor-lite performance update and extrapolation to commercial projects. GRC Transactions, 45, pp.86-109. | |||
*White, M., Vasyliv, Y., Beckers, K., Martinez, M., Balestra, P., Parisi, C., Augustine, C., Bran-Anleu, G., Horne, R., Pauley, L., Bettin, G., Marshall, T., & Bernat, A. (2024). Numerical investigation of closed-loop geothermal systems in deep geothermal reservoirs. Geothermics, 116, 102852. https://doi.org/10.1016/j.geothermics.2023.102852 | |||
*Woskov, Paul and Cohn, Daniel (2013).Millimete-Wave Drilling System. U.S. Patent No. 8,939,410 B2. U.S. Patent and Trademark Office | |||
Latest revision as of 18:18, 5 December 2024
Roadmap Creators: Mehawesh Alkhalil, David Brown, Cody Seckfort
Technology Roadmap
Roadmap Overview
Technology Description: Geothermal power plants generate electricity by harnessing geothermal energy through a series of steps. First hot geothermal fluid is brought to the surface and passed through a heat exchanger, transferring its heat to a working fluid. This working fluid, now heated, drives a turbine, which powers a generator to produce electricity. Afterward, the working fluid is cooled and condensed back into a liquid form before being recirculated through the heat exchanger to repeat the process. Conventional geothermal energy relies on a reservoir of hot fluid that is close to the surface, and has high enough porosity and permeability for fluid to be extracted at sufficient rates to power the turbine. The locations where such reservoirs exist are fairly limited, which is why overall geothermal is not a large part of the current energy mix. Recent advancements in next generation geothermal technologies are greatly expanding the geographic area where geothermal energy is viable. There are 2 main categories of next generation geothermal: enhanced geothermal systems (EGS), and closed loop systems, also known as advanced geothermal systems (AGS). In EGS injector and producer wells are drilled into deep hot rock formations, and then connected via hydraulic fracturing to create a geothermal reservoir. AGS directly connects the injector and producer and the whole system is cased in steel so the circulated fluid does not directly interact with the rock. EGS is able to extract more heat from a volume of rock because of the much greater surface area of the fracture network as compared to the surface area of a steel pipe. Proponents of AGS point to its lower maintenance, lower risk of induced seismicity, and lack of water-rock interactions which can result in undesirable chemical reactions.
Source: Blankenship, D., 2024. Pathways to Commercial Liftoff: Next Generation Geothermal Power, US. Department of Energy report.
Source: Blackwell, D., Richards, M., Frone, Z., Ruzo, A., Dingwall, R., & Williams, M. (2011). Temperature-At-Depth Maps For the Conterminous US and Geothermal Resource Estimates. GRC Transactions, 35(GRC1029452).
The maps above show the distribution of high temperature rocks suitable for next generation geothermal development across the US. In general, geothermal electricity generation is feasible anywhere where the temperatures are above ~150 C. Cooler geothermal resources may still be of interest for direct use applications such as heating buildings. The left map shows temperatures at a depth of 3.5 km, which is accessible using current drilling technologies. The right map shows temperature at 10 km depth, which is currently out of reach and/or highly uneconomical with current drilling capabilities. There are several efforts underway to develop advanced drilling techniques to access the enormous amount of energy stored in these deep rocks.
Design Structure Matrix (DSM) Allocation
The Geothermal Power Plant (2GTP) is a key component of sustainable energy objectives, requiring five Level 3 enabling technologies categorized as follows:
Above Surface Technologies:
3EMEP (Electro-magnetic Electricity Production): Critical for electricity generation above ground.
Subsurface Technologies:
3GEOS (Geological Survey): Identifies areas with high geothermal potential.
3GDR (Ground Drilling): Enables drilling and fracking near geothermal reservoirs.
Integrated Surface and Subsurface Technologies:
3HYD (Hydraulics) and 3HTT (Heat Transfer): Applicable across both surface and subsurface operations.
This roadmap primarily focuses on the subsurface aspects of the geothermal power plant, highlighting the following Level 4 technologies essential for the Level 3 systems:
4IPWP: Injection, production, and horizontal geothermal pipes.
4GTR: Geothermal reservoir.
4GTF: Geothermal fluid.
This Design Structure Matrix comprises 11 Level 3 elements representing both subsurface and above-surface components of geothermal power plants. It maps 40 total connections among these elements, including 18 physical connections, 18 mass flow connections, and 4 energy flow connections.
Roadmap Model using OPM
This Object-Process Methodology (OPM) diagram outlines the key components of a geothermal power plant and the processes involved in converting geothermal heat into electricity.
• Geothermal Reservoir and Fluid Heating:
The geothermal reservoir heats the circulating geothermal fluid, whether in Enhanced Geothermal Systems (EGS) or Advanced Geothermal Systems (AGS). The heat transfer depends on the reservoir temperature, which is influenced by the depth of horizontal pipes—greater depth results in higher temperatures. The effective thermal radius, defining the accessible heat radius of the reservoir, also affects the fluid’s final temperature.
• Heat Transfer and Power Generation:
Heated geothermal fluid transfers energy to a working fluid via a heat exchanger if a separate working fluid is used. The vaporized working fluid drives a turbine, spinning a generator to produce electricity. The system uses a condenser, cooling water, and a cooling pump to condense the working fluid, which is then reinjected into the reservoir.
• Competitors and Metrics:
The diagram highlights key competitors, such as Utah Forge and the Fervo Cape Project, and identifies critical performance metrics, which are explored further in this roadmap.
Figures of Merit
| FOM | Unit | Description |
|---|---|---|
| Levelized Cost of Energy (LCOE) | $/MWh | The cost per unit of energy generation considering the lifetime costs of the facility |
| Avearge Power | MW | The average power capacity of the plant. This is a determined by the geothermal fluid heat capacity, flow rate, and the heat available in the geothermal reservoir |
| Project Capital Expexditure (CAPEX) | $/kW | The total cost of the geothermal power plant normalized by the plant power production |
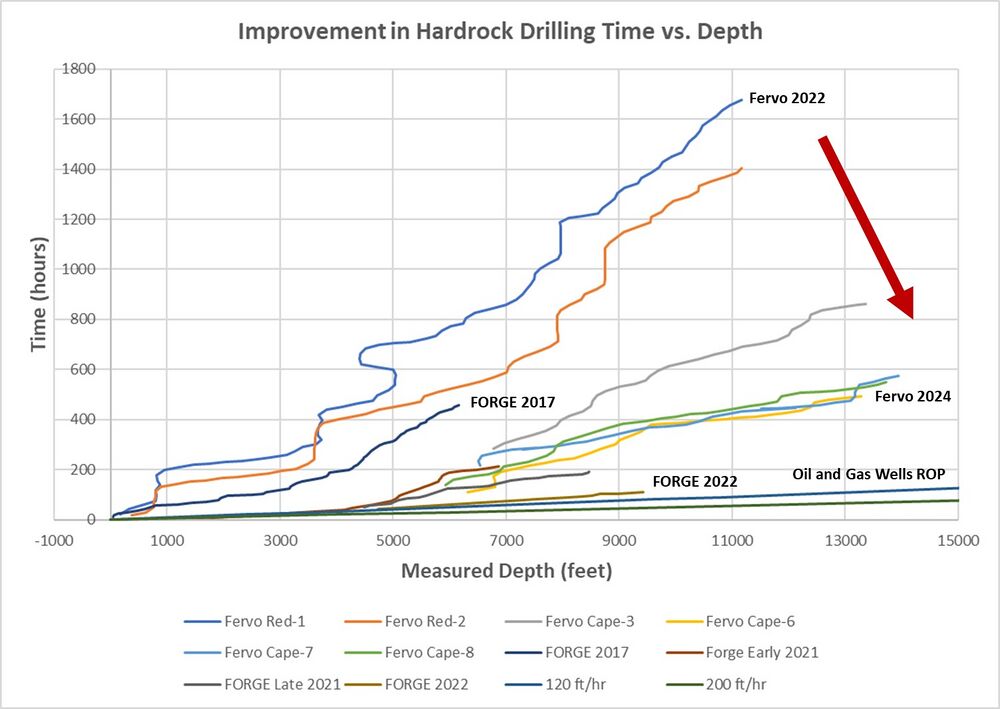
| Drilling Rate of Penetration | ft/hour | The rate at which the geothermal system can be drilled. While this only considers the installation of the geothermal power plant, the bore cost and time represent between 40-75% of the plant's lifecycle costs (Robins et al.) |
Plot made with data from El-Sadi et al., 2024, and Blankenship 2024.
Alignment with Company Strategic Drivers
As a new company in the geothermal power production market, the effective thermal radius is the most sensitive design parameter that would allow us to make significant gains in the energy extracted. To increase this thermal radius, significant R&D will have to be invested in drilling technologies to enable the drilling of several web-like, closed-loop structures at the geothermal reservoir in order to maximize the heat extracted. Advancements in these drilling technologies will allow us to keep the cost low and maintain the current industry LCOE for AGS systems.
Alignment with company strategic drivers
| Strategic Driver | Alignment and Target |
|---|---|
| To develop a reliable geothermal powerplant that utilizes advanced drilling technologies, creating a closed-loop system that intersects a large volume of the geothermal reservoir to compete with the capacity of EGS while maintaining the reliability of AGS | The roadmap will target an average power output of 10 MW while decreasing the CAPEX to $7000/kW |
Positioning of Company vs. Competition
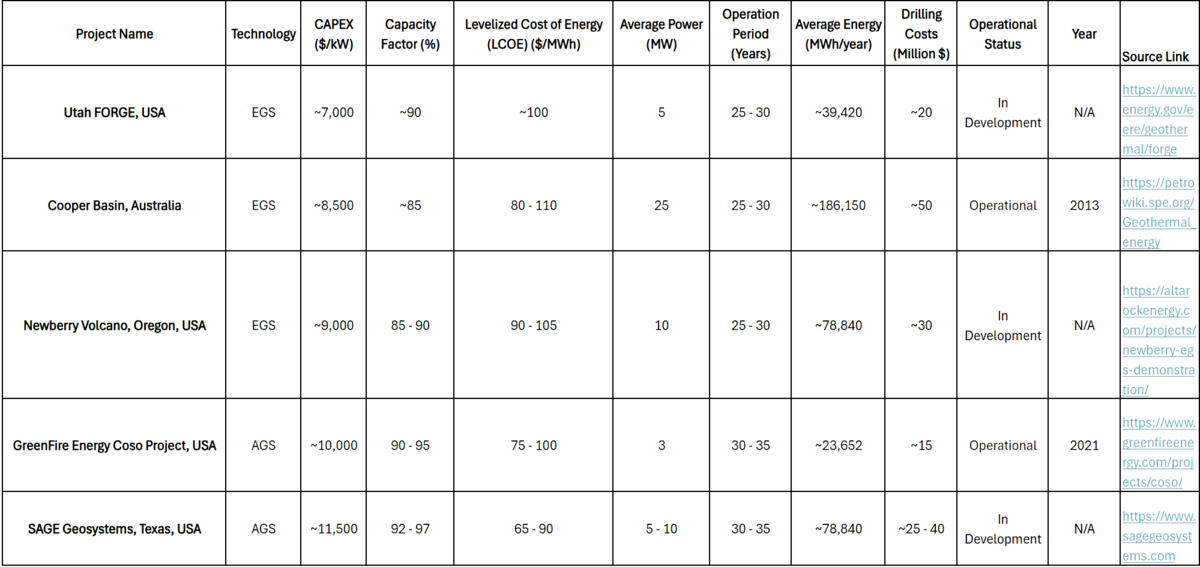
The key observations from the competitor analysis include the higher CAPEX required for AGS systems compared to EGS systems, a lower overall LCOE for AGS systems, and the differences in expected energy output and operational period between AGS and EGS. The two projects utilizing AGS technology include the GreenFire Energy Coso Project and the SAGE Geosystems Project, both located in the United States. The higher CAPEX for the AGS projects indicated the higher cost of implementing closed-loop systems. A higher CAPEX would usually lead to a higher project LCOE, but that is not true for the AGS projects. Both AGS projects have a lower expected LCOE than the EGS projects. The average power output for each AGS project is not significantly higher than that of the EGS projects, but the expected operation periods are longer. Therefore, companies utilizing AGS technology focus on lower and more consistent energy output over longer periods of time, whereas EGS technology will focus on more rapid utilization of a geothermal reservoir.
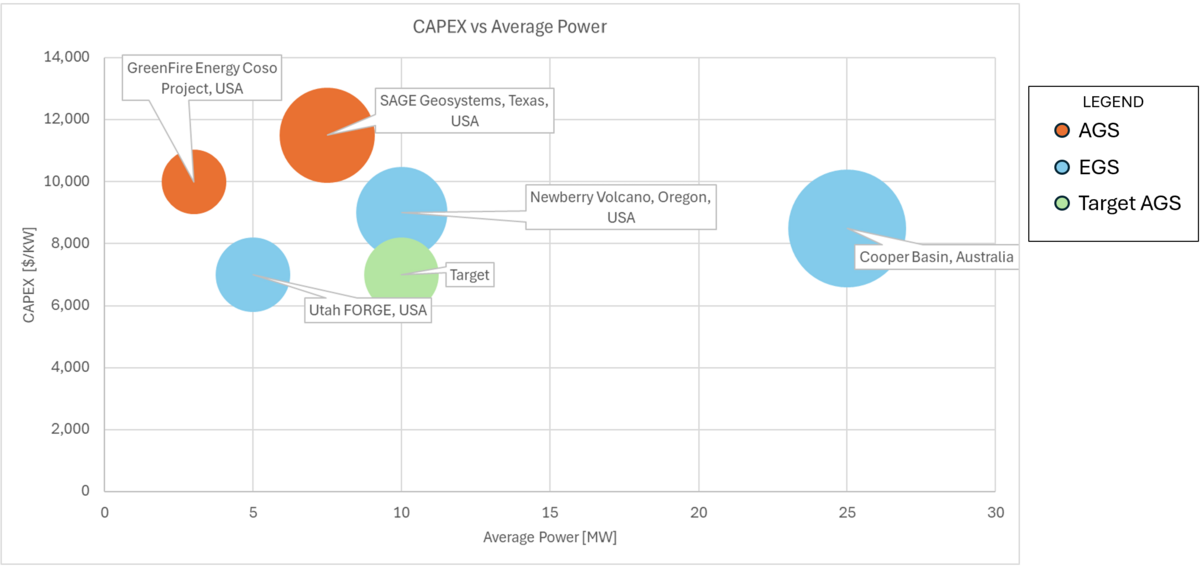
This roadmap targets an AGS with an average power of 10 MW and a CAPEX of $7,000/kW. This target would establish an AGS with competative power generation in relation to existing EGS, while significanlty reducing the CAPEX to align with current EGS. This would provide the economic utility of an EGS while maintaining the longer anticipated plant lifetime associated with AGS.
Technical Model
Morphological Matrix
A morphological matrix is used to determine the potential design vectors for the development of a technical model for the geothermal power plant.
Model Structure
The Levelized Cost of Energy (LCOE) is a significant figure of merit when comparing these design vectors. The LCOE provides a metric in $/kWh that can be compared across all electricity generation systems.
This equation includes the lifetime costs of the system in the numerator and the lifetime energy produced in the denominator. In this equation, I is the total capital cost of the project paid in year t, M is the total operations and maintenance cost (O&M) paid in year t, F is the total fuel cost paid in year t, r is the discount rate applied to the project, E is the earnings for year t, and t represents the year of the project. The costs are determined by the type of geothermal power plant used and the process used to extract heat from the Earth. The energy produced is determined by understanding how much heat is available in a finite volume of the Earth, how much can be extracted, and how efficiently the chosen geothermal power plant system can convert that heat into usable energy.Due to the complexity of the energy generation model and the differences in technical heat extraction principles with varying design vectors, we chose to first focus on the first-order energy production equation, utilizing the theoretical potential equation. We then use this energy generation equation and estimated costs to determine the LCOE.
A single general equation for electricity generation from these systems is desirable to generate a tradespace of advanced geothermal concepts, including both enhanced geothermal systems (EGS) and closed loop systems (AGS). One approach to accomplish this is to use a volume-based estimation of recoverable heat with input variables that apply to both systems.
In this equation, Q is the product of a dimensionless recovery factor (R), the density of the rock (ρ), the heat capacity of the rock (C), the rock volume (V), and the temperature drop over the life of the system (ΔT)
Here, the average electrical power output (We) over the lifetime of a geothermal system could be expressed as the recoverable heat (Q), multiplied by a conversion efficiency factor (η), divided by the life of the plant (t) (or the life of a geothermal well) which we will assume to be 30 years.
In this equation, Q is the product of a dimensionless recovery factor (R), the density of the rock (ρ), the heat capacity of the rock (C), the rock volume (V), and the temperature drop over the life of the system (ΔT) (Augustine, 2011). In practice, there is a limit to the allowable temperature drop over the power plant's life imposed by the plant design; an average value of ΔT = 10°C has been suggested as a practical constraint (Augustine, 2011). This is somewhat counterintuitive as it results in the recoverable heat not being a function of reservoir temperature. We have chosen a more optimistic characterization of recoverable heat using a ΔT of 10% of the initial reservoir temperature. This more optimistic assumption could be justified by infill drilling. As the reservoir is thermally depleted, the well's flow rate must be reduced if we want to maintain the same temperature. Hence, we can still produce fluid at the required temperature at lower rates. It is reasonable to assume that it is desirable to extend the life of a plant with infill drilling. This allows us to extract more heat and value from each well. The impact of the reservoir temperature is accounted for in the conversion efficiency factor. A conservative recovery factor of 20% was suggested by Augustine 2011. The reservoir rock volume from which we extract heat is perhaps the most important and also one of the most difficult to constrain variables (as is the case in analogous systems of unconventional oil and gas reservoirs). Assuming a horizontal geothermal well, the thermally depleted rock volume could be approximated by the product of the lateral length of the well and pi multiplied by an effective radius of thermal depletion squared. This effective radius (r) is the main difference between EGS and closed-loop systems. For closed-loop systems (unless the reservoir has sufficient porosity and permeability to allow convection to occur), the effective radius of thermal depletion can be derived as a function of time and thermal diffusivity (α) of the reservoir. Assuming a well life of 30 years and a diffusivity of 1.57 E-6 (Toews & Holmes, 2021), this results in an effective radius of depletion of ~ 60 meters for closed-loop systems. The estimation of effective radius for EGS systems has higher uncertainty due to the complexity of the stimulated rock volume (SRV) created via hydraulic fracturing. A reasonable estimate of ~ 150 meters for the effective radius is supported by microseismic studies conducted at the DOE FORGE site in Utah (Finnila et al., 2023) and is also consistent with the average well spacing employed by Fervo at their Cape project (Fercho et al., 2024). This is a gross oversimplification of the physics, as, in reality, EGS entails an injector well and a producer linked via the hydraulically stimulated fracture network. Hence, in a closed loop where we have a temperature transient that reaches the full effective radius towards the end of the 30-year well life, in EGS, we immediately begin to sweep the reservoir volume between the wells. The model proposed here employs a binary value for effective radius, assuming a radius of 60 meters for closed-loop systems and a radius of 150 meters for EGS systems. The dimensionless efficiency factor (η) is characterized in our model as a function of temperature based on a linear fit to reported model results by Augustine 2011.
Combining these equations, we obtain an expression for the average electrical power output of an advanced geothermal system:
Like the overall energy production, many considerations are required to determine the overall life-cycle costs for a geothermal power plant. The system costs must be generalized to determine the first-order LCOE equation sensitivity to our design decisions. Due to the complexity of the possible design vectors, we use the system drilling costs in place of the total life-cycle costs. This allows us to compare all possible design vectors using the same cost estimation method. Also, in geothermal energy production, the drilling costs account for over 50% of the total system costs (Lowry et al.). In contrast, the stimulation and other maintenance costs can be insignificant or nearly zero based on the system's design.
There are many methods and models to estimate the drilling costs associated with geothermal energy production. Available models vary in the input parameters and consider various variables to determine the overall drilling cost. These costs are also only an estimate due to the non-homogenous nature of the subsurface. For this analysis, we used the ThermoGIS model to estimate the drilling costs for each design vector. This model uses the following equation to estimate the total cost of drilling based on the combination of well depth and total lateral drilling length (Limberger et al.).
For this cost estimate, s represents a well cost scaling factor with 1.0 or 1.5 used based on the well depth. MD represents the measured depth of the system, combining the total wellbore depth with the total drilled lateral length. Lastly, n represents the number of wells drilled. This parameter becomes important for EGS operations if energy is drawn from a reservoir faster than it can be replenished. In this case, additional wells must be drilled to stimulate the reservoir further.
Sensitivity Analysis
Theoretical Potential Thermal Model
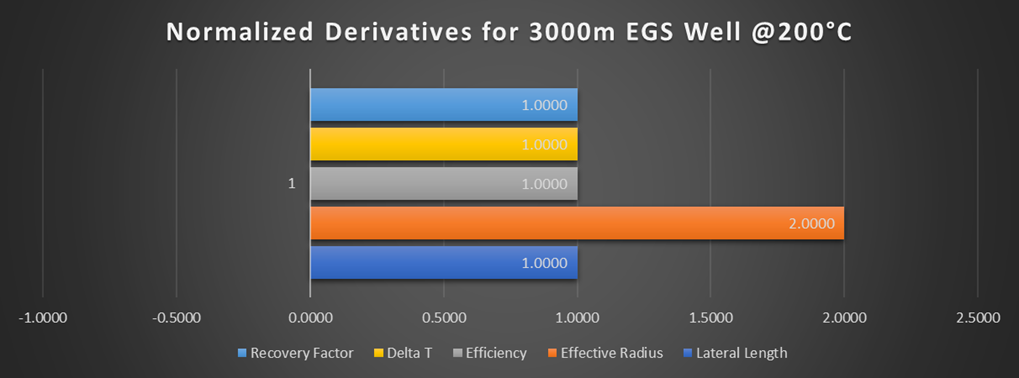
The theoretical potential thermal model sensitivity analysis was done using a 200°C EGS design vector. Variables considered are effective thermal radius, efficiency, recovery factor, lateral length, and delta temperature. See partial derivatives below evaluated for the 200°C EGS design vector.After normalization of the partial derivatives considered, we see that electricity generation is equally sensitive to η, R, ΔT, and L since these variables are all multiplicative in the numerator. The effective thermal radius is the most sensitive variable considered since it is squared.
Drilling Cost Model
Using ThermoGIS drilling cost equation and the finite difference approximation method applied to a design vector representing the proposed Eavor-Loop 2.0 model design vector, we determined the incremental step changes in LCOE. The values of LCOE determined using finite difference approximation are shown in the table below.
Normalization:
Tradespace
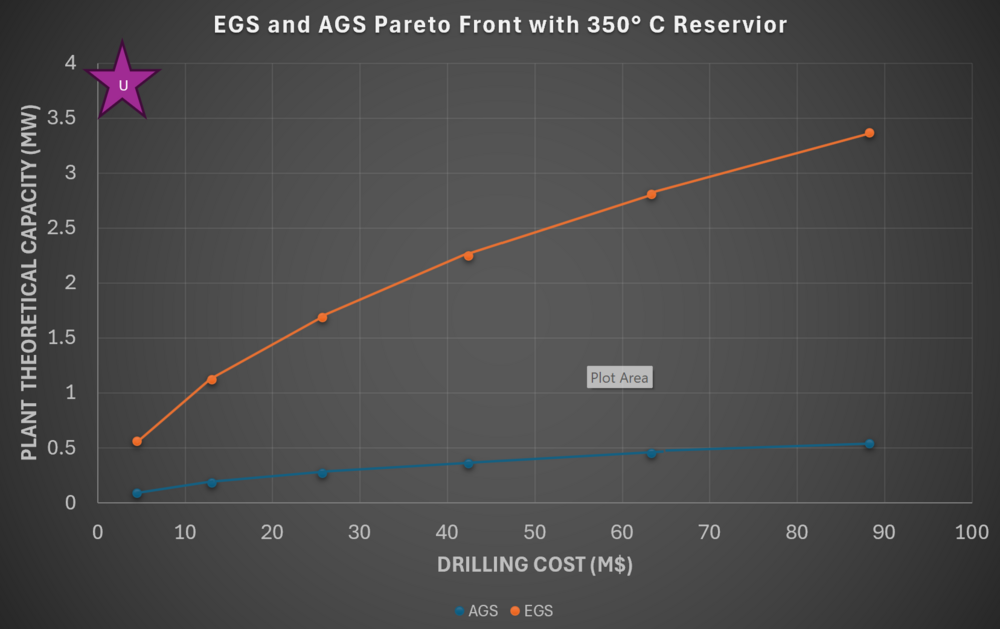
The following initial tradespace explores the relationship between a project's drilling costs, in a million USD, and the anticipated power plant capacity in MW. The design vectors displayed identify the differences in EGS and AGS technologies. The use case for this tradespace includes a geothermal reservoir at 350 degrees Celcius. The growth in drilling costs represents increases in the lateral length drilled. The longer the lateral length, the higher the drilling cost, but also the higher the theoretical plant capacity. This is due to the increase in volume of the reservoir area affected by the system. The larger the reservoir, the higher the theoretical plant capacity. In this plot, the orange points and pareto front represent an EGS while the blue points and pareto front represent an AGS. This shows the comparible theoretical plant capacities between EGS and AGS with identical depths and lateral lengths (effective drilling length). With the same effective drilling length, EGS provides significantly more capacity than AGS, with the difference growing with increased drilling costs.
Financial Model
A Net Present Value (NPV) financial model is used to determine the financial feasibility of the geothermal power plant. The NPV model is a common method for evaluating multiple projects by converting all future revenues and expenses into a present value to account for time and opportunity costs. To determine the overall NPV of the geothermal power plant project, the expected cashflows for each year of the project are estimated and then converted to a present value using a discount rate. The NPV for the geothermal power plant will be used to compare potential R&D and other improvement projects to help determine the financial benefit of these projects. To establish the baseline NPV, a geothermal power plant use case and facility design vector must be established to conduct a comparrison. The following design parameters to establish this baseline:
| Parameter | Value |
|---|---|
| Configuration | U-Loop with 1 Lateral |
| Heat Transfer Fluid | Water |
| Flow Rate | 20 kg/s |
| Vertical Depth | 5 km |
| Lateral Length | 10 km |
| Geothermal Gradient | 60 degrees C / km |
| Borehole Diameter | 0.2159m |
| Injection Temperature | 60 degrees C |
| Rock Thermal Conductivity | 3 W/m-K |
| Rock Specific Heat Capacity | 790 J/kg-K |
| Rock Density | 2,750 kg/m^3 |
| Dead State Temperature | 20 degrees C |
| Paramter | Value |
|---|---|
| System Lifetime | 30 Years |
| Drilling Cost | $1,000/m |
| O&M Cost as percentage of plant capital cost | 1.5% |
| Power Plant Cost | $3,000/kWe |
| Discount Rate | 7% |
| Loan Finance Rate | 6% |
| Power Purchase Agreement Sale Price | $70/MWh |
These geothermal power plant design parameters were evaluated using the NREL GEOPHIRES software (Beckers et al. 2023) to determine the annual expenses and revenue for the plant. This is an model improvement from the potential heat and drilling cost model used in the previous section. The GEOPHIRES model provides a more robust estimate for net power output and costs associated with the plant. In this model, the net power output captures plant conversion efficiencies and the reserviour thermal decay over time. It also captures the expected operation and maintenance cost and surface plant installation costs based on the power output from the facility.
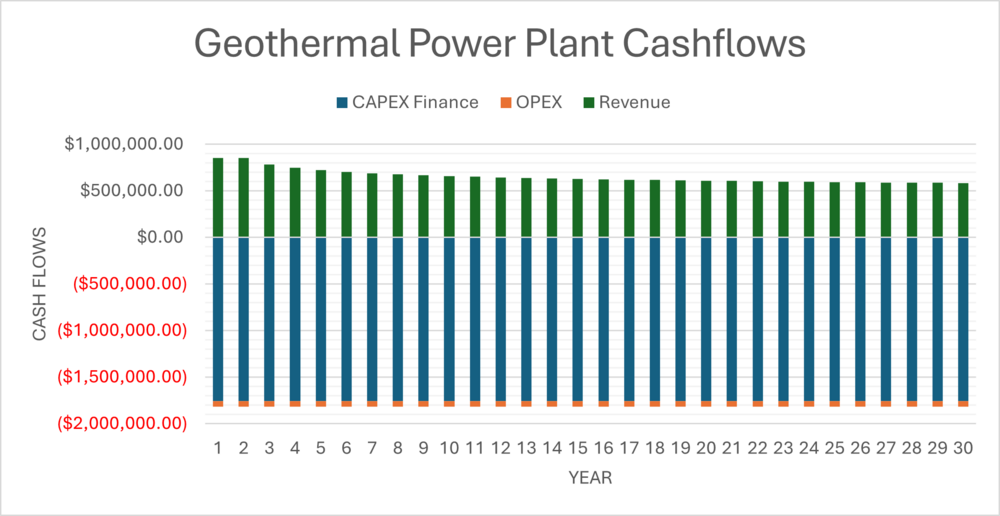
Using the parameters shown above, this model produces a total plant installation cost and the estimated net power output by year and the expected operation and maintenance costs (O&M) per year of operation. The to determine the yearly cashflow for this NPV model, the capital expenditure (CAPEX) for the plant is financed at 6% over the 30 year lifetime of the plant. This produces a yearly loan payment for our model. This CAPEX loan payment, O&M costs, and revenue from electricity sales produces the yearly cashflow. The following table shows the average value for each of these components through the lifetime of the plant:
| Component | Value |
|---|---|
| Revenue from Electricity Sales | $645,712.10 |
| CAPEX Loan Payment | $1,758,103.66 |
| OPEX (O&M) | $62,500.00 |
| Cash Flows | -$1,174,891.56 |
The values for CAPEX Loan Payment and OPEX are subtracted from the Revenue from Electricity Sales to produces the annual cashflow. The graph below shows how each of these values compares over the 30 year lifetime of the project.
Overall, this produces a NPV of -$14,993,990.64. This negative NPV shows that as of now, an AGS system with one lateral is not a viable commercial project. Currently, AGS facilities are not financially self-sustainable and focus more on R&D efforts to reduce installation costs and improve electricity output. The next section covers potentail R&D projects and how they can improve the NPV of the baseline geothermal power plant evaluated here.
Portfolio of R&D Projects and Prototypes
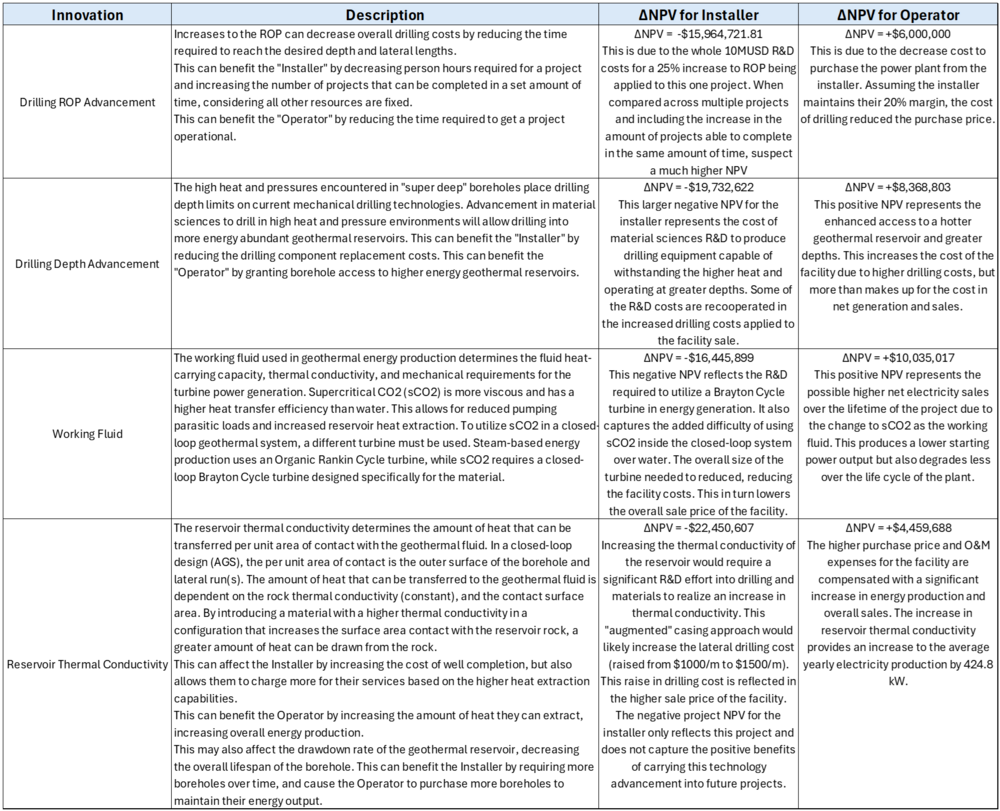
This section evaluates potentail R&D efforts to improve the NPV for the baseline geothermal power plant used in the financial model. In the table below, each potentail R&D innovation is evaluated for it's NPV change. This NPV change is broken down into two components, the value change for the "Installer" or entity that drills the geothermal boreholes and installs the surface power plant, and the "Operator" or entity that purchases the completed facility and is responisble for operation and electricity sales through the plant lifetime. It is important to note that for this change in NPV analysis for each innovation, the entire cost of R&D is covered by the Installer. This generally produces a negative project NPV for the installer, while producing a positve NPV for the operator. This is due to the cost of the R&D not being transfered into the overall cost of the facility. The change in facility installation benefits are captured and represented in the sale price of the facility from the Installer to the Operator, but the R&D costs required to achieve that change rest solely with the Installer. This remains constant through all innovation comparisons. These comparrisons do not capture the changes to future projects from the Installer, which would also benefit from the R&D investment.
The following Technology Value Evaluation plot shows how each innovation provides value for the Installer and the Operator. The ultimate goal for each innovation is to provide value to both parties in excess of the cost of the innovation. The "Utopia Point" for this particular plot is the upper righthand corner where the change in NPV for the Operator is the highest and the change in NPV for the Installer is the least negative. The size of the bubble represents the relative cost of the R&D investment and the total R&D cost is shown inside each bubble.
This plot can be used to prioritize future R&D efforts to create the maximum value per unit of R&D cost.
Key Publications and Patents
Key publications and patents pertaining to geothermal power plants incorporate various technologies and functional areas. This analysis's key publications and patents correlate to three functional areas related to geothermal power plants. These areas include drilling, subsurface resource extraction systems, and surface generation systems.
Publications
Sandia GeoVision Analysis Report - T. S. Lowry et al., “GeoVision Analysis Supporting Task Force Report: Reservoir Maintenance and Development”
The Sandia GeoVision Analysis report is widely cited as a reference for drilling considerations on all geothermal well development. This report provides a baseline for drilling costs given different borehole diameters and drilling directions. The drilling analysis includes bit design, environmental considerations, non-drilling activities, reservoir stimulation mechanisms and their associated costs, and hydraulic performance. These considerations are oriented on performance and cost, producing well cost curve scenarios for many drilling situations. This provides a significant resource in planning geothermal borehole development without requiring experience in the specific characteristics of the location or development. This report also includes maintenance and management practices to ensure enthalpy production remains within planned bounds. The combination of drilling costs tied to capital expenditure and maintenance and management costs provides a strong resource for estimating the overall costs needed for a levelized cost of electricity assessment.
Numerical Investigation of Closed-loop Geothermal Systems in Deep Geothermal Reservoirs - M. White et al., “Numerical investigation of closed-loop geothermal systems in deep geothermal reservoirs,” Geothermics, vol. 116, p. 102852, Jan. 2024, doi: 10.1016/j.geothermics.2023.102852.
The numerical model presented by White et al., in conjunction with multiple national labs and universities, collects data and processes from many sources and integrates them into a working web-based application. This application, called GeoCluster, provides an estimate for geothermal production and economic viability considering seven input parameters. These parameters are mass flow rate, horizontal extent, vertical drilling depth, rock geothermal gradient, borehole diameter, injection temperature, and rock thermal conductivity. To construct this model, the team integrated multiple computational models developed independently by each laboratory. These models focused on the heat recovery mechanisms of a closed-loop system in deep geothermal reservoirs. The models were integrated to incorporate advantages found in each and then validated using data from the active Utah FORGE geothermal testing site. This subsurface model becomes the Sandia HDR (hot-dry-rock) model. This model was combined with the surface generation model provided by NREL to produce the full GeoCLUSTER application. Overall, this application provides a significant asset to entities entering the geothermal power market by providing accurate cost and benefit estimates for implementing a closed-loop geothermal system considering a range of system and geological constraints.
Patents
Millimeter-Wave Drilling System:
The Millimeter-Wave Drilling System patent (US Patent # 8,393,410 B2) is classified as E21B 7/14 in the Cooperative Patent Classification (CPC) system. In this system, E21B refers to technology related to Earth of Rock Drilling; Obtaining oil, gas, water, soluble or meltable materials or a slurry of minerals from wells and 7/14 adds the modifier Drilling by use of heat; e.g. flame drilling (CPC: E21B 7/14). We identified this system during our disruptive technology analysis. The classification of this system as using “flame drilling” instead of high energy waves likely identifies the novelty of the technology in the E21B “Earth and Rock Drilling” field. The Millimeter-Wave Drilling System identified in this patent uses millimeter waves generated by a gyrotron and funneled into a borehole by a proprietary waveguide to radically heat the rock at the leading edge of the hole. This rock can be heated to temperatures sufficient to vaporize the rock. This vapor is then exfiltrated out of the borehole using a purge gas system to allow for continuous advancement. If brought into commercial operation, this technology claims to radically decrease the cost of well boring at extreme depths. This would significantly change the cost considerations when considering implementing a geothermal power system.
Geothermal Loop Energy Production System:
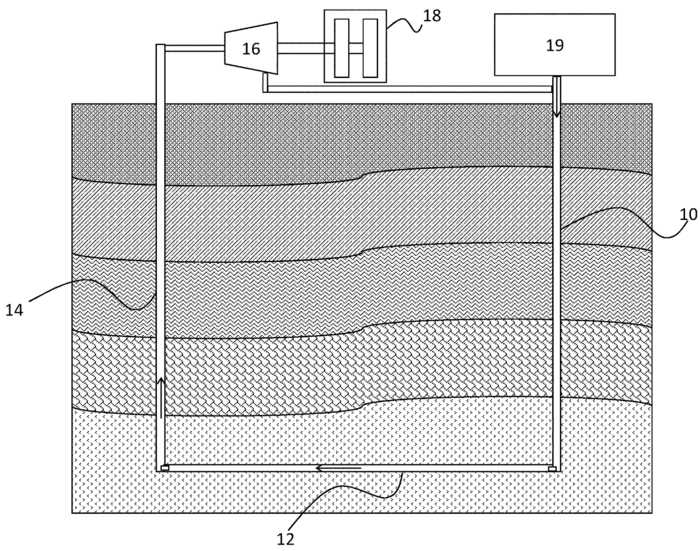
The Geothermal Loop Energy Production System (US Patent # 11,674,504 B2) has two classifications in the CPC system. They are F03G 7/04 and E21B 47/07. F03G 7/04 includes technology Spring, weight, inertia, or like motors; mechanical-power producing devices or mechanisms, not otherwise provided for or using pressure differences of thermal difference occurring in nature (CPC: F03G 7/04). E21B 47/07 includes a similar classification from the drilling technology but differs in purpose. This classification includes Earth or rock drilling, obtaining oil, gas, water, soluble or meltable materials, or a slurry of minerals from wells, and measuring the temperature of boreholes or wells (CPC: E21B 47/07). This technology utilizes the model principles in White et al. to generate electricity using supercritical CO2 (sCO2) in a closed-loop geothermal system. This design connects two vertical boreholes with a horizontal borehole running through a geothermal resource. The heated sCO2 is pumped through this subsurface system to a turbine to generate electricity. Once through the turbine, the sCO2 is compressed and sent back into the subsurface system to extract more heat. This closed-loop system can be implemented in a dry resource and does not require an existing or manufactured reservoir to operate. This increases the locational viability of the system to include more regions without easy access to subsurface permeable areas for heat.
Supercritical CO2 Turbine For Use In Solar Power Plants:
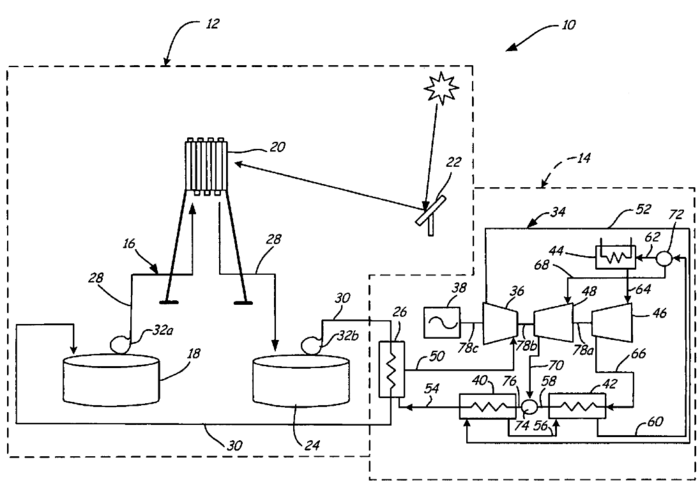
A significant patent related to this area is for a Supercritical CO2 Turbine for use in Solar Power Plants (US Patent # 7,685,820 B2). This system is classified as F03G 6/00 in the CPC. This classification includes Spring, weight, inertia, or like motors; mechanical-power-producing devices or mechanisms not otherwise provided for devices for producing mechanical power from solar energy (CPC: F03G 6/00). This patent may seem out of place when referring to geothermal power production, but the actual design only includes solar power plants to generate the initial heat required to run the turbine. The patent identifies that any process capable of providing heat to a heat exchanger could be an entity utilized in this design. The key piece of this design is the process of heating, compressing, and storing sCO2 as a working fluid to operate a turbine efficiently. This particular sCO2 turbine design is influential because it can utilize the working material with any significant heat resource and takes additional steps to capture unused heat energy to improve generation efficiency. This includes using three separate temperature recuperators to manage the sCO2 energy levels throughout the system. This allows the system to operate on a Brayton cycle, improving system efficiency over the Rankine cycle conversion system. This design also incorporates a heat storage system on the non-sCO2 side of the heat exchanger. This component includes nitrate salt storage tanks to store hot and cold salts during increased load demand.
Technology Strategy Statement
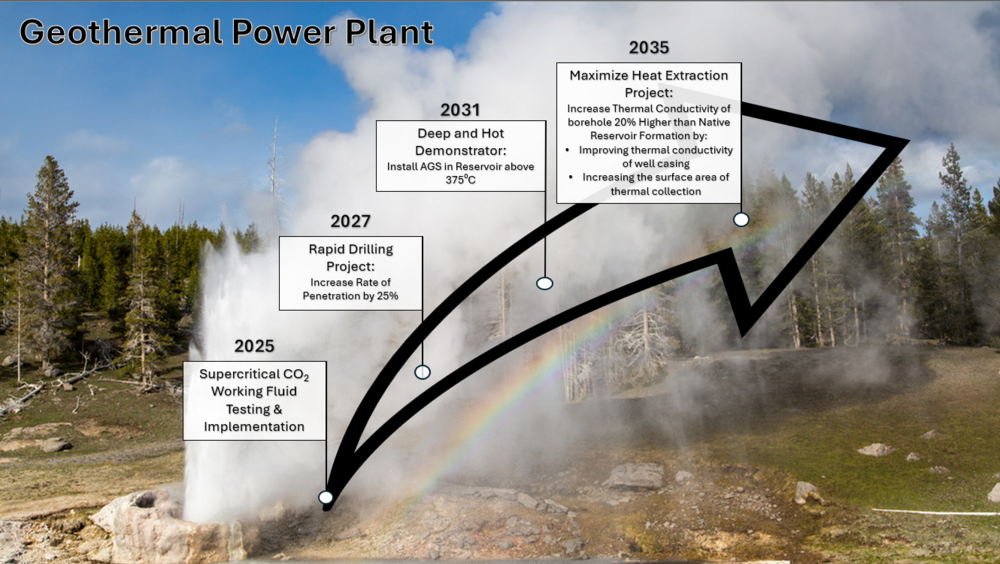
We aim to develop an Advanced Geothermal System (AGS) capable of functioning at moderate depths and within geothermal reservoirs in excess of 375 degrees Celcius. This AGS system will need to utilize advanced well-drilling techniques and experience to increase the drilling rate of penetration (ROP) by 25% faster than the current standards. This will reduce the overall cost of our AGS installation, ensuring the project is economically viable. This system will also use enhanced borehole materials and fracture configurations to increase the system's overall thermal conductivity by 20% beyond the capabilities of the native reservoir formation.
The technology required to build this AGS will be developed and iterated on through four R&D projects. The first project will incorporate supercritical CO2 as the working fluid. This will allow us to maintain greater net electrical output from our current shallow closed-loop wells. Our next focus will be increasing our drilling ROP through our Rapid Drilling Project. This project will focus on developing advanced drilling techniques and reducing the learning curve associated with borehole drilling. The next project will be a demonstrator. It will utilize this more rapid drilling and new materials R&D to reach greater depths for AGS installation. This will allow us to access hotter geothermal reservoirs, increasing our system's net electricity output. Lastly, we will develop new methods of enhanced borehole fracturing and installation to increase the overall thermal conductivity of the geothermal well. This will involve utilizing materials with higher thermal conductivity, like carbon nanotubes, and increasing the overall conductivity surface area to increase the rate at which heat can be drawn from a reservoir.
References
- Augustine, C. (2011). Updated U.S. Geothermal Supply Characterization and Representation for Market Penetration Model Input. NREL/TP-6A20-47459. Golden, CO: National Renewable Energy Laboratory. Accessed June 25, 2018: https://www.osti.gov/biblio/1027673.
- Beckers, K. F., Lukawski, M. Z., Reber, T. J., Anderson, B. J., Moore, M. C., & Tester, J. W. (n.d.). INTRODUCING GEOPHIRES V1.0: SOFTWARE PACKAGE FOR ESTIMATING LEVELIZED COST OF ELECTRICITY AND/OR HEAT FROM ENHANCED GEOTHERMAL SYSTEMS.
- Blackwell, D., Richards, M., Frone, Z., Ruzo, A., Dingwall, R., & Williams, M. (2011). Temperature-At-Depth Maps For the Conterminous US and Geothermal Resource Estimates. GRC Transactions, 35(GRC1029452).
- Blankenship, D., 2024. Pathways to Commercial Liftoff: Next Generation Geothermal Power, US. Department of Energy report.
- El-Sadi, Kareem, et al. "Review of drilling performance in a horizontal EGS development." Proceedings, 49th Stanford Workshop on Geothermal Reservoir Engineering. 2024.
- Fercho, S., Matson, G., McConville, E., Rhodes, G., Jordan, R. and Norbeck, J., 2024. Geology, temperature, geophysics, stress orientations, and natural fracturing in the Milford Valley, UT informed by the drilling results of the first horizontal wells at the Cape Modern Geothermal Project. In Proceedings, 49th Workshop on Geothermal Reservoir Engineering, Stanford University.
- Finnila, A., Damjanac, B. and Podgorney, R., 2023, February. Development of a discrete fracture network model for Utah FORGE using microseismic data collected during stimulation of well 16A (78)-32. In 48th Workshop on Geothermal Reservoir Engineering, Stanford University, Stanford, California.
- Limberger, J., Calcagno, P., Manzella, A., Trumpy, E., Boxem, T., Pluymaekers, M. P. D., & Van Wees, J.-D. (2014). Assessing the prospective resource base for enhanced geothermal systems in Europe. Geothermal Energy Science, 2(1), 55–71. https://doi.org/10.5194/gtes-2-55-2014
- Litwin, R. Z, Zillmer, A. J, Hoffmand, N. J, von Arx, A. V, Wait, D. (2010). Supercritical CO2 Turbine For Use In Solar Power Plants. U.S. Patent No. 7,685,820 B2. U.S. Patent and Trademark Office
- Lowry, T. S., Finger, J. T., Carrigan, C. R., Foris, A., Kennedy, M. B., Corbet, T. F., Doughty, C. A., Pye, S., & Sonnenthal, E. L. (n.d.). GeoVision Analysis Supporting Task Force Report: Reservoir Maintenance and Development.
- Muir, Mark P. and Eastman, Alan D (2023). Geothermal Loop Energy Production Systems. U.S. Patent No. 11,674,504 B2. U.S. Patent and Trademark Office
- Robins, J. C., Kesseli, D., Witter, E., & Rhodes, G. (2022). 2022 GETEM Geothermal Drilling Cost Curve Update: Preprint. Renewable Energy.
- Toews, M. and Holmes, M., 2021. Eavor-lite performance update and extrapolation to commercial projects. GRC Transactions, 45, pp.86-109.
- White, M., Vasyliv, Y., Beckers, K., Martinez, M., Balestra, P., Parisi, C., Augustine, C., Bran-Anleu, G., Horne, R., Pauley, L., Bettin, G., Marshall, T., & Bernat, A. (2024). Numerical investigation of closed-loop geothermal systems in deep geothermal reservoirs. Geothermics, 116, 102852. https://doi.org/10.1016/j.geothermics.2023.102852
- Woskov, Paul and Cohn, Daniel (2013).Millimete-Wave Drilling System. U.S. Patent No. 8,939,410 B2. U.S. Patent and Trademark Office
