Difference between revisions of "Adaptive Cockpit"
| (9 intermediate revisions by 2 users not shown) | |||
| Line 13: | Line 13: | ||
= Roadmap Overview = | = Roadmap Overview = | ||
An adaptive cockpit is an advanced, AI-driven system designed to enhance aircraft safety and pilot performance during unexpected or high-stress situations. This technology integrates various sensors and intelligent algorithms to monitor both the aircraft’s status and the pilot’s physiological state in real time. | An adaptive cockpit is an advanced, AI-driven system designed to enhance aircraft safety and pilot performance during unexpected or high-stress situations. This technology integrates various sensors and intelligent algorithms to monitor both the aircraft’s status and the pilot’s physiological state in real time. | ||
| Line 31: | Line 28: | ||
[[File:AVIAIFOCUS2.png | 800px | Picture of FOCUS]] | [[File:AVIAIFOCUS2.png | 800px | Picture of FOCUS]] | ||
Over time, flight deck crews have evolved from having 5 members (Pilot, Co-pilot, Flight Engineer, Navigator, and Radio Operator) to the modern configuration of Captain and First Officer. This reduction was made possible by technological advances that automated or eliminated certain roles. With the prediction of a massive pilot shortage and the continued advancement in technology, we will explore how '''Adaptive Cockpits''' may play a role in the journey to Single Pilot Operations. | |||
[[File:Pilots.png | 600px | Flight Deck Over Time]] | |||
= Design Structure Matrix (DSM) of Roadmap Family = | = Design Structure Matrix (DSM) of Roadmap Family = | ||
| Line 64: | Line 65: | ||
! Figure of Merit !! Description !! Trends !! Units | ! Figure of Merit !! Description !! Trends !! Units | ||
|- | |- | ||
| ''' | | '''Accident Rate''' | ||
|| | || Rate of accidents normalized by passenger miles or flights | ||
|| | || decreasing | ||
|| | || | ||
<html> | <html> | ||
<math> | <math> | ||
<mfrac> | <mfrac> | ||
<mrow> <mtext> | <mrow> <mtext>accidents</mtext> </mrow> | ||
<mtext> | <mtext>passenger * mile</mtext> | ||
</mfrac> | |||
</math> | |||
</html> | |||
or | |||
<html> | |||
<math> | |||
<mfrac> | |||
<mrow> <mtext>accidents</mtext> </mrow> | |||
<mtext>flight</mtext> | |||
</mfrac> | </mfrac> | ||
</math> | </math> | ||
</html> | </html> | ||
|- | |- | ||
| ''' | | '''Pilot Efficiency''' | ||
|| | || Measure of how many passengers each pilot is capable of transporting per year | ||
|| | || increasing | ||
|| | || | ||
<html> | <html> | ||
<math> | <math> | ||
<mfrac> | <mfrac> | ||
<mrow> <mtext> | <mrow> <mtext>passengers</mtext> </mrow> | ||
<mtext> | <mtext>pilot * year</mtext> | ||
</mfrac> | </mfrac> | ||
</math> | </math> | ||
| Line 109: | Line 119: | ||
<mfrac> | <mfrac> | ||
<mrow> <mtext>maintenance hours</mtext> </mrow> | <mrow> <mtext>maintenance hours</mtext> </mrow> | ||
<mtext>passenger mile</mtext> | <mtext>passenger * mile</mtext> | ||
</mfrac> | </mfrac> | ||
</math> | </math> | ||
| Line 145: | Line 155: | ||
|- | |- | ||
|} | |} | ||
== Accident Rate == | == Accident Rate == | ||
| Line 181: | Line 173: | ||
Detailed statistics for each aircraft are in table below. | Detailed statistics for each aircraft are in table below. | ||
<!-- | |||
[[File:3AISC-accidents-by-aircraft-type.png | 800px | Accidents per Aircraft type, Worldwide Commercial Fleet]] | [[File:3AISC-accidents-by-aircraft-type.png | 800px | Accidents per Aircraft type, Worldwide Commercial Fleet]] | ||
--> | |||
{| class="wikitable" | |||
|+ Accident rates for commercial aircraft from 1959 - 2022 by type, manufacturer and generation (rates per million flights) | |||
! Aircraft <br> Sorted by Year <br> of Introduction | |||
! Manufacturer | |||
! Generation | |||
! Fatal <br> Hull Loss <br> Accident Rate | |||
! Hull Loss <br> Accident Rate | |||
|- | |||
| 727 | |||
| Boeing | |||
| Generation 2 | |||
| 0.72 | |||
| 1.22 | |||
|- | |||
| DC-9 | |||
| McDonald Douglas | |||
| Generation 2 | |||
| 0.77 | |||
| 1.45 | |||
|- | |||
| 737-100/-200 | |||
| Boeing | |||
| Generation 2 | |||
| 0.87 | |||
| 1.78 | |||
|- | |||
| F-28 | |||
| Fokker | |||
| Generation 2 | |||
| 2.2 | |||
| 4.4 | |||
|- | |||
| DC-10/MD-10 | |||
| McDonald Douglas | |||
| Generation 2 | |||
| 1.28 | |||
| 2.87 | |||
|- | |||
| A300 | |||
| Airbus | |||
| Generation 2 | |||
| 0.59 | |||
| 2.52 | |||
|- | |||
| MD-80/-90 | |||
| McDonald Douglas | |||
| Generation 3 | |||
| 0.32 | |||
| 0.76 | |||
|- | |||
| 767 | |||
| Boeing | |||
| Generation 3 | |||
| 0.14 | |||
| 0.54 | |||
|- | |||
| 757 | |||
| Boeing | |||
| Generation 3 | |||
| 0.22 | |||
| 0.29 | |||
|- | |||
| BAe 146, RJ-70/-85/-100 | |||
| British Aerospace | |||
| Generation 2 | |||
| 0.67 | |||
| 1.51 | |||
|- | |||
| A310 | |||
| Airbus | |||
| Generation 3 | |||
| 1.9 | |||
| 2.53 | |||
|- | |||
| 737-300/-400/-500 | |||
| Boeing | |||
| Generation 3 | |||
| 0.26 | |||
| 0.81 | |||
|- | |||
| A300-600 | |||
| Airbus | |||
| Generation 3 | |||
| 0.54 | |||
| 0.95 | |||
|- | |||
| A320/321/319/318 | |||
| Airbus | |||
| Generation 4 | |||
| 0.08 | |||
| 0.17 | |||
|- | |||
| F-100/F-70 | |||
| Fokker | |||
| Generation 3 | |||
| 0.43 | |||
| 1.21 | |||
|- | |||
| 747-400 | |||
| Boeing | |||
| Generation 3 | |||
| 0.55 | |||
| 1.1 | |||
|- | |||
| MD-11 | |||
| McDonald Douglas | |||
| Generation 3 | |||
| 1.61 | |||
| 3.21 | |||
|- | |||
| A340 | |||
| Airbus | |||
| Generation 4 | |||
| 0 | |||
| 0.58 | |||
|- | |||
| A330 | |||
| Airbus | |||
| Generation 4 | |||
| 0.14 | |||
| 0.42 | |||
|- | |||
| 777 | |||
| Boeing | |||
| Generation 4 | |||
| 0.13 | |||
| 0.27 | |||
|- | |||
| 737-600/-700/-800/-900 | |||
| Boeing | |||
| Generation 3 | |||
| 0.08 | |||
| 0.18 | |||
|- | |||
| EMB-170/-175/-190 | |||
| Embraer | |||
| Generation 3 | |||
| 0.04 | |||
| 0.18 | |||
|- | |||
| ERJ-135/-140/-145 | |||
| Embraer | |||
| Generation 3 | |||
| 0 | |||
| 0.33 | |||
|- | |||
| A320/321/319 NEO | |||
| Airbus | |||
| Generation 4 | |||
| 0.11 | |||
| 0.11 | |||
|- | |||
| 737 MAX | |||
| Boeing | |||
| Generation 3 | |||
| 1.48 | |||
| 1.48 | |||
|} | |||
=== Detail of Accidents per Passenger Hour (US-based General Aviation fleet) === | === Detail of Accidents per Passenger Hour (US-based General Aviation fleet) === | ||
| Line 190: | Line 341: | ||
[[File:3AISC-accidents-per-flight-hour.png | 600px | Normalized Accidents per Year, United States General Aviation Fleet]] | [[File:3AISC-accidents-per-flight-hour.png | 600px | Normalized Accidents per Year, United States General Aviation Fleet]] | ||
== Pilot Efficiency == | |||
Pilots are currently a critical part of air transportation systems and making sure they are efficiently transporting passengers is an important figure of merit (FOM) of an airline. The definition of pilot efficiency is below. | |||
::<html> | |||
<la-tex> | |||
{Efficiency}_{Pilot} = \frac{{Capacity}_{Pass} * {LF}_{Pass}}{{Pilot}_{Plane}} * {Flight}_{Year} | |||
</la-tex> | |||
</html> | |||
<!-- | |||
[[File:3AISC-pilot-efficiency-calculation.png | 800px | Pilot Efficiency Equation]] | |||
--> | |||
[[File:3AISC-pilot-efficiency-detail.png | 800px | Pilot Efficiency Variable Detail]] | |||
[[File:3AISC-pilot-efficiency-sensitivities.png | 800px | Pilot Efficiency Tornado Chart]] | |||
== Biometric Activity Accuracy == | == Biometric Activity Accuracy == | ||
| Line 259: | Line 428: | ||
The chart below summarizes some key metrics for the major players in aircraft manufacturing. There is a clear difference in market share, with Boeing and Airbus demonstrating a duopoly over commercial aviation. Embraer and Bombardier have focused their efforts on commercial aviation's regional and business segments. | The chart below summarizes some key metrics for the major players in aircraft manufacturing. There is a clear difference in market share, with Boeing and Airbus demonstrating a duopoly over commercial aviation. Embraer and Bombardier have focused their efforts on commercial aviation's regional and business segments. | ||
<!-- | |||
[[File:AVIAICOMP.png | 800px | Summary of Major Aircraft Manufacturers]] | [[File:AVIAICOMP.png | 800px | Summary of Major Aircraft Manufacturers]] | ||
--> | |||
{| class="wikitable" | |||
|+ Summary of Aircraft Manufacturers | |||
! Manufacturer | |||
! Number of Aircraft in Service | |||
! Number of Models | |||
! Primary Segment | |||
! Range of Crew Sizes | |||
! Number of Single Pilot Aircraft | |||
|- | |||
| Embraer | |||
| 1,800 | |||
| 6 | |||
| Regional / Short Haul | |||
| 2 | |||
| 1 (Pheonom 300E, Part 23) | |||
|- | |||
| Airbus | |||
| 13,890 | |||
| 8 | |||
| Commercial Wide / Narrow Body | |||
| 2-3 | |||
| 0 | |||
|- | |||
| Boeing | |||
| 11,000 | |||
| 10 | |||
| Commercial Wide / Narrow Body | |||
| 2-3 | |||
| 0 | |||
|- | |||
| Bombardier | |||
| 5,000 | |||
| 4 | |||
| Business | |||
| 2 | |||
| 0 | |||
|} | |||
| Line 434: | Line 641: | ||
The aviation industry faces a significant challenge as the demand for pilots continues to outpace the available supply. By 2029, a global shortage of 50,000 pilots is anticipated, necessitating alternative solutions to address this growing gap. One promising approach to mitigate this shortage is to reduce the number of pilots required to operate aircraft. This strategy involves a phased implementation, starting with reduced crew operations, progressing to single-pilot operations for cargo aircraft (which pose no risk to passengers), and eventually extending to commercial aircraft. | The aviation industry faces a significant challenge as the demand for pilots continues to outpace the available supply. By 2029, a global shortage of 50,000 pilots is anticipated, necessitating alternative solutions to address this growing gap. One promising approach to mitigate this shortage is to reduce the number of pilots required to operate aircraft. This strategy involves a phased implementation, starting with reduced crew operations, progressing to single-pilot operations for cargo aircraft (which pose no risk to passengers), and eventually extending to commercial aircraft. | ||
To achieve this goal, a comprehensive plan for research and development is proposed, focusing initially on improving component-level systems and enhancing accuracy-related figures of merit. These foundational projects are slated for completion by 2025. Following this, the development of an adaptive cockpit will progress through stages of modeling, human factors analysis, design, and prototyping. A fully functional prototype is expected to be ready by 2030, with pilot training commencing immediately thereafter. The ultimate objective of this roadmap is to have single-pilot capable aircraft available for sale to freight companies by 2032, marking a significant milestone in aviation technology and addressing the critical pilot shortage. | To achieve this goal, a comprehensive plan for research and development is proposed, focusing initially on improving component-level systems and enhancing accuracy-related figures of merit. These foundational projects are slated for completion by 2025. Following this, the development of an adaptive cockpit will progress through stages of modeling, human factors analysis, design, and prototyping. A fully functional prototype is expected to be ready by 2030, with pilot training commencing immediately thereafter. The ultimate objective of this roadmap is to have single-pilot capable aircraft available for sale to freight companies by 2032, marking a significant milestone in aviation technology and addressing the critical pilot shortage. Of course, all of these developments are dependent on this technology being equal to, or safer than, the existing architecture. | ||
[[File: | [[File:Swoosh2.png | 800px | Swoosh Chart]] | ||
Latest revision as of 18:34, 5 December 2024
Adaptive cockpit is a level 3 roadmap (3ADC) created by Dave Bertucci and Tyler Carey with the support and mentorship of industry partners.
(NOTE: This roadmap is the sole work of Dave Bertucci and Tyler Carey and does not represent the official position or plan of MIT or any industry partner.)
Roadmap Overview
An adaptive cockpit is an advanced, AI-driven system designed to enhance aircraft safety and pilot performance during unexpected or high-stress situations. This technology integrates various sensors and intelligent algorithms to monitor both the aircraft’s status and the pilot’s physiological state in real time. Key features of an adaptive cockpit include:
- Continuous monitoring of aircraft systems and flight parameters
- Real-time analysis of pilot biometrics and behavior
- Detection of sudden, potentially disorienting events or anomalies
- Intelligent assessment of the pilot’s cognitive and emotional state
- Provision of timely, context-aware assistance and guidance
When the system detects signs of pilot stress, confusion, or delayed responses, it intervenes with appropriate support. This may include a simplified display of critical information, biofeedback to reduce stress, or automated assistance with certain tasks. The adaptive cockpit aims to mitigate the impact of human factors such as the startle effect and cognitive overload. By providing tailored, real-time support, pilots can more quickly regain situational awareness and make informed decisions during critical moments. This technology represents a significant advancement in aviation safety, offering a proactive approach to managing complex scenarios and reducing operational risks. As it continues to evolve, the adaptive cockpit has the potential to revolutionize cockpit design and pilot training, ultimately leading to safer and more efficient flight operations.
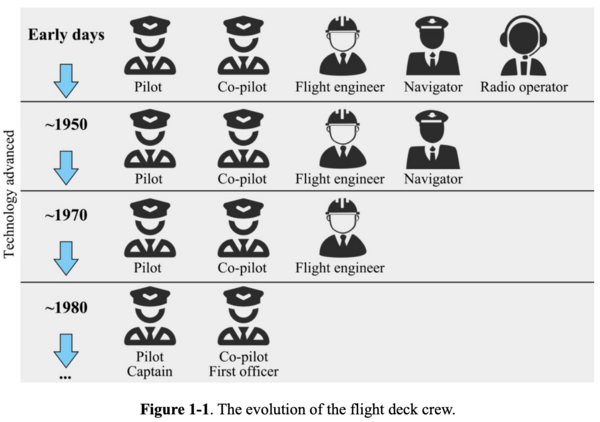
Over time, flight deck crews have evolved from having 5 members (Pilot, Co-pilot, Flight Engineer, Navigator, and Radio Operator) to the modern configuration of Captain and First Officer. This reduction was made possible by technological advances that automated or eliminated certain roles. With the prediction of a massive pilot shortage and the continued advancement in technology, we will explore how Adaptive Cockpits may play a role in the journey to Single Pilot Operations.
Design Structure Matrix (DSM) of Roadmap Family
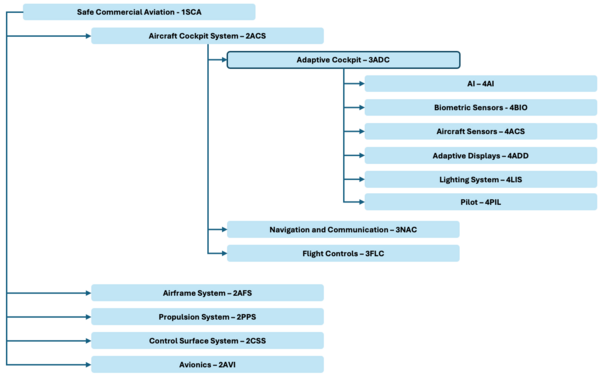
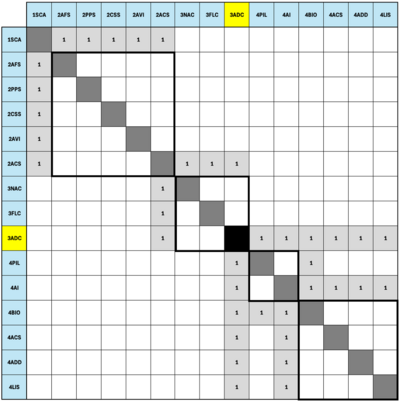
Our technology roadmap focuses on an Adaptive Cockpit (3ADC) at the subsystem level (level 3). Components of the adaptive cockpit are AI for interpreting and modeling data to determine aircraft and pilot status (4AI), Biometric Sensors for measuring pilot status indicators (4BIO), aircraft sensors for detecting aircraft status (4ACS), adaptive displays that can highlight critical information for a pilot (4ADD), a lighting system that assists pilots in maintaining respiratory rates and creating a calming atmosphere (4LIS), and the pilot responsible for flying the aircraft (4PIL). Other subsystems in the cockpit include navigation and communication systems (3NAC), and flight controls (3FLC). We have also listed other level 2 products that support our level 1 market of safe commercial aviation (1SCA).
Object Process Diagram (OPD) of Roadmap Technology
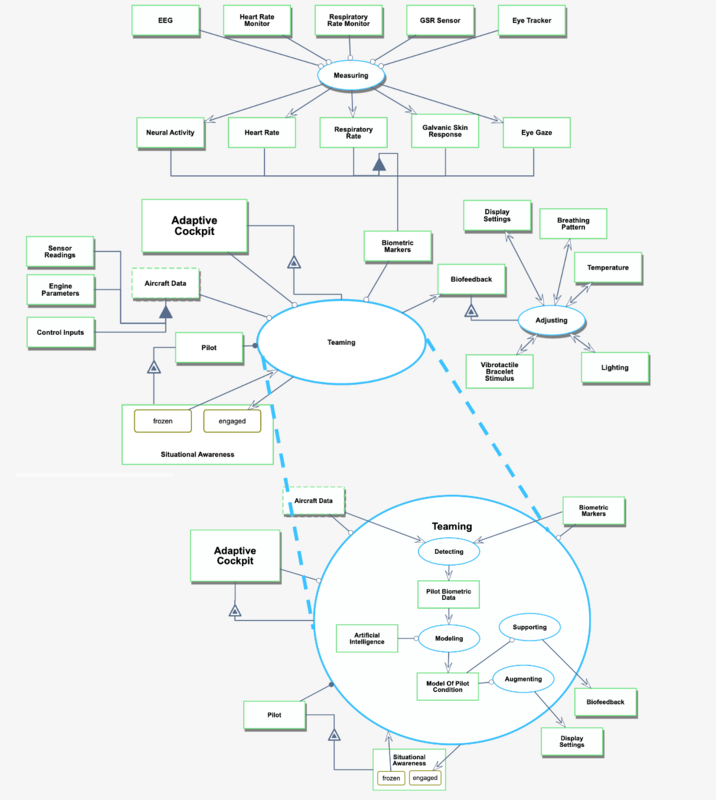
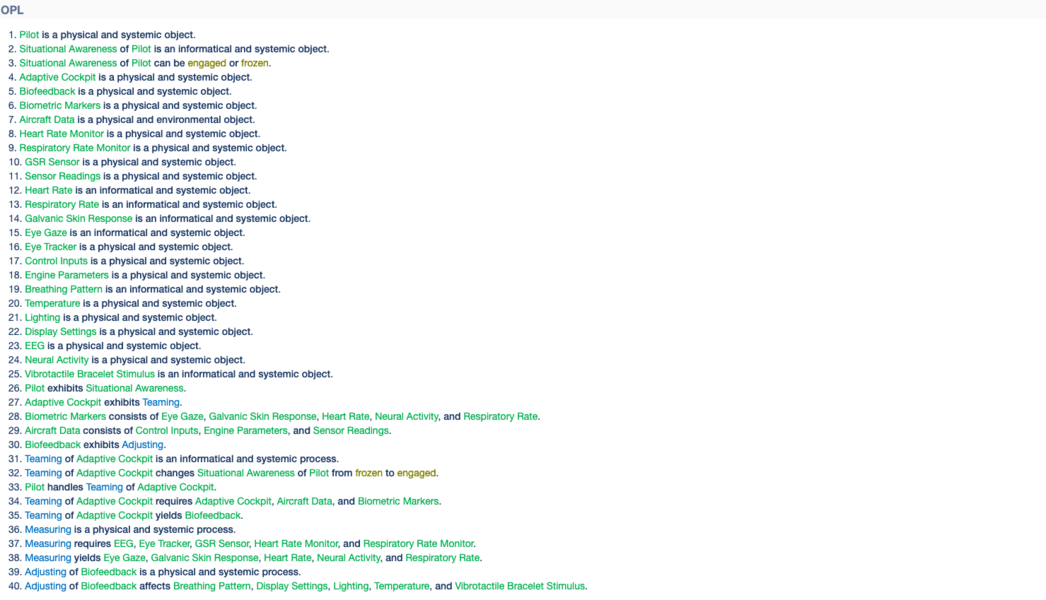
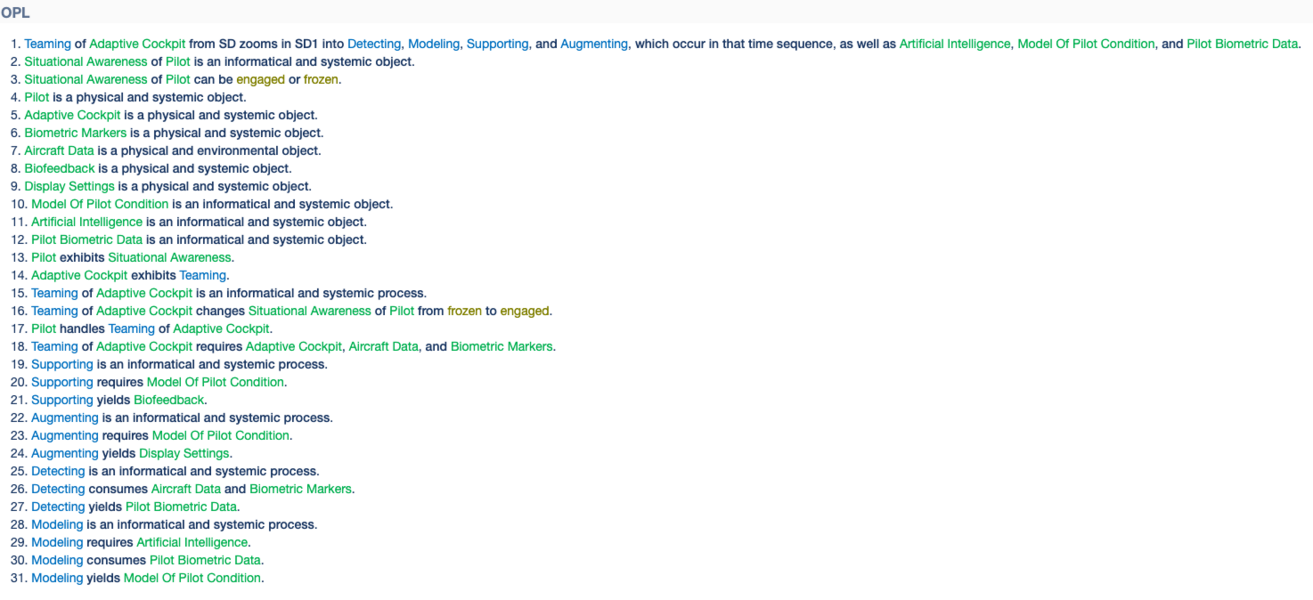
In the figure below, we provide an Object-Process-Diagram (OPD) of the 3ADC roadmap. This diagram captures the main object of the roadmap (Adaptive Cockpit), its main process (Teaming), the various tools required, the sub-processes required for Teaming, and the change in the status of the pilot as a result of Teaming. Additionally, we have included a zoomed-in look into the Temaing process and its four sub-processes (Detecting, Modeling, Supporting, and Augmenting).
The Object Process Language (OPL) below is the auto-generated grammatical version of the OPD above. The first OPL is for the Level 1 OPD, whereas the second OPL is for the decomposition of Teaming into its four sub-processes.
Figures of Merit (FOMs) of Technology
Many figures of merit (FOMs) were considered for this roadmap and are outlined below with more information and current trends on each. The first 3 were found to be especially important for the roadmap and are shown below in bold.
| Figure of Merit | Description | Trends | Units |
|---|---|---|---|
| Accident Rate | Rate of accidents normalized by passenger miles or flights | decreasing |
or |
| Pilot Efficiency | Measure of how many passengers each pilot is capable of transporting per year | increasing |
|
| Biometric Activity Accuracy |
Accuracy of best models of pilot pilot metrics to predict attention and startle response |
increasing |
|
| System Maintainability | How much time is spend maintaining aircraft systems, measured by comparing maintenance time per flight time | decreasing |
|
| Response Time | Time required to identify and mitigate safety issues | flat |
|
| System Uptime | Amount of time aircraft is available to be dispatched on a mission as a percentage of wall time | increasing |
|
| Cognitive Load on Crew | As measured by industry standard NASA TLX score | flat |
|
Accident Rate
Detail of Accident Rates (per million flight cycle), 1959 to 2022
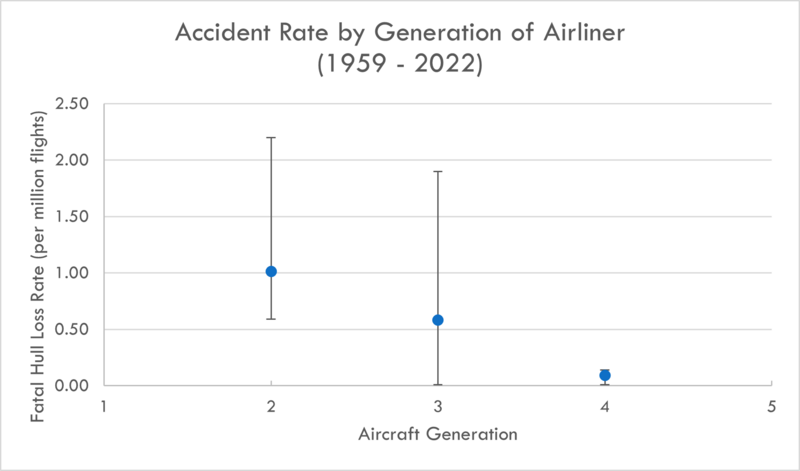
Large commercial aircraft have steadily been getting safer. The table below shows accident rates of aircraft organized by the date of their first flights (oldest first). This chart highlights that newer designs have proven to be safer than older designs. Additionally the chart categorizes aircraft by the generation of automation used in each.
- Generation 1 (Not shown)
- Analog gauges and early auto-pilot systems
- Generation 2
- Integration of auto-pilot and auto-throttle systems
- Generation 3
- Glass cockpits, improved navigation systems, and terrain avoidance systems
- Generation 4
- Fly-by-wire and envelope protection systems
As these successive generations of technology have been integrated into aircraft the accident rates have dropped dramatically. Since safety record is a property of the system as a whole and the complexity of an aircraft is so high, generating an analytical model of the contributing factors is very complex, but by comparison to existing vehicles and considering the relative frequency of specific classes of accidents, it is possible to understand what technologies will be able to impact these metrics in the future.
Detailed statistics for each aircraft are in table below.
| Aircraft Sorted by Year of Introduction |
Manufacturer | Generation | Fatal Hull Loss Accident Rate |
Hull Loss Accident Rate |
|---|---|---|---|---|
| 727 | Boeing | Generation 2 | 0.72 | 1.22 |
| DC-9 | McDonald Douglas | Generation 2 | 0.77 | 1.45 |
| 737-100/-200 | Boeing | Generation 2 | 0.87 | 1.78 |
| F-28 | Fokker | Generation 2 | 2.2 | 4.4 |
| DC-10/MD-10 | McDonald Douglas | Generation 2 | 1.28 | 2.87 |
| A300 | Airbus | Generation 2 | 0.59 | 2.52 |
| MD-80/-90 | McDonald Douglas | Generation 3 | 0.32 | 0.76 |
| 767 | Boeing | Generation 3 | 0.14 | 0.54 |
| 757 | Boeing | Generation 3 | 0.22 | 0.29 |
| BAe 146, RJ-70/-85/-100 | British Aerospace | Generation 2 | 0.67 | 1.51 |
| A310 | Airbus | Generation 3 | 1.9 | 2.53 |
| 737-300/-400/-500 | Boeing | Generation 3 | 0.26 | 0.81 |
| A300-600 | Airbus | Generation 3 | 0.54 | 0.95 |
| A320/321/319/318 | Airbus | Generation 4 | 0.08 | 0.17 |
| F-100/F-70 | Fokker | Generation 3 | 0.43 | 1.21 |
| 747-400 | Boeing | Generation 3 | 0.55 | 1.1 |
| MD-11 | McDonald Douglas | Generation 3 | 1.61 | 3.21 |
| A340 | Airbus | Generation 4 | 0 | 0.58 |
| A330 | Airbus | Generation 4 | 0.14 | 0.42 |
| 777 | Boeing | Generation 4 | 0.13 | 0.27 |
| 737-600/-700/-800/-900 | Boeing | Generation 3 | 0.08 | 0.18 |
| EMB-170/-175/-190 | Embraer | Generation 3 | 0.04 | 0.18 |
| ERJ-135/-140/-145 | Embraer | Generation 3 | 0 | 0.33 |
| A320/321/319 NEO | Airbus | Generation 4 | 0.11 | 0.11 |
| 737 MAX | Boeing | Generation 3 | 1.48 | 1.48 |
Detail of Accidents per Passenger Hour (US-based General Aviation fleet)
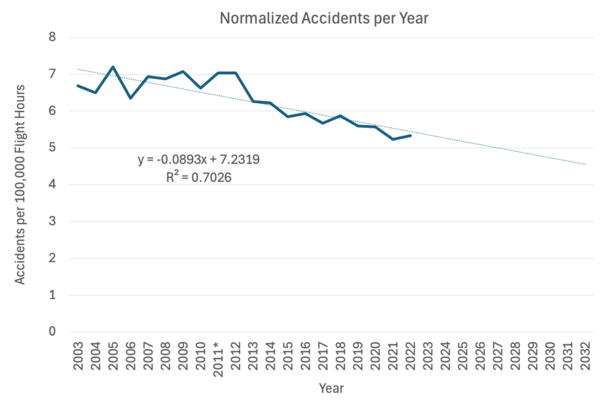
The general aviation (GA) fleet has steadily gotten safer over the last 20 years and we predict this trend will continue. This fleet is where most aviation accidents occur, due to older aircraft and less trained pilots than then more professional commercial fleet. Because of these features of the GA fleet, it has lots of room to improve with cockpit improvements and attention aids for pilots.
Pilot Efficiency
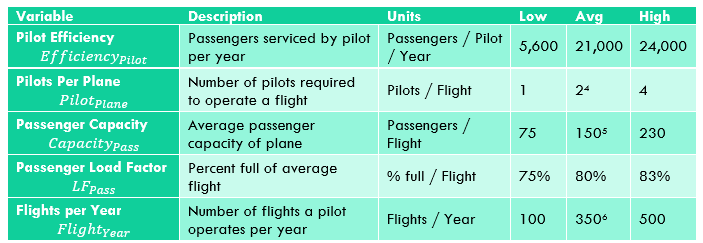
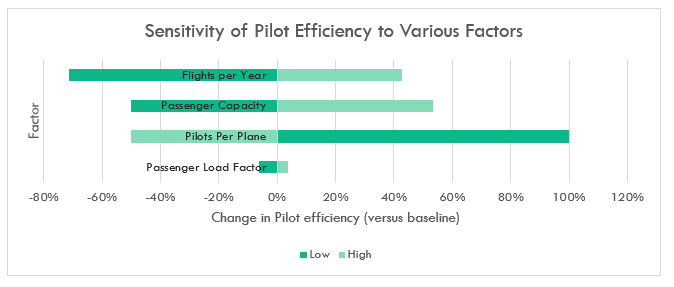
Pilots are currently a critical part of air transportation systems and making sure they are efficiently transporting passengers is an important figure of merit (FOM) of an airline. The definition of pilot efficiency is below.
-
{Efficiency}_{Pilot} = \frac{{Capacity}_{Pass} * {LF}_{Pass}}{{Pilot}_{Plane}} * {Flight}_{Year}
-
Biometric Activity Accuracy
Biometric Activity Accuracy is a measure of the performance of the system. In this case, biometric activity is used to determine if the pilot becomes startled or suffers from a lack of attention to the activity of flying or other critical actives of controlling the aircraft. The classifier is a binary classifier that either reports normal (attentive) or abnormal (startled or inattentive). This is calculated with the equation below.
Accuracy in general when applied to a binary classifier of this type is reported as a ratio of correct classifications to all classifications. This is calculated as the sum of true positives (TP) and true negatives (TN) to the total number of classifications, which is the sum of all responses to the classifier, true positive (TP), true negative (TN), false positive (FP) and false negative (FN).
Alignment with Company Strategic Drivers
| ID | Strategic Driver | Alignment Targets |
|---|---|---|
| 1 |
Reduce perceived stress/workload after adverse events in cockpit. |
This roadmap aims to develop a technology that will accurately measure pilot physiological parameters, model the status of pilot and aircraft, and augment the pilot's environment to reduce stress after adverse events. This strategic driver is strongly aligned with our roadmap. Target: Reduction in pilot stress by 35% in single pilot operations as measured by standard physiological markers (such as HR and HRV). |
| 2 |
Improve detection of stress and workload from real time physiological sensing. |
This roadmap requires accurate assessment of pilot state to allow for useful intervention to improve performance. Both false positives (nuisince interventions) and false negatives (missed interventions) will erode trust in the system and reduce its effectiveness. Target: Detect stress response and increased workload with 90% accuracy with less than 5% false positive rate. |
| 3 |
Provide framework that reduces the number of pilots required for flight to meet projected demand of commercial aviation. “Demand for pilots is likely to soar. Projections indicate that, over the next 20 years, 602,000 new pilots will be needed to meet demand from commercial operators.” – Boeing Pilot and Technician Outlook 2022-2041 |
This roadmap focuses on developing technology that identifies and adjusts pilot operation conditions to reduce perceived workload after adverse events. If this technology is successful, it will help to create a case for safe single pilot operations. Single pilot operations are not the primary purpose of the technology but is a possible outcome that assists in demand drivers. Therefore, this strategic driver is aligned with our technology roadmap, but isn’t the primary focus of our roadmap. Target: Reduction in pilot workload by 50% during critical flight phases as measured by standard workload metrics (such as NASA TLX score). |
Positioning of Company vs. Competition
The chart below summarizes some key metrics for the major players in aircraft manufacturing. There is a clear difference in market share, with Boeing and Airbus demonstrating a duopoly over commercial aviation. Embraer and Bombardier have focused their efforts on commercial aviation's regional and business segments.
| Manufacturer | Number of Aircraft in Service | Number of Models | Primary Segment | Range of Crew Sizes | Number of Single Pilot Aircraft |
|---|---|---|---|---|---|
| Embraer | 1,800 | 6 | Regional / Short Haul | 2 | 1 (Pheonom 300E, Part 23) |
| Airbus | 13,890 | 8 | Commercial Wide / Narrow Body | 2-3 | 0 |
| Boeing | 11,000 | 10 | Commercial Wide / Narrow Body | 2-3 | 0 |
| Bombardier | 5,000 | 4 | Business | 2 | 0 |
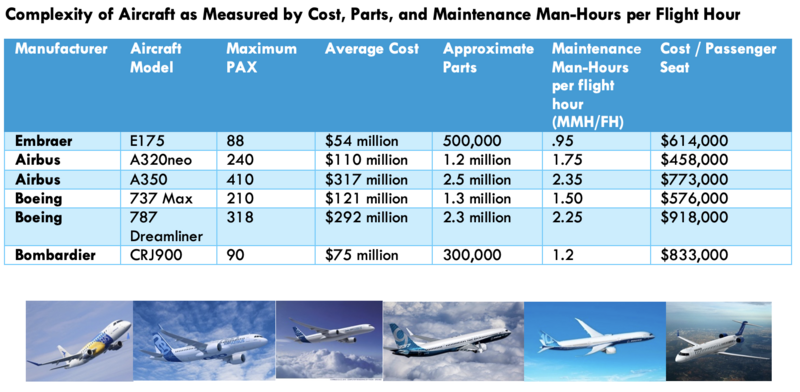
Aircraft are incredibly complex systems that impart a tremendous demand on pilots. We will look at some characteristics and traits of various aircraft and use them as a proxy for complexity. The chart below highlights the various levels of complexity in commercial aviation across segments and manufacturers.
The chart below shows that Airbus is the only major manufacturer that shows public-facing activity in RDO / SPO R&D. There is an opportunity for companies to differentiate their architectures and provide a solution that will assist the industry in generating safer aircraft and eventually meet pilot demands in the future by providing single-pilot aircraft.
Technical Model
The development of an adaptive cockpit involves several key design considerations, particularly regarding bio-feedback devices. These devices play a crucial role in monitoring pilot physiological states, but their implementation requires careful balancing of accuracy and practicality.
Key Issues
- Accuracy vs. Practicality: More accurate bio-feedback devices often come at the cost of being more cumbersome and potentially distracting for pilots.
- Cognitive Load: Highly accurate devices may inadvertently create unnecessary cognitive burden, which could counteract their intended benefits.
- Obtrusiveness: The most accurate devices are designed for a lab environment so likely would be too intrusive for use in real time while operating an aircraft.
- R&D Focus: Future research and development efforts should prioritize creating bio-feedback devices that maintain high accuracy while minimizing invasiveness and pilot discomfort.
| Categories | Decision Variables | 1 | 2 | 3 | Status |
|---|---|---|---|---|---|
| Sensors | Heart Rate / Heart Rate Variability (HR/HRV) | Single-Lead Electrocardiogram (ECG) | Chest Strap | PPG | Promising |
| Electroencephalogram (EEG) |
High Density Array (>64 channel) |
Conventional Array (~32 channel) |
Consumer Array (~4 channel) |
Promising, but Obtrusive | |
| Galvanic Skin Response (GSR) | Electrodes | Wearables (wrist or watch) |
Needs more study | ||
| Eye Tracking | Point Cloud | Head Mounted | Promising, but Obtrusive | ||
| Respiratory Rate | Spirometer | Chest Strap | Resistive Sensors | Promising | |
| Blood Oxygen (VO2) | Pulse Oximeter | Arterial Blood Gas Test | Needs more study | ||
| Compute | Algorithm Type | Random Forest | Support Vector Machines | Deep Neural Networks (DNNs) | |
| Output Target | Level of Automation (LoA) | Minimal | Management by Consent | Management by Exception |
Financial Model
Based on a reduction of accidents by 75% of the Embraer commercial fleet of 11% of the total, mean accident cost to industry of $170M, and discount rate of 12% the financial model of the value of this project is below. Additionally the project has an assumption of a rollout of the system to the global fleet over 7 years.
- Embraer commands 11% of the commercial fleet worldwide
- Improving pilot cognition can reduce accident rate by 60%
- 80% accidents from pilot error today
- Reduction of 75% of this class of accident
- The mean cost for a catastrophic accident to industry is $170M
- Discount rate of 12%
- R&D spend is allocated over the schedule in the R&D Projects section
- Retrofit into the fleet is over 7 years after conclusion of R&D effort
As shown below this shows the Net Present Value of the effort at ~$133M.
List of R&D Projects
The R&D project timeline has been developed based on limited information about competitors’ progress in Single Pilot and Reduced Crew Operations. Airbus’ Project Morgan and Project DISCO, which aim to implement single pilot operations in Fedex freight aircraft by 2030, provide the only publicly available insights. To maintain competitiveness with major manufacturers like Airbus, Embraer targets R&D completion by 2032, with the subsequent availability of aircraft and training for customers. The R&D trajectory begins by enhancing component-level technologies that best indicate pilot status, then advances to developing precise modeling algorithms and automation. The final phase of R&D projects focuses on human factors research, design, prototyping, and training development. This strategic approach ensures Embraer remains at the forefront of aviation technology while addressing the complex challenges of reduced crew operations.
Key Publications and Patents
Publications
Masi, G.; Amprimo, G.; Ferraris, C.; Priano, L. Stress and Workload Assessment in Aviation—A Narrative Review. Sensors 2023, 23, 3556. https://doi.org/10.3390/s23073556
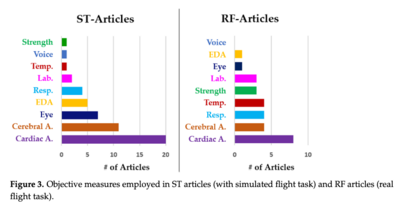
This paper reviews various workload and stress assessment tools used within the military and civilian aviation sector. Stress and workload are key indicators of pilot performance, but measuring these conditions is not straightforward. Some of the highlighted indicators used for determining stress and workload are neurophysical (heart rate (HR) and heart rate variability (HRV)), respiratory rate, electrodermal activity (EDA), body temperature, eye movements and dilation, etc. Subjective measures such as the NASA-TLX can also be used to determine workload. One of the major conclusions was that there is no positive indicator for stress and workload in pilots. All the indicators mentioned above are only potential indicators for stress, so a comprehensive approach must be taken to model the status of the pilot. Most of the studies reviewed in this analysis used a combination of assessments to deduce stress and workload. The most common neurophysical used in the studies was HR and HRV. The authors comment on the feasibility of taking these measurements during flight, recommending that the devices should be light and not encumber the pilot's ability to function by using single-lead wearables or smart devices.
The authors suggest that more research should be done on eye tracking, near-infrared spectroscopy, grip strength during flight, and other parameters. Lastly, the author recommends further research into adaptive cockpits.
This review is an excellent source of background science regarding safety in aviation as it relates to pilot performance. The review's conclusion suggests that a combination of assessments is required, that there is still work to do to establish a reliable model for pilot stress and workload, and that adaptive cockpits would be the potential practical application of these findings.
Li, Qinbiao & Chen, Chun-Hsien & Ng, Kam K.H. & Yuan, Xin & Yiu, Cho Yin. (2024). Single-pilot operations in commercial flight: Effects on neural activity and visual behaviour under abnormalities and emergencies. Chinese Journal of Aeronautics. 37. 10.1016/j.cja.2024.04.007.
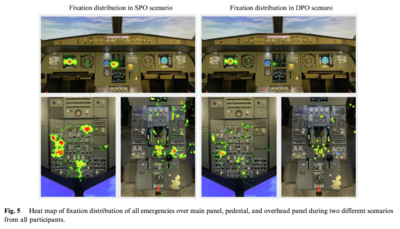
This study explores the feasibility and safety of single-pilot operations (SPO) in commercial aviation. Using a flight simulator, 20 licensed pilots were tested in dual-pilot (DPO) and SPO scenarios. Findings reveal that neural activity, particularly in the frontal, parietal, and temporal brain regions, increased significantly during complex emergencies in SPO, indicating higher cognitive demands. Eye-tracking data showed that pilots in SPO focused less on the primary flight display (PFD) and more on secondary displays, reflecting dispersed attention and increased workload. Pilots made more operational errors in SPO, especially during complex scenarios like dual-engine failures and single-engine fires. Subjective feedback highlighted that pilots perceived SPO as having higher workload, reduced performance, and greater safety risks compared to DPO. The study identified specific physiological patterns, such as heightened cortical activity and altered visual scanning behaviors, which correlated with operational errors in SPO. To mitigate these risks, the study recommends integrating ground-based support systems and SPO-oriented intelligent flight systems to provide real-time assistance and maintain situational awareness. Additionally, improved cockpit design, such as head-up displays (HUD), is suggested to streamline information and reduce workload. Technological advancements, regulatory changes, and tailored training for single-pilot scenarios are critical to addressing these challenges. While SPO shows potential, its safe implementation depends on overcoming significant human performance and safety concerns.
This thesis directly supports the need for the technology we are roadmapping. The author provides the context surrounding the shift to SPO, and the risks associated with this transition.
Patents
Eye Gaze Tracking – US Patent No. US11899837B2 – CPC G06F
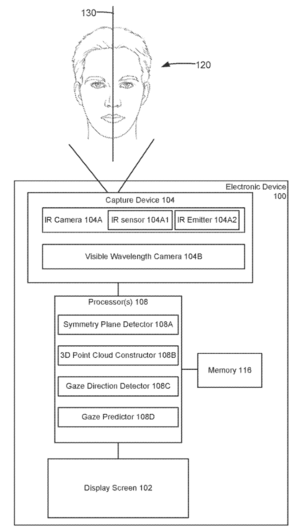
The Eye Gaze patent shows a new way to detect and track eye gaze. The primary components of the patent are a visible wavelength camera, an infrared camera, and processors. It works by using the IR cameras to develop a 3D point cloud of a person’s face. It also creates a 2D image of the face with the visible wavelength camera. The processors take this data and create symmetry planes, which can be used to determine where the person is looking.
This technology is relevant because the publication review suggested that eye-tracking is a great indicator of pilot status. However, wearing devices that obstruct vision or could bounce around during flight is not ideal. This technology addresses both of those concerns.
Smart Ring System for Monitoring Sleep Patterns And Using Machine Learning Techniques To Predict High-Risk Driving Behavior – US Patent No. US12077193B1– CPC B60W
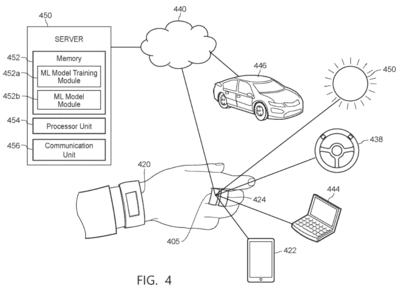
The patent above is for a smart ring that monitors sleep patterns in users and predicts high-risk behaviors through machine learning. The device is a ring, similar to an Oura ring, that tracks HR/HRV, body temperature, motion, etc. This data can be used in conjunction with vehicle data to predict high-risk behavior.
While this patent is centered around sleep and performance of an automobile driver, the general concept can be applied in other domains. It shows that small, non-obstructive devices can be used to collect data, transmit data, and inform models that could improve people's performance in control of transportation systems.
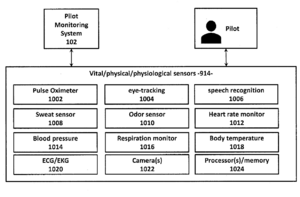
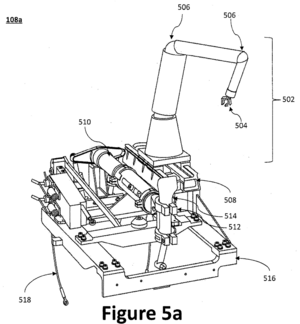
Systems And Methods for Monitoring Pilot Health – US Patent No. US20190090800A1– CPC A61B
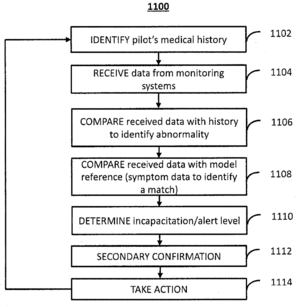
This patent outlines a system for monitoring the health of a pilot and status of the aircraft. It also contains a way to analyze the pilot status and interface with them. Lastly, this patent also includes an actuator to take control of the aircraft if necessary.
This patent is incredibly relevant as it is nearly identical to our technology with a few exceptions. The main difference is our technology aims to provide biofeedback to get the pilot back into normal operating conditions. In contrast, this patent utilizes a robot-pilot to manually control the aircraft in an emergency. The process up until that point is nearly identical.
Related Projects
Technology Strategy Statement
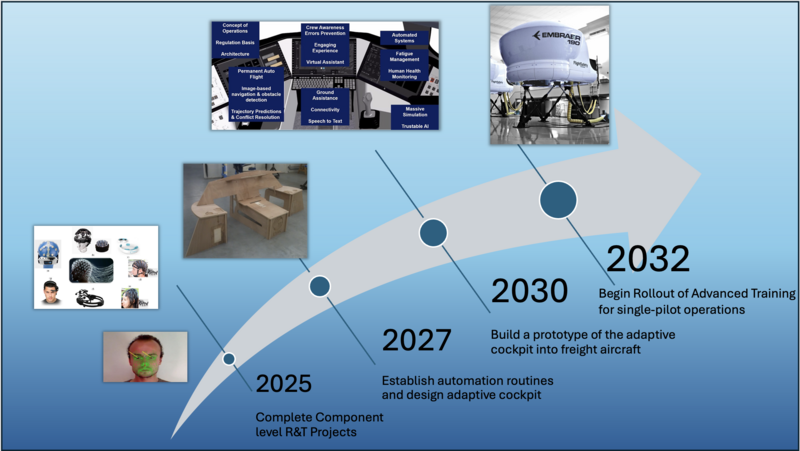
The aviation industry faces a significant challenge as the demand for pilots continues to outpace the available supply. By 2029, a global shortage of 50,000 pilots is anticipated, necessitating alternative solutions to address this growing gap. One promising approach to mitigate this shortage is to reduce the number of pilots required to operate aircraft. This strategy involves a phased implementation, starting with reduced crew operations, progressing to single-pilot operations for cargo aircraft (which pose no risk to passengers), and eventually extending to commercial aircraft. To achieve this goal, a comprehensive plan for research and development is proposed, focusing initially on improving component-level systems and enhancing accuracy-related figures of merit. These foundational projects are slated for completion by 2025. Following this, the development of an adaptive cockpit will progress through stages of modeling, human factors analysis, design, and prototyping. A fully functional prototype is expected to be ready by 2030, with pilot training commencing immediately thereafter. The ultimate objective of this roadmap is to have single-pilot capable aircraft available for sale to freight companies by 2032, marking a significant milestone in aviation technology and addressing the critical pilot shortage. Of course, all of these developments are dependent on this technology being equal to, or safer than, the existing architecture.

