Difference between revisions of "Online Reverse Procurement Marketplaces and Auctions"
| (54 intermediate revisions by 3 users not shown) | |||
| Line 1: | Line 1: | ||
=Technology Roadmap Sections and Deliverables= | =Technology Roadmap Sections and Deliverables= | ||
==Roadmap Overview== | ==Roadmap Overview== | ||
[[File:1397582659-where-ecommerce-booming-hint-think-outside-us-infographic.jpg|900px|center|eCommerce Global Map - Source Listed in Bottom of Image]] | |||
''' 3RPM - Reverse Procurement Markets ''' | |||
''' 3RPM - Reverse | |||
This Roadmap focuses on online reverse procurement marketplaces and auctions (referred to alternatively either as RPMs for markets or RPAs for auctions), which are online marketplaces and auctions where service providers bid on different service requests from people and companies in need of contract work. Examples include Upwork, Mechanical Turk, and other industry specific markets and auctions. While no reverse procurement auction or marketplace exists at scale, many product marketplace do, including Amazon and eBay. Accordingly, we have considered both product and service e-commerce marketplaces for the purpose of developing this roadmap. | This Roadmap focuses on online reverse procurement marketplaces and auctions (referred to alternatively either as RPMs for markets or RPAs for auctions), which are online marketplaces and auctions where service providers bid on different service requests from people and companies in need of contract work. Examples include Upwork, Mechanical Turk, and other industry specific markets and auctions. While no reverse procurement auction or marketplace exists at scale, many product marketplace do, including Amazon and eBay. Accordingly, we have considered both product and service e-commerce marketplaces for the purpose of developing this roadmap. | ||
The emphasized figure of merit below is user base, measured as either active buyers (of products) or service providers (for services). We have chosen to segment by several major e-commerce platforms of both services and products, which generally show the relative scope and growth of each sector. The below chart is a dual axis chart, showing the impact of major developments in e-commerce technology through the grey line and user bases over time through the separately plotted dots. <br> | The emphasized figure of merit below is user base, measured as either active buyers (of products) or service providers (for services). We have chosen to segment by several major e-commerce platforms of both services and products, which generally show the relative scope and growth of each sector. The below chart is a dual axis chart, showing the impact of major developments in e-commerce technology through the grey line and user bases over time through the separately plotted dots. The grey line shows diminishing returns from e-commerce sector, which is slowing its rate of penetration. The second axis shows that while product markets have grown steadily in scale, service markets remain small and fragmented even 20+ years into the e-commerce cycle. <br> | ||
'''Figure of Merit: | '''Figure of Merit: Micro-FOM Innovations (All Three Micro FOMs) to e-Commerce Growth Over Time - Declining Impact as Market Matures<br> | ||
'''Two Axis Chart - Grey Line (Impact of E-Commerce Innovations Over Time), Second Axis - Various e-Commerce Site Populations Over Time'''<br> | '''Two Axis Chart - Grey Line (Impact of E-Commerce Innovations Over Time), Second Axis - Various e-Commerce Site Populations Over Time'''<br> | ||
''''''Theoretical Limit: World Population'''<br> | ''''''Theoretical Limit: World Population'''<br> | ||
(all transactions for goods/services are online) | (all transactions for goods/services are online) | ||
[[File:XLP Roadmap.png | | [[File:XLP Roadmap.png |900px]] | ||
Below, the object process model (OPM), serves as high level schematic explaining the function and form of reverse procurement auctions and marketplaces. | |||
==Design Structure Matrix (DSM) Allocation== | ==Design Structure Matrix (DSM) Allocation== | ||
The design structure matrix is a matrix three levels deep in the e-commerce segment. It lies below e-commerce (level 1) and e-commerce services (level 2). Level 0 would be general commerce of products and service (both online and offline). Level 3 (RPAs or RPMs) are below other e-commerce services such as message boards (like Craigslist) which advertise service providers and those in need, but do not execute the transactions through the marketplace or auction. Execution of the transaction distinguishes RPAs/RPMs from message boards and other mechanisms for simply connecting sides of the market. | The design structure matrix is a matrix three levels deep in the e-commerce segment. It lies below e-commerce (level 1) and e-commerce services (level 2). Level 0 would be general commerce of products and service (both online and offline). Level 3 (RPAs or RPMs) are below other e-commerce services such as message boards (like Craigslist) which advertise service providers and those in need, but do not execute the transactions through the marketplace or auction. Execution of the transaction distinguishes RPAs/RPMs from message boards and other mechanisms for simply connecting sides of the market. | ||
[[File:XLP DSM.png | | [[File:XLP DSM.png | 900px]] | ||
==Roadmap Model using OPM== | ==Roadmap Model using OPM== | ||
[[File:OPD- Online Reverse Procurement Auction.png| | [[File:OPD- Online Reverse Procurement Auction.png|1100px]] | ||
The '''final output of the system''' is measured by job contracts over a period of time: '''Work(out) = Jobs Contracted / Hour''' <br> | The '''final output of the system''' is measured by job contracts over a period of time: '''Work(out) = Jobs Contracted / Hour''' <br> | ||
| Line 44: | Line 44: | ||
==Figures of Merit== | ==Figures of Merit== | ||
After extensive analysis and experimentation, we divided figures of merit into '''macro-level''' and '''micro-level''' figures of merit. Macro-level figures of merit are top level items that generally describe the health of a marketplace but are not useful, other than to imply brute force techniques, in establishing smaller efforts to increase the marketplace growth and retention rates. This is a major insight from this course and project - that many well funded marketplaces simply attempt to impact retention and total market size through brute force efforts (typically by subsidizing one or both sides of the market). Lyft and Uber do not have scalable economic models (they lose money every quarter) because they simply attempt to force growth and retention by losing money. Through the frameworks in this class, we developed three categories of micro-level FOMs. These micro-level figures of merit include smaller levers that can be used to influence the marketplace and feed into the final macro-level evaluation. <br> | After extensive analysis and experimentation, we divided figures of merit into '''macro-level''' and '''micro-level''' figures of merit. Macro-level figures of merit are top-level items that generally describe the health of a marketplace but are not useful, other than to imply brute force techniques, in establishing smaller efforts to increase the marketplace growth and retention rates. This is a major insight from this course and project - that many well-funded marketplaces simply attempt to impact retention and total market size through brute force efforts (typically by subsidizing one or both sides of the market). Lyft and Uber do not have scalable economic models (they lose money every quarter) because they simply attempt to force growth and retention by losing money. Through the frameworks in this class, we developed three categories of micro-level FOMs. These micro-level figures of merit include smaller levers that can be used to influence the marketplace and feed into the final macro-level evaluation. <br> | ||
'''Macro-Level Figures of Merit'''<br> | '''''Macro-Level Figures of Merit'''''<br> | ||
As noted, macro-level figures of merit are essential for evaluating the overall health and trajectory of a marketplace (size and efficiency) | As noted, macro-level figures of merit are essential for evaluating the overall health and trajectory of a marketplace (size and efficiency) but do not provide sufficient insight to improve the marketplace through virtuous feedback loops. Using these FOMs to influence the marketplace is sort of like telling a basketball player to shoot better, with no further direction or plan. Below, we explain how these figures of merit depict the overall market's health and their several limitations. | ||
'''Scale [%]''' | '''Scale [%]''' | ||
| Line 53: | Line 53: | ||
''' User Base [# Total Active Users] ''' | ''' User Base [# Total Active Users] ''' | ||
(can subdivide to separate sides of market: buyers and service providers) | (can subdivide to separate sides of the market: buyers and service providers) | ||
''' Average Margin [%] [average of market fee / average total transaction value] ''' | ''' Average Margin [%] [average of market fee / average total transaction value] ''' | ||
(declining margin may show broad acceptance and use along with industry maturity; however, many companies (including eBay and Amazon) increase their margin with competition is light and then reduce it to drive out competitors) | (declining margin may show broad acceptance and use along with industry maturity; however, many companies (including eBay and Amazon) increase their margin with the competition is light and then reduce it to drive out competitors) | ||
''' Transaction Speed [Seconds] ''' | ''' Transaction Speed [Seconds] ''' | ||
| Line 63: | Line 63: | ||
'''Macro-Level Figures of Merit - Overview and Limitations'''<br> | '''Macro-Level Figures of Merit - Overview and Limitations'''<br> | ||
In this section, we discuss each macro figure of merit at a greater level of depth, before proposing several micro figures of merit that feed into impact these top-line figures of merit. <br> | In this section, we discuss each macro figure of merit at a greater level of depth, before proposing several micro figures of merit that feed into the impact these top-line figures of merit. <br> | ||
'''Scale''' <br> | '''Scale''' <br> | ||
In considering the figure of merit, Scale, we looked at the data reported from the U.S. Census Bureau from the years 2008 - 2017. When comparing the growth in the size of the eCommerce market as a percentage of total commerce it became clear that there is no clear relationship between this percentage change and the growth rate of the major online market places. Amazon has grown at an exponential rate since it's inception if the late 1990s; the explosive growth is not directly tied to the Scale of the U.S. eCommerce market. Scale, although useful in understanding the greater context of the market, does not appear to directly play a role in the success or failure of a given company. This makes intuitive sense, as Scale only represents the market opportunity and provides no insight into how well a certain company could capitalize on that scale. | |||
'''User Base''' <br> | '''User Base''' <br> | ||
In considering the figure of merit, User Base, we fully believe that User Base is one of the most vital aspects of a flourishing online eCommerce marketplace, but data for exact user base numbers is hard to come by. Websites like eBay published there user base metrics for the first few years of their existence but quickly stopped providing those numbers outside the company. We believe the User base is a vital factor in a business's success because almost all aspects of profit an online eCommerce platform can make are directly tied to the number of users leveraging the platform. Growing user base is a key aspect of an eCommerce marketplaces business strategy in its early years, and in many ways operates with a momentum. The momentum would lead the growth rate of users to nominally form an S curve as the early adopters are initially slow to join, but once a critical mass has joined the growth is rapid until a saturation point is reached. | |||
'''Average Margin''' <br> | '''Average Margin''' <br> | ||
In considering the figure of merit, Average Margin, | In considering the figure of merit, Average Margin, we have reviewed the current and/or historical margins for eBay, Amazon, Etsy, Upwork (services marketplace), and Mechanical Turk (Amazon procurement marketplace for simple e-commerce tasks). These marketplaces appear to use their margins either in the same way that the ocean container shipping behemoths use their margins, to drive out competition at opportune times (by reducing margins), or to increase revenue in times of scarce competition on a particular sector. In the early days of eBay, the margins were set by founder Pierre Omidyar, often as a way to control the volume on the website (rather than as a revenue-maximizing effort). Omidyar was heavily influenced by considerations of fairness and community input and set easy to understand lower margins. Over time, both eBay and Amazon have developed complex revenue models, with different margins on different product lines, which seem to maximize revenue by understanding the product providers' tolerance levels, price effectively against e-commerce and other purchasing avenues, and in order to increase product availability. Etsy has a similarly complex fee structure, meant to encourage or discourage certain seller behaviors. Further, e-commerce companies use additional cost strategies to prevent phantom listings and other negative actions, encourage referrals, and to generate other advantageous behaviors. <br> | ||
For service marketplaces, including both Upwork and MTurk (Mechanical Turk), the margin is set currently (Fall 2019) at 20% of the value of the service, which seems to balance the need for a robust set of service providers with revenue demands of these businesses. In order to discourage outside the marketplace transactions, Upwork has instituted a margin reducing schedule based on lifetime earnings of Upwork contractors. For example, once certain lifetime revenue thresholds have been met, workers yield less of their earnings to Upwork. <br> | For service marketplaces, including both Upwork and MTurk (Mechanical Turk), the margin is set currently (Fall 2019) at 20% of the value of the service, which seems to balance the need for a robust set of service providers with revenue demands of these businesses. In order to discourage outside the marketplace transactions, Upwork has instituted a margin reducing schedule based on lifetime earnings of Upwork contractors. For example, once certain lifetime revenue thresholds have been met, workers yield less of their earnings to Upwork. <br> | ||
| Line 82: | Line 82: | ||
'''Transaction Speed'''<br> | '''Transaction Speed'''<br> | ||
In considering the figure of merit of speed, we looked at the transaction speed to conduct trade between New York and California between 1825 and the present. We considered two components to the conduct of trade, the time to connect with the opposite party (either in person or through another communication method) and the time to consummate payment. We considered the fastest forms of communication and payment. For example, we skipped payment by check, as in person currency transactions and remote Western Union payments eclipsed the speed of checks at early dates. Further, we did not consider service fulfillment times and deliberation times, which may or may not be reduced over time, but are not necessarily related to the development of faster markets. | In considering the figure of merit of speed, we looked at the transaction speed to conduct trade between New York and California between 1825 and the present. We considered two components to the conduct of trade, the time to connect with the opposite party (either in person or through another communication method) and the time to consummate payment. We considered the fastest forms of communication and payment. For example, we skipped payment by check, as in-person currency transactions and remote Western Union payments eclipsed the speed of checks at early dates. Further, we did not consider service fulfillment times and deliberation times, which may or may not be reduced over time, but are not necessarily related to the development of faster markets. | ||
[[File:Transaction Speed.jpg|frame|center|Transaction Speed between New York and California Since 1825 (Measured in Seconds, Logarithmic Scale)]] | [[File:Transaction Speed.jpg|frame|1100px|center|Transaction Speed between New York and California Since 1825 (Measured in Seconds, Logarithmic Scale)]] | ||
{| class="wikitable" | {| class="wikitable" | ||
| Line 110: | Line 110: | ||
<br> | <br> | ||
'''Micro-Level Figures of Merit'''<br> | '''''Micro-Level Figures of Merit'''''<br> | ||
We use three micro-level figure of merit categories to drive change, including trust mechanisms, complexity appearance reducing mechanisms, and customer acquisition and retention mechanisms. <br> | We use three micro-level figure of merit categories to drive change, including trust mechanisms, complexity appearance reducing mechanisms, and customer acquisition and retention mechanisms. <br> | ||
'''Trust Mechanisms (Assurance Processes)'''<br> | '''Trust Mechanisms (Assurance Processes)'''<br> | ||
[Marketplace Participants/Hour] <br> | [Marketplace Participants/Hour] <br> | ||
Work (trust mechanisms) = (Total Service Providers + Total Payors) / Hour <br> | Work (trust mechanisms) = (Total Service Providers + Total Payors) / Hour <br> | ||
'''Trust mechanisms''' are divided into '''three groups''' ('''average reviews per service offering''', '''average visibility - number of watchers - per service offering''', and '''average rating per service offering'''). These can be measured and quantified to determine tipping points to move towards acquisition doubling churn. <br> | |||
'''Complexity Reduction Mechanisms''' <br> | '''Complexity Reduction Mechanisms''' <br> | ||
[Hours/Contract]<br> | [Hours/Contract]<br> | ||
Work (complexity reduction mechanisms) = (Time for Payor to Post Job + Time for Contractor to Find Job + Time to Close Contract) / Contract <br> | Work (complexity reduction mechanisms) = (Time for Payor to Post Job + Time for Contractor to Find Job + Time to Close Contract) / Contract <br> | ||
'''Complexity appearance reduction mechanisms''' include '''service question forums, simplified formats for posting and searching services, and focusing on services that result in transactions with lower communication costs'''. Service question metrics include the number of questions (both new and depth of strains) and can be regressed against transaction speed and closure rates. Formats can be tested similar to A/B testing, focusing on formatting decisions that reduce question and answer iterations and improve transaction velocity. <br> | |||
'''Customer Acquisition and Retention Mechanisms''' <br> | '''Customer Acquisition and Retention Mechanisms''' <br> | ||
[Change in Marketplace Participants/Hour]<br> | [Change in Marketplace Participants/Hour]<br> | ||
Work (customer acquisition and retention mechanisms) = (Change in Total Payors + Change in Total Contractors) / Hour <br> | Work (customer acquisition and retention mechanisms) = (Change in Total Payors + Change in Total Contractors) / Hour <br> | ||
'''Lowering customer acquisition costs (and reducing churn/multi-homing)''' through marketing and financial incentives are similar to currently available best practices. Churn is the process of users leaving a marketplace. Multi-homing is the process of users switching constantly between multiple websites, resulting in false positives for marketplace adoption. Here, marketing efforts (both inbound and outbound) can be used and measured regarding their impact on customer acquisition costs and churn/multi-homing. Financial incentives operate in the same way that eBay and Amazon constantly tinker with there product margin rates to either attract sellers or maximize revenue. Similarly, Upwork uses a scaled financial model, encouraging recurrent users to stay on the marketplace (and avoid outside deals) by reducing the margins over time and use. This is similar to accelerators for sales people, though in reverse. | |||
We divide '''service complexity''' as follows. Low complexity are tasks that can be understood in a few minutes or less, require no training, and are measurable/scorable as successful or not within less than a minute by humans or computer programs. Mechanical Turk by Amazon focuses on low complexity services. High complexity tasks involve complex projects, such as specifically tailored consulting, legal, or R&D projects, where stakeholder analysis and group ideation and alignment are key success factors. Medium complexity projects are similar or less complex than those currently available on Upwork. They include projects for recurrent problems, where customer-provider alignment could be generated through a few simple interactions either online or via voice/video communications. | |||
'''Summary of Figures of Merit''' <br> | '''Summary of Figures of Merit''' <br> | ||
| Line 152: | Line 154: | ||
| Micro || Customer Acquisition and Retention Mechanisms || Work (customer acquisition and retention mechanisms) = (Change in Total Payors + Change in Total Contractors) / Hour || Change in Marketplace Participants / Hour | | Micro || Customer Acquisition and Retention Mechanisms || Work (customer acquisition and retention mechanisms) = (Change in Total Payors + Change in Total Contractors) / Hour || Change in Marketplace Participants / Hour | ||
|} | |} | ||
Based on the issues with isolating variables, the variety of influences in markets, and dearth of major e-commerce success stories (few successes and many failures), we were not able to directly correlate micro-level decisions with marketplace health or growth. Accordingly, we have not considered the micro-FOMs in terms of tornado charts or competitive comparisons. Rather, we have considered their groupings, as described throughout, and how to stage these relative micro-FOM groups for future tests. | |||
==Alignment with Company Strategic Drivers== | ==Alignment with Company Strategic Drivers== | ||
| Line 168: | Line 172: | ||
! Number !! Strategic Drivers !! Alignment And Targets !! FOMs Impacted | ! Number !! Strategic Drivers !! Alignment And Targets !! FOMs Impacted | ||
|- | |- | ||
| 1 || To increase the amount of active yearly sellers uniformly across the available categories || Etsy will aim to increase the percentage of active yearly sellers by 5% year over year, and focus on attaining sellers of products in under-represented categories || Micro FOMs including | | 1 || To increase the amount of active yearly sellers uniformly across the available categories || Etsy will aim to increase the percentage of active yearly sellers by 5% year over year, and focus on attaining sellers of products in under-represented categories || Micro FOMs including Trust Mechanisms and Customer Acquisition and Retention Mechanisms | ||
|- | |- | ||
| 2 || To increase the amount of yearly active buyers on the platform || For every 1% gain in sellers we will aim to increase the number of active buyers on the platform by 3%. The demand for products should encourage more sellers to come to the platform || Micro FOM Customer Acquisition and Retention Mechanisms | | 2 || To increase the amount of yearly active buyers on the platform || For every 1% gain in sellers we will aim to increase the number of active buyers on the platform by 3%. The demand for products should encourage more sellers to come to the platform || Micro FOM Customer Acquisition and Retention Mechanisms | ||
|- | |- | ||
| 3 || To maintain a consistent year over year growth in revenue || Revenue is not as much of a primary driver as gaining scale is but is key to gaining future investment and increasing internal development efforts on new initiatives || Micro FOM Customer Acquisition and Retention Mechanisms | | 3 || To maintain a consistent year over year growth in revenue || Revenue is not as much of a primary driver as gaining scale is but is key to gaining future investment and increasing internal development efforts on new initiatives. The year over year growth target should exceed the annual total U.S. e-commerce overall growth by 5% || Micro FOM Customer Acquisition and Retention Mechanisms | ||
|} | |} | ||
| Line 178: | Line 182: | ||
'''Discussion'''<br> | '''Discussion'''<br> | ||
In considering these strategic drivers against the proposed FOMs, it is interesting to note that the selected micro FOMs focused on customer acquisition and retention are the least impactful of the three micro FOMs. However, many e-commerce companies focus on scale through marketing and incentives, rather than leveraging more powerful efforts of trust mechanisms and complexity reduction mechanisms. The several charts below the relative impact of the three micro-FOMs (pie chart) and the relative impact for inventions by Amazon and eBay (two block charts). Impact is measured as the increase in net sales over the following year by the company implementing the invention. Because this is a complex system of systems problem, with many swirling uncontrolled variables at macro and micro levels, causation cannot be assumed from correlation. However, the logic of this approach provides a starting point for engineering success of online reverse procurement auctions. One | In considering these strategic drivers against the proposed FOMs, it is interesting to note that the selected micro FOMs focused on customer acquisition and retention are the least impactful of the three micro FOMs. However, many e-commerce companies focus on scale through marketing and incentives, rather than leveraging more powerful efforts of trust mechanisms and complexity reduction mechanisms. The several charts below the relative impact of the three micro-FOMs (pie chart) and the relative impact for inventions by Amazon and eBay (two block charts). Impact is measured as the increase in net sales over the following year by the company implementing the invention. Because this is a complex system of systems problem, with many swirling uncontrolled variables at macro and micro levels, causation cannot be assumed from correlation. However, the logic of this approach provides a starting point for engineering success of online reverse procurement auctions and marketplaces. One external variable, the US GDP growth, was extracted from the impacts from inventions, though many others could have impacted the relationships shown. Particularly, bucketing the FOMs by perceived impact allows for top-level capital contribution decisions and further provides a structure for conducting many small tests of innovations in the three bucketed areas (trust mechanisms, complexity reduction mechanisms, and customer acquisition and retention mechanisms). <br> | ||
[[File:Relative Value of eCommerce Inventions (eBay and Amazon).jpg|frame|center|Micro FOMs Relative Impacts ]] | [[File:Relative Value of eCommerce Inventions (eBay and Amazon).jpg|frame|center|Micro FOMs Relative Impacts ]] | ||
[[File:EBay Inventions.jpg| | [[File:EBay Inventions.jpg|1200px|center|eBay Inventions Impact Chart]] | ||
[[File:Amazon Invention Impact Summary.jpg| | [[File:Amazon Invention Impact Summary.jpg|1200px|center|Amazon Inventions Impact Chart]] | ||
==Positioning of Company vs. Competition== | ==Positioning of Company vs. Competition== | ||
[[File:CompetitionMarketShare.png|frameless|Source: SimilarWeb]| | [[File:CompetitionMarketShare.png|frameless|Source: SimilarWeb]|1000px]] | ||
The above Pie Chart captures the fact that Amazon dominates the online e-commerce market. 56% of all e-commerce interactions, as reported by similar web, were via Amazon.com. Amazon is a dominant entity in the space because it has achieved a massive scale, an extremely high user base, and high customer satisfaction and "stickiness." Stickiness is a common phrase used to describe the number of things that bring a user back to a certain online marketplace. In the case of Amazon, these are things like prime shipping, Amazon video, Amazon music, and discounts at related stores like Whole Foods. All of these factors combined to make Amazon an extremely dominant force in e-commerce that is unlikely to waiver over the coming years. | The above Pie Chart captures the fact that Amazon dominates the online e-commerce market in the United States (Amazon also is a worldwide leader, but sites like Aliexpress and Taobao dominate the Chinese/Asian market). 56% of all e-commerce interactions, as reported by similar web, were via Amazon.com. Amazon is a dominant entity in the space because it has achieved a massive scale, an extremely high user base, and high customer satisfaction and "stickiness." Stickiness is a common phrase used to describe the number of things that bring a user back to a certain online marketplace. In the case of Amazon, these are things like prime shipping, Amazon video, Amazon music, and discounts at related stores like Whole Foods. All of these factors combined to make Amazon an extremely dominant force in e-commerce that is unlikely to waiver over the coming years. | ||
From the perspective of a company like Etsy, which only captures about 3% of the total e-commerce market, there are two views and perspectives to take. Either you take the view that there is very large upside potential still left in the e-commerce space, or that you have missed the opportunity for mass adoption and growth of your e-commerce platform is low so you should, therefore, lean into your niche marketplace. Without an abundance of data it's hard to see with the right approach it, what we can do is illustrate the fluctuating revenues that the smaller market places are seen when compared to that of their large scale competitors. The figure below highlights Etsy, eBay, and Amazon revenue from their inception. | From the perspective of a company like Etsy, which only captures about 3% of the total e-commerce market, there are two views and perspectives to take. Either you take the view that there is very large upside potential still left in the e-commerce space, or that you have missed the opportunity for mass adoption and growth of your e-commerce platform is low so you should, therefore, lean into your niche marketplace. Without an abundance of data it's hard to see with the right approach it, what we can do is illustrate the fluctuating revenues that the smaller market places are seen when compared to that of their large scale competitors. The figure below highlights Etsy, eBay, and Amazon's revenue from their inception. | ||
[[File:RevenueVsYear.png| | [[File:RevenueVsYear.png|1000px]] | ||
What is clear from this graph is that Etsy was in no way a disruptor to the dominance of Amazon in the e-commerce marketplace. But this is expected. Etsy did not enter this marketplace with the intent of being the source for everything you would ever need (like Amazon wants to be). Etsy entered into this sector to fill a niche desire that was under-addressed by the larger players in the space. | What is clear from this graph is that Etsy was in no way a disruptor to the dominance of Amazon in the e-commerce marketplace. But this is expected. Etsy did not enter this marketplace with the intent of being the source for everything you would ever need (like Amazon wants to be). Etsy entered into this sector to fill a niche desire that was under-addressed by the larger players in the space. | ||
| Line 201: | Line 205: | ||
==Technical Model & Financial Model: Macro Level Trends== | ==Technical Model & Financial Model: Macro Level Trends== | ||
Challenge: | '''Challenge:'''<br> | ||
Because the system at the root of this wiki page is a non-physical complex system of systems, writing a technical model has been challenging. There are not underlying physic equations that govern how these complex e-commerce markets work, but rather a series of frameworks across many different disciplines that explain components of the system of systems at various scales and assuming different boundaries. The approach we have taken to capture and build a model for how the system performs is a couple of different data science methodologies, both regression and classification-based, that leverage large amounts of data on the key companies and the environment in which the companies are operating. | Because the system at the root of this wiki page is a non-physical complex system of systems, writing a technical model has been challenging. There are not underlying physic equations that govern how these complex e-commerce markets work, but rather a series of frameworks across many different disciplines that explain components of the system of systems at various scales and assuming different boundaries. The approach we have taken to capture and build a model for how the system performs is a couple of different data science methodologies, both regression and classification-based, that leverage large amounts of data on the key companies and the environment in which the companies are operating. | ||
| Line 234: | Line 238: | ||
** Miscellaneous nondurable goods | ** Miscellaneous nondurable goods | ||
'''Discussion:'''<br> | |||
Initial approaches to leverage all the above data in a regression model proved impossible, due to all the coupling. Attempts at a CART model also shown little insight into the underlying mechanics of how these complex marketplaces perform. In this stead, we considered micro FOMs, as described above, in light of analysis of inventions of e-commerce companies and their remarks of key drivers of their success. Below we consider the overall growth rates of the US economy and e-commerce sector, as well as the key insights from the country's most robust and sophisticated marketplace, Amazon. | |||
Initial approaches to leverage all the above data in a regression model proved impossible, due to all the coupling. Attempts at a CART model also shown little insight into the underlying mechanics of how these complex marketplaces perform. | |||
Scale of E-Commerce Market: | Scale of E-Commerce Market: | ||
[[File:Ecommerce Market.png| | [[File:Ecommerce Market.png|1000 px]] | ||
Key Factors for User Retention of Amazon: | Key Factors for User Retention of Amazon: | ||
[[File:Key Factors for Amazon Users.png| | [[File:Key Factors for Amazon Users.png|1000 px]] | ||
The key factors above provide insight into the factors outside of scale that contribute to user retention of these major platforms. What stand out most is that price is the key consideration that users use to validate their choice in a given marketplace. Other factors having to due with flexibility and ease of use also play a major role in user satisfaction. | The key factors above provide insight into the factors outside of scale that contribute to user retention of these major platforms. What stand out most is that price is the key consideration that users use to validate their choice in a given marketplace. Other factors having to due with flexibility and ease of use also play a major role in user satisfaction. Using our micro FOM analysis, trust mechanisms include positive product reviews, flexible return policy, and brand name; complexity reduction mechanisms include low shipping cost and fast shopping time; and customer acquisition and retention mechanisms include price and prime eligibility. | ||
Gross Merchandise Volume: | Gross Merchandise Volume: | ||
[[File:GrossMerchandiseVolume.png| | [[File:GrossMerchandiseVolume.png|1000 px]] | ||
"Gross Merchandise Volume (alternatively Gross Merchandise Value or GMV) is a term used in online retailing to indicate a total sales dollar value for merchandise sold through a particular marketplace over a certain time frame. Site revenue comes from fees and is different from the dollar value of items sold.[1] | "Gross Merchandise Volume" (alternatively Gross Merchandise Value or GMV) is a term used in online retailing to indicate a total sales dollar value for merchandise sold through a particular marketplace over a certain time frame. Site revenue comes from fees and is different from the dollar value of items sold.[1] | ||
GMV for e-commerce retail companies means sale price charged to the customer multiplied by the number of items sold. For example, if a company sells 10 books at $100, the GMV is $1,000. This is also considered as "gross revenue". In this case, the business model is based on a retail model, where the company basically purchases the items, maintains inventory (if need be) and finally, sells or delivers the items to customers. It does not tell the net sales as GMV does not include costs involved and returns of products." (https://en.wikipedia.org/wiki/Gross_merchandise_volume) | GMV for e-commerce retail companies means sale price charged to the customer multiplied by the number of items sold. For example, if a company sells 10 books at $100, the GMV is $1,000. This is also considered as "gross revenue". In this case, the business model is based on a retail model, where the company basically purchases the items, maintains inventory (if need be) and finally, sells or delivers the items to customers. It does not tell the net sales as GMV does not include costs involved and returns of products." (https://en.wikipedia.org/wiki/Gross_merchandise_volume) | ||
==Technical Model & Financial Model: Micro-FOM | ==Technical Model & Financial Model: Micro-FOM Data Analysis== | ||
The data used for the generation of all plots in the section was taken via sampling of the data directly from the Amazon.com, Ebay.com, Etsy.com, and mturk.com using a series of both manual and automated web-scrapping processes. All relevant code developed for this effort can be found at [https://github.com/Foolsby/TechRoadMappingScraper Tech RoadMapping Website Scraper] | The data used for the generation of all plots in the section was taken via sampling of the data directly from the Amazon.com, Ebay.com, Etsy.com, and mturk.com using a series of both manual and automated web-scrapping processes. All relevant code developed for this effort can be found at [https://github.com/Foolsby/TechRoadMappingScraper Tech RoadMapping Website Scraper] | ||
The data for Amazon, Ebay, and Etsy was collected via random sampling of available product listings. The number of data samples for these websites was 75, 50, and 50 respectively. It is important to note that although the websites appear to have a common template for product pages we encountered a significant variety of data reported (or not reported) on each of the product pages. Raw data samples can be found below: | The data for Amazon, Ebay, and Etsy was collected via random sampling of available product listings. The number of data samples for these websites was 75, 50, and 50 respectively. It is important to note that although the websites appear to have a common template for product pages we encountered a significant variety of data reported (or not reported) on each of the product pages. Raw data samples can be found below: | ||
Due to a significantly more robust API, all data for M Turk (which represents all live work currently on the site) could be collected; this resulted in a data with 943 separate observations. This data was also formated extremely consistently, enabling us to build a much better understanding of the underlying trends for the data. | Due to a significantly more robust API, all data for M Turk (which represents all live work currently on the site) could be collected; this resulted in a data with 943 separate observations. This data was also formated extremely consistently, enabling us to build a much better understanding of the underlying trends for the data. | ||
[[File:Amazon Graphic.png| | [[File:Amazon Graphic.png|1000 px]] | ||
'''Amazon Data Subset (N = 75):''' | '''Amazon Data Subset (N = 75):''' | ||
| Line 279: | Line 282: | ||
|} | |} | ||
[[File:EBayStatistics.png|1000 px]] | |||
[[File: | |||
'''eBay Data Subset (N = 50):''' | '''eBay Data Subset (N = 50):''' | ||
| Line 292: | Line 294: | ||
|} | |} | ||
[[File:Etsy Graphic.png| | [[File:Etsy Graphic.png|1000 px]] | ||
'''Etsy Data Subset (N = 50):''' | '''Etsy Data Subset (N = 50):''' | ||
| Line 309: | Line 311: | ||
[[File:MTurk Graphic.png|| | [[File:MTurk Graphic.png||1000 px]] | ||
'''Mechanical Turk Data Subset (N = 943):''' | '''Mechanical Turk Data Subset (N = 943):''' | ||
| Line 324: | Line 326: | ||
|Eric Meisel||Find Organization Data Based on Organization Name||10,344||$0.01 ||11/15/19 14:23 | |Eric Meisel||Find Organization Data Based on Organization Name||10,344||$0.01 ||11/15/19 14:23 | ||
|} | |} | ||
'''Discussion:'''<br> | |||
Much of the data sought to analyze the micro-FOMs is not readily apparent from the companies or their public facing websites, as market tests are either not clear or are not distinguishable from the many tests the sites are continuously running. A major takeaway from this analysis is that the technology roadmapping frameworks at first glance do not appear to apply well to this type of system of systems technology. However, at closer look, the frameworks are extremely helpful in capital allocation and project definition efforts. For instance, as stated above, several reverse procurement marketplaces seem to simply use brute force efforts to impact market scale and growth. The technology roadmapping frameworks provide a solid foundation from which to conduct tests, by dividing projects into three categories - trust mechanisms, complexity reduction mechanisms, and customer acquisition and retention mechanisms. Based to the data above, which is imperfect due to the complexity of the systems and their boundary environments, the priorities (based on relative impacts) should be (1) trust mechanisms, (2) complexity reduction mechanisms, and (3) customer retention and acquisition mechanisms. However, it is worth noting that these process types roughly track the typical chronological development of marketplaces - establish trust, simplify transactions, and acquire and retain customers. Regardless, these three micro FOM buckets provide a means to analyze projects and allocated capital effectively. Further, with online platforms, projects and tests can be conducted quickly and at lower costs, permitting the development of data for each micro FOM and sub-ordinate drivers. | |||
==Key Publications, Presentations and Patents== | ==Key Publications, Presentations and Patents== | ||
| Line 399: | Line 404: | ||
Popiel, P. (2017). '''“Boundaryless” in the creative economy: Assessing freelancing on Upwork.''' Critical Studies in Media Communication, 34(3), 220–233. https://doi.org/10.1080/15295036.2017.1282618<br><br> | Popiel, P. (2017). '''“Boundaryless” in the creative economy: Assessing freelancing on Upwork.''' Critical Studies in Media Communication, 34(3), 220–233. https://doi.org/10.1080/15295036.2017.1282618<br><br> | ||
==List of R&T Projects and Prototypes (R&D Portfolio)== | ==List of R&T Projects and Prototypes (R&D Portfolio)== | ||
[[File: | In developing the list of projects and their relative projected impacts we focused on high yield and foundational projects (trust mechanisms, then complexity reduction mechanisms), while also allocating money towards customer retention and acquisition efforts. Our three bucket framework and the ability to rapidly test through online platforms undergird our approach to R&D and R&T based on our analysis. | ||
[[File:C697C357-9FB8-407A-AE4F-9835BF777DDB.jpg|700 px]] | |||
{| class="wikitable" | {| class="wikitable" | ||
| Line 424: | Line 431: | ||
In developing our roadmap, several recurrent issues present difficulties. First, from a data standpoint, we can identify the type of data needed, but would need to self-develop this data. This would be an expansive undertaking and likely performable only by the owner of the marketplace. Second, for a system of systems problem, we cannot isolate variables to determine impact. For example, we can see major efforts to influence micro-level FOMs by eBay or Amazon during a calendar year, but those impacts are drowned by many other macro level trends and activities, such as overall e-commerce growth, competitor actions, etc. In light of the limitations of the technology roadmap model, we are focused on developing intuition and a general feel for magnitudes and directions of variables based on modeling individual marketplaces, as well as identifying the data acquisition necessary to develop a comprehensive roadmap for future reverse procurement marketplaces and auctions. | In developing our roadmap, several recurrent issues present difficulties. First, from a data standpoint, we can identify the type of data needed, but would need to self-develop this data. This would be an expansive undertaking and likely performable only by the owner of the marketplace. Second, for a system of systems problem, we cannot isolate variables to determine impact. For example, we can see major efforts to influence micro-level FOMs by eBay or Amazon during a calendar year, but those impacts are drowned by many other macro level trends and activities, such as overall e-commerce growth, competitor actions, etc. In light of the limitations of the technology roadmap model, we are focused on developing intuition and a general feel for magnitudes and directions of variables based on modeling individual marketplaces, as well as identifying the data acquisition necessary to develop a comprehensive roadmap for future reverse procurement marketplaces and auctions. | ||
Our target is to develop a multi-purpose reverse online procurement auction, focused on services of medium complexity, which would be broadly generalizable across different medium complexity service segments. To achieve a '''target monthly adoption level of twice the churn rate for the marketplace''' (both sides), we focus on '''enhancing trust mechanisms''', '''efforts to reduce apparent complexity''' (through API's similar to Mechanical Turk), and '''lowering customer acquisition costs (and reducing churn/multi-homing) through marketing and financial incentives'''. | Our target is to develop a multi-purpose reverse online procurement auction, focused on services of medium complexity, which would be broadly generalizable across different medium complexity service segments. To achieve a '''''target monthly adoption level (change in number of total participants per month) of twice the churn rate for the marketplace every month for a period of 18 months straight''''' (both sides), we focus on '''enhancing trust mechanisms''', '''efforts to reduce apparent complexity''' (through API's similar to Mechanical Turk), and '''lowering customer acquisition costs (and reducing churn/multi-homing) through marketing and financial incentives'''. Our strategy is to make use of these three categories and to perform many micro-projects and tests to quantify impacts from the three micro FOM groups and sub-ordinate drivers within each group. The first batch of projects provides a good start in this regard. | ||
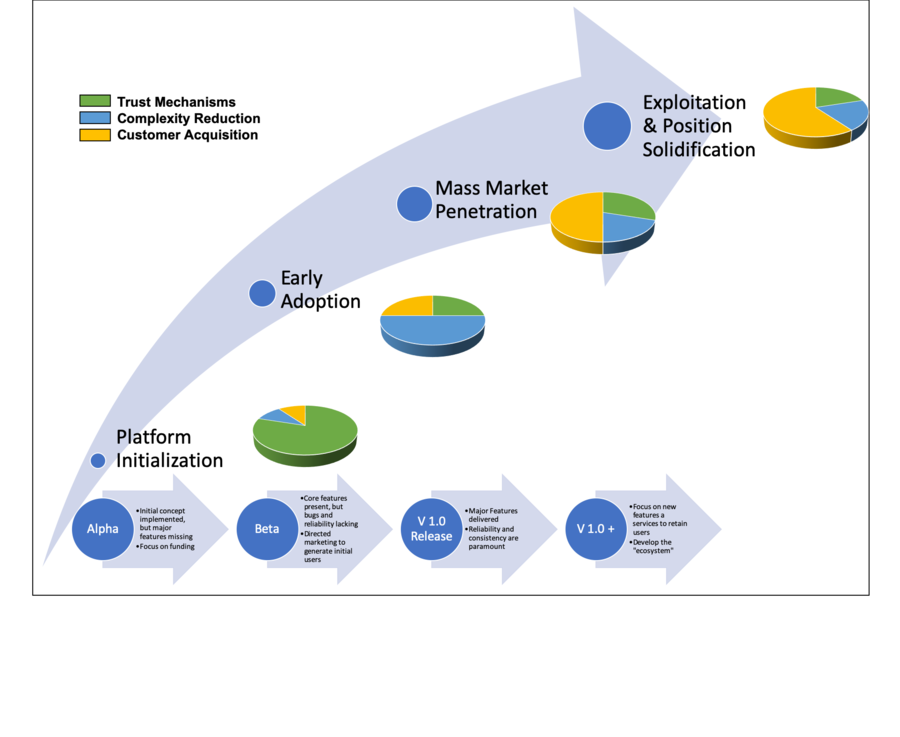
''' | '''Micro-FOM Focus Over the Life of a eCommerce Platform''' <br> | ||
[[File:Product Growth Arrow v2.png| 900px]] | |||
Latest revision as of 17:12, 5 December 2019
Technology Roadmap Sections and Deliverables
Roadmap Overview
3RPM - Reverse Procurement Markets
This Roadmap focuses on online reverse procurement marketplaces and auctions (referred to alternatively either as RPMs for markets or RPAs for auctions), which are online marketplaces and auctions where service providers bid on different service requests from people and companies in need of contract work. Examples include Upwork, Mechanical Turk, and other industry specific markets and auctions. While no reverse procurement auction or marketplace exists at scale, many product marketplace do, including Amazon and eBay. Accordingly, we have considered both product and service e-commerce marketplaces for the purpose of developing this roadmap.
The emphasized figure of merit below is user base, measured as either active buyers (of products) or service providers (for services). We have chosen to segment by several major e-commerce platforms of both services and products, which generally show the relative scope and growth of each sector. The below chart is a dual axis chart, showing the impact of major developments in e-commerce technology through the grey line and user bases over time through the separately plotted dots. The grey line shows diminishing returns from e-commerce sector, which is slowing its rate of penetration. The second axis shows that while product markets have grown steadily in scale, service markets remain small and fragmented even 20+ years into the e-commerce cycle.
Figure of Merit: Micro-FOM Innovations (All Three Micro FOMs) to e-Commerce Growth Over Time - Declining Impact as Market Matures
Two Axis Chart - Grey Line (Impact of E-Commerce Innovations Over Time), Second Axis - Various e-Commerce Site Populations Over Time
'Theoretical Limit: World Population
(all transactions for goods/services are online)
Below, the object process model (OPM), serves as high level schematic explaining the function and form of reverse procurement auctions and marketplaces.
Design Structure Matrix (DSM) Allocation
The design structure matrix is a matrix three levels deep in the e-commerce segment. It lies below e-commerce (level 1) and e-commerce services (level 2). Level 0 would be general commerce of products and service (both online and offline). Level 3 (RPAs or RPMs) are below other e-commerce services such as message boards (like Craigslist) which advertise service providers and those in need, but do not execute the transactions through the marketplace or auction. Execution of the transaction distinguishes RPAs/RPMs from message boards and other mechanisms for simply connecting sides of the market.
Roadmap Model using OPM
The final output of the system is measured by job contracts over a period of time: Work(out) = Jobs Contracted / Hour
Within the technology, internal parts of the system serve two primary functions, to either (1) increase the number of jobs in the market or (2) reduce the time to contract. This time to contract includes time to post job listings, to find listings, and to complete the final contracting. In discussing the several processes in the system, we divide them into three micro figures of merits (Micro-FOMs), which are described more fully below in the roadmap. First, trust mechanisms increase the number of marketplace participants (resulting in more contracted jobs). Trust mechanisms include the four assurance processes at the second level of the diagram (Provides Financial Assurance, Provides Privacy and Data Assurance, Provides Technology Assurance, and Provides Service Assurance). As the marketplace is time bound, trust mechanisms measure total participants (service providers and payors) over a period of time. Second, complexity reduction mechanisms include aspects of the job description and submission process (provide and post processes) and bidding process (bid). Additionally, the marketplace operator's actions to "manage and oversee" also operate to reduce complexity and speed the project definition, search, and contracting process. These processes are measured in terms of speed, as the time from job posting to successful job contracting. Third, customer acquisition and retention processes regard two side market effects. These processes (each side attracting the other side) quantify the impact of the quality and quantity of participants on both sides of the marketplace, which attract the other side.
Trust Mechanisms (Assurance Processes)
[Marketplace Participants/Hour]
Work (trust mechanisms) = (Total Service Providers + Total Payors) / Hour
Complexity Reduction Mechanisms
[Hours/Contract]
Work (complexity reduction mechanisms) = (Time for Payor to Post Job + Time for Contractor to Find Job + Time to Close Contract) / Contract
Customer Acquisition and Retention Mechanisms
[Change in Marketplace Participants/Hour]
Work (customer acquisition and retention mechanisms) = (Change in Total Payors + Change in Total Contractors) / Hour
Figures of Merit
After extensive analysis and experimentation, we divided figures of merit into macro-level and micro-level figures of merit. Macro-level figures of merit are top-level items that generally describe the health of a marketplace but are not useful, other than to imply brute force techniques, in establishing smaller efforts to increase the marketplace growth and retention rates. This is a major insight from this course and project - that many well-funded marketplaces simply attempt to impact retention and total market size through brute force efforts (typically by subsidizing one or both sides of the market). Lyft and Uber do not have scalable economic models (they lose money every quarter) because they simply attempt to force growth and retention by losing money. Through the frameworks in this class, we developed three categories of micro-level FOMs. These micro-level figures of merit include smaller levers that can be used to influence the marketplace and feed into the final macro-level evaluation.
Macro-Level Figures of Merit
As noted, macro-level figures of merit are essential for evaluating the overall health and trajectory of a marketplace (size and efficiency) but do not provide sufficient insight to improve the marketplace through virtuous feedback loops. Using these FOMs to influence the marketplace is sort of like telling a basketball player to shoot better, with no further direction or plan. Below, we explain how these figures of merit depict the overall market's health and their several limitations.
Scale [%] [$ of services transacted online/$ of total services transacted online & offline]
User Base [# Total Active Users] (can subdivide to separate sides of the market: buyers and service providers)
Average Margin [%] [average of market fee / average total transaction value] (declining margin may show broad acceptance and use along with industry maturity; however, many companies (including eBay and Amazon) increase their margin with the competition is light and then reduce it to drive out competitors)
Transaction Speed [Seconds]
[measured from payor’s initial interest in seeking contract work to contracting, and does not include fulfillment time (which may or may not be shortened); includes payor posting time + contractor search time + contracting time]
Macro-Level Figures of Merit - Overview and Limitations
In this section, we discuss each macro figure of merit at a greater level of depth, before proposing several micro figures of merit that feed into the impact these top-line figures of merit.
Scale
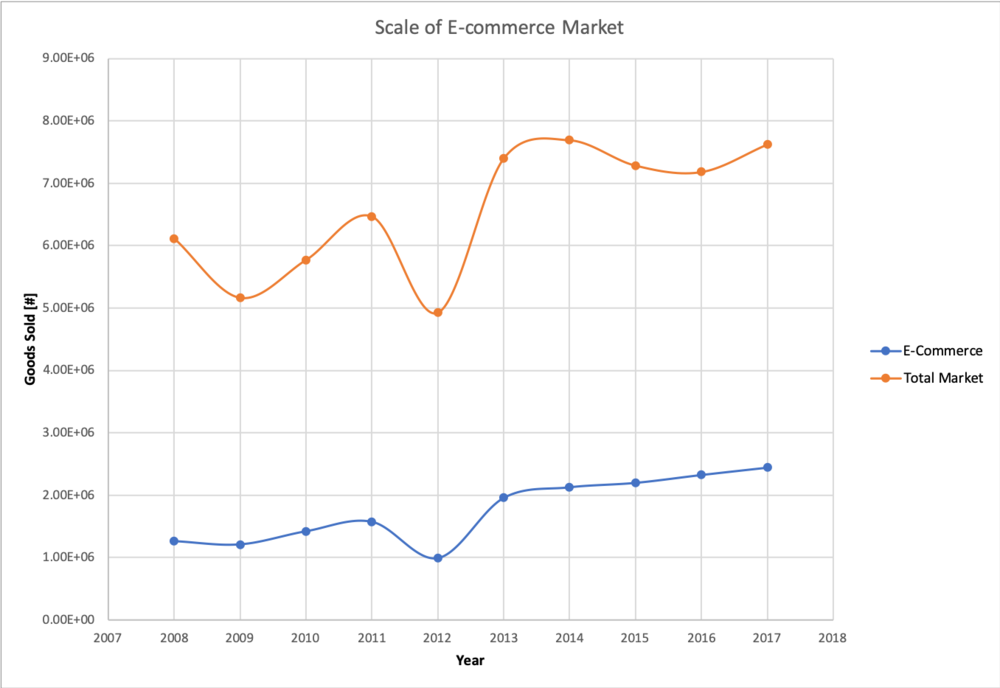
In considering the figure of merit, Scale, we looked at the data reported from the U.S. Census Bureau from the years 2008 - 2017. When comparing the growth in the size of the eCommerce market as a percentage of total commerce it became clear that there is no clear relationship between this percentage change and the growth rate of the major online market places. Amazon has grown at an exponential rate since it's inception if the late 1990s; the explosive growth is not directly tied to the Scale of the U.S. eCommerce market. Scale, although useful in understanding the greater context of the market, does not appear to directly play a role in the success or failure of a given company. This makes intuitive sense, as Scale only represents the market opportunity and provides no insight into how well a certain company could capitalize on that scale.
User Base
In considering the figure of merit, User Base, we fully believe that User Base is one of the most vital aspects of a flourishing online eCommerce marketplace, but data for exact user base numbers is hard to come by. Websites like eBay published there user base metrics for the first few years of their existence but quickly stopped providing those numbers outside the company. We believe the User base is a vital factor in a business's success because almost all aspects of profit an online eCommerce platform can make are directly tied to the number of users leveraging the platform. Growing user base is a key aspect of an eCommerce marketplaces business strategy in its early years, and in many ways operates with a momentum. The momentum would lead the growth rate of users to nominally form an S curve as the early adopters are initially slow to join, but once a critical mass has joined the growth is rapid until a saturation point is reached.
Average Margin
In considering the figure of merit, Average Margin, we have reviewed the current and/or historical margins for eBay, Amazon, Etsy, Upwork (services marketplace), and Mechanical Turk (Amazon procurement marketplace for simple e-commerce tasks). These marketplaces appear to use their margins either in the same way that the ocean container shipping behemoths use their margins, to drive out competition at opportune times (by reducing margins), or to increase revenue in times of scarce competition on a particular sector. In the early days of eBay, the margins were set by founder Pierre Omidyar, often as a way to control the volume on the website (rather than as a revenue-maximizing effort). Omidyar was heavily influenced by considerations of fairness and community input and set easy to understand lower margins. Over time, both eBay and Amazon have developed complex revenue models, with different margins on different product lines, which seem to maximize revenue by understanding the product providers' tolerance levels, price effectively against e-commerce and other purchasing avenues, and in order to increase product availability. Etsy has a similarly complex fee structure, meant to encourage or discourage certain seller behaviors. Further, e-commerce companies use additional cost strategies to prevent phantom listings and other negative actions, encourage referrals, and to generate other advantageous behaviors.
For service marketplaces, including both Upwork and MTurk (Mechanical Turk), the margin is set currently (Fall 2019) at 20% of the value of the service, which seems to balance the need for a robust set of service providers with revenue demands of these businesses. In order to discourage outside the marketplace transactions, Upwork has instituted a margin reducing schedule based on lifetime earnings of Upwork contractors. For example, once certain lifetime revenue thresholds have been met, workers yield less of their earnings to Upwork.
Accordingly, margins are helpful to generally understanding overall market maturity and ongoing competitive dynamics. They are simple measures that can help gauge the robustness and scope of any e-commerce market.
Transaction Speed
In considering the figure of merit of speed, we looked at the transaction speed to conduct trade between New York and California between 1825 and the present. We considered two components to the conduct of trade, the time to connect with the opposite party (either in person or through another communication method) and the time to consummate payment. We considered the fastest forms of communication and payment. For example, we skipped payment by check, as in-person currency transactions and remote Western Union payments eclipsed the speed of checks at early dates. Further, we did not consider service fulfillment times and deliberation times, which may or may not be reduced over time, but are not necessarily related to the development of faster markets.
| Year | Speed (sec) | Translated Time | Description | Citation |
|---|---|---|---|---|
| 1825 | 2.37E+07 | 9 months | Travel by covered wagon back and forth across the United States | https://www.ranker.com/list/cross-country-travel-in-american-history/bailey-benningfield |
| 1850 | 7.88E+06 | 3 months | Travel by sailboat and across the isthmus of Panama | https://www.ranker.com/list/cross-country-travel-in-american-history/bailey-benningfield |
| 1860 | 5.26E+06 | 2 months | Train across the center of the United States | https://www.ranker.com/list/cross-country-travel-in-american-history/bailey-benningfield |
| 1861 | 1.73E+06 | 20 days | The shortlived pony express during the mid-1800's | https://www.history.com/news/10-things-you-may-not-know-about-the-pony-express |
| 1923 | 8.64E+04 | 1 day | Combination of Western Union's teletypewriters and financial services to quicken transactions. At 200 words a minute, we are assuming 500 words for each side of the transaction and financial settlement in one day through a electronic fund transfer (again through Western Union). | https://en.wikipedia.org/wiki/Western_Union; https://en.wikipedia.org/wiki/Teleprinter; https://www.wired.com/2006/02/telegram-passes-into-history/; https://en.wikipedia.org/wiki/Cheque_clearing; https://blog.forte.net/electronic-payments-history/ |
| 1979 | 3.00E+02 | 10 minutes | E-commerce and remote payments introduced | https://visual.ly/community/infographic/technology/evolution-electronic-payments |
| 1996 | 1.80E+02 | 3 minutes | Google checkout launched to streamline online payments | https://visual.ly/community/infographic/technology/evolution-electronic-payments |
| 1999 | 6.00E+01 | 1 minute | Amazon 1-Click begins. Page loading time plus one-click payment. | https://en.wikipedia.org/wiki/1-Click |
| 2019 | 5.00E-01 | 500 milliseconds | In 2019, Google found that a 500 ms slowdown means a 20% decrease in ad revenue. Other companies used milliseconds as the operative time measurement. | https://www.verizondigitalmedia.com/blog/ecommerce-performance-website-speed-impacts-your/; http://economists-pick-research.hktdc.com/business-news/article/Int...cial-for-Successful-E-commerce-Sites/imn/en/1/1X000000/1X0A73N4.htm |
Micro-Level Figures of Merit
We use three micro-level figure of merit categories to drive change, including trust mechanisms, complexity appearance reducing mechanisms, and customer acquisition and retention mechanisms.
Trust Mechanisms (Assurance Processes)
[Marketplace Participants/Hour]
Work (trust mechanisms) = (Total Service Providers + Total Payors) / Hour
Trust mechanisms are divided into three groups (average reviews per service offering, average visibility - number of watchers - per service offering, and average rating per service offering). These can be measured and quantified to determine tipping points to move towards acquisition doubling churn.
Complexity Reduction Mechanisms
[Hours/Contract]
Work (complexity reduction mechanisms) = (Time for Payor to Post Job + Time for Contractor to Find Job + Time to Close Contract) / Contract
Complexity appearance reduction mechanisms include service question forums, simplified formats for posting and searching services, and focusing on services that result in transactions with lower communication costs. Service question metrics include the number of questions (both new and depth of strains) and can be regressed against transaction speed and closure rates. Formats can be tested similar to A/B testing, focusing on formatting decisions that reduce question and answer iterations and improve transaction velocity.
Customer Acquisition and Retention Mechanisms
[Change in Marketplace Participants/Hour]
Work (customer acquisition and retention mechanisms) = (Change in Total Payors + Change in Total Contractors) / Hour
Lowering customer acquisition costs (and reducing churn/multi-homing) through marketing and financial incentives are similar to currently available best practices. Churn is the process of users leaving a marketplace. Multi-homing is the process of users switching constantly between multiple websites, resulting in false positives for marketplace adoption. Here, marketing efforts (both inbound and outbound) can be used and measured regarding their impact on customer acquisition costs and churn/multi-homing. Financial incentives operate in the same way that eBay and Amazon constantly tinker with there product margin rates to either attract sellers or maximize revenue. Similarly, Upwork uses a scaled financial model, encouraging recurrent users to stay on the marketplace (and avoid outside deals) by reducing the margins over time and use. This is similar to accelerators for sales people, though in reverse.
We divide service complexity as follows. Low complexity are tasks that can be understood in a few minutes or less, require no training, and are measurable/scorable as successful or not within less than a minute by humans or computer programs. Mechanical Turk by Amazon focuses on low complexity services. High complexity tasks involve complex projects, such as specifically tailored consulting, legal, or R&D projects, where stakeholder analysis and group ideation and alignment are key success factors. Medium complexity projects are similar or less complex than those currently available on Upwork. They include projects for recurrent problems, where customer-provider alignment could be generated through a few simple interactions either online or via voice/video communications.
Summary of Figures of Merit
| Figure of Merit Type | Title | Equation/Description | Units |
|---|---|---|---|
| Macro | Scale | $ of services transacted online / $ of total services transacted online & offline | % |
| Macro | User Base | # of Total Active Users | Users |
| Macro | Average Margin | Average of Market Fee / Average Total Transaction Value | % |
| Macro | Transaction Speed | Measured as Total Time including Payor Posting Time + Contractor Search Time + Contracting Time | Seconds |
| Micro | Trust Mechanism (Assurance Processes) | Work (trust mechanisms) = (Total Service Providers + Total Payors) / Hour | Marketplace Participants / Hour |
| Micro | Complexity Reduction Mechanisms | Work (complexity reduction mechanisms) = (Time for Payor to Post Job + Time for Contractor to Find Job + Time to Close Contract) / Contract | Hours/Contract |
| Micro | Customer Acquisition and Retention Mechanisms | Work (customer acquisition and retention mechanisms) = (Change in Total Payors + Change in Total Contractors) / Hour | Change in Marketplace Participants / Hour |
Based on the issues with isolating variables, the variety of influences in markets, and dearth of major e-commerce success stories (few successes and many failures), we were not able to directly correlate micro-level decisions with marketplace health or growth. Accordingly, we have not considered the micro-FOMs in terms of tornado charts or competitive comparisons. Rather, we have considered their groupings, as described throughout, and how to stage these relative micro-FOM groups for future tests.
Alignment with Company Strategic Drivers
In preparing this section, we recognized that our technology is an online reverse procurement auction, which is neither a company nor a product. Rather, this is a complex system of systems impacted by a complex variety of factors and understandable only through using many frameworks at different levels of scale. Accordingly, we focused on one aspect of this system, e-commerce companies and the system as a whole. Particularly, we focus on one company to discuss strategic drivers.
This section is written from the perspective of Etsy. Etsy is an online retailer that focuses on the direct sale of specialized, high end products to customers. Common things you might find on Etsy for sale include custom furniture, artistic pieces, and specialized leather goods. The marketplace generally focuses on creating artistic and unique pieces for small customer bases, but has an extremely devout group of users and is very much a niche product market that people come to for a specific reason and with a well developed taste.
| Number | Strategic Drivers | Alignment And Targets | FOMs Impacted |
|---|---|---|---|
| 1 | To increase the amount of active yearly sellers uniformly across the available categories | Etsy will aim to increase the percentage of active yearly sellers by 5% year over year, and focus on attaining sellers of products in under-represented categories | Micro FOMs including Trust Mechanisms and Customer Acquisition and Retention Mechanisms |
| 2 | To increase the amount of yearly active buyers on the platform | For every 1% gain in sellers we will aim to increase the number of active buyers on the platform by 3%. The demand for products should encourage more sellers to come to the platform | Micro FOM Customer Acquisition and Retention Mechanisms |
| 3 | To maintain a consistent year over year growth in revenue | Revenue is not as much of a primary driver as gaining scale is but is key to gaining future investment and increasing internal development efforts on new initiatives. The year over year growth target should exceed the annual total U.S. e-commerce overall growth by 5% | Micro FOM Customer Acquisition and Retention Mechanisms |
Discussion
In considering these strategic drivers against the proposed FOMs, it is interesting to note that the selected micro FOMs focused on customer acquisition and retention are the least impactful of the three micro FOMs. However, many e-commerce companies focus on scale through marketing and incentives, rather than leveraging more powerful efforts of trust mechanisms and complexity reduction mechanisms. The several charts below the relative impact of the three micro-FOMs (pie chart) and the relative impact for inventions by Amazon and eBay (two block charts). Impact is measured as the increase in net sales over the following year by the company implementing the invention. Because this is a complex system of systems problem, with many swirling uncontrolled variables at macro and micro levels, causation cannot be assumed from correlation. However, the logic of this approach provides a starting point for engineering success of online reverse procurement auctions and marketplaces. One external variable, the US GDP growth, was extracted from the impacts from inventions, though many others could have impacted the relationships shown. Particularly, bucketing the FOMs by perceived impact allows for top-level capital contribution decisions and further provides a structure for conducting many small tests of innovations in the three bucketed areas (trust mechanisms, complexity reduction mechanisms, and customer acquisition and retention mechanisms).
Positioning of Company vs. Competition
The above Pie Chart captures the fact that Amazon dominates the online e-commerce market in the United States (Amazon also is a worldwide leader, but sites like Aliexpress and Taobao dominate the Chinese/Asian market). 56% of all e-commerce interactions, as reported by similar web, were via Amazon.com. Amazon is a dominant entity in the space because it has achieved a massive scale, an extremely high user base, and high customer satisfaction and "stickiness." Stickiness is a common phrase used to describe the number of things that bring a user back to a certain online marketplace. In the case of Amazon, these are things like prime shipping, Amazon video, Amazon music, and discounts at related stores like Whole Foods. All of these factors combined to make Amazon an extremely dominant force in e-commerce that is unlikely to waiver over the coming years.
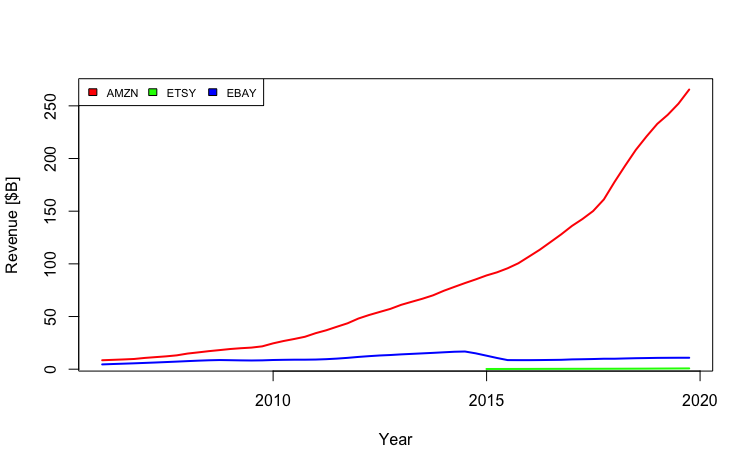
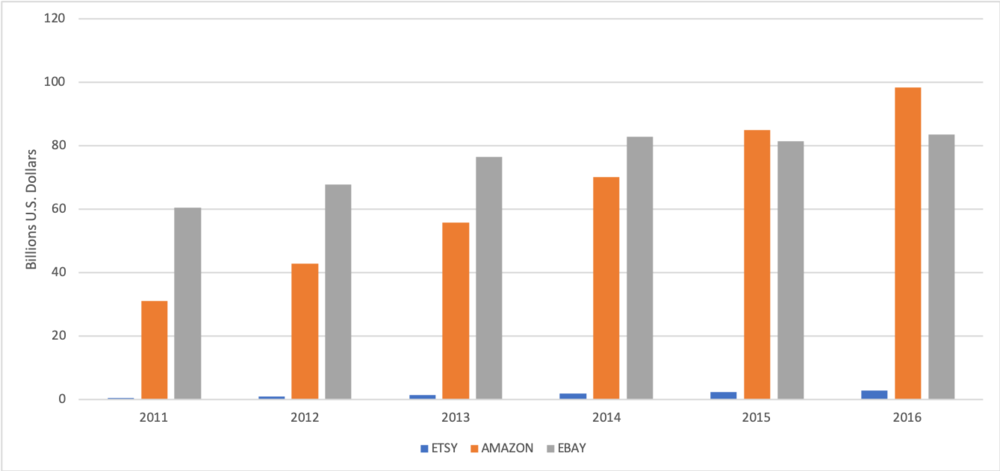
From the perspective of a company like Etsy, which only captures about 3% of the total e-commerce market, there are two views and perspectives to take. Either you take the view that there is very large upside potential still left in the e-commerce space, or that you have missed the opportunity for mass adoption and growth of your e-commerce platform is low so you should, therefore, lean into your niche marketplace. Without an abundance of data it's hard to see with the right approach it, what we can do is illustrate the fluctuating revenues that the smaller market places are seen when compared to that of their large scale competitors. The figure below highlights Etsy, eBay, and Amazon's revenue from their inception.
What is clear from this graph is that Etsy was in no way a disruptor to the dominance of Amazon in the e-commerce marketplace. But this is expected. Etsy did not enter this marketplace with the intent of being the source for everything you would ever need (like Amazon wants to be). Etsy entered into this sector to fill a niche desire that was under-addressed by the larger players in the space.
Technical Model & Financial Model: Macro Level Trends
Challenge:
Because the system at the root of this wiki page is a non-physical complex system of systems, writing a technical model has been challenging. There are not underlying physic equations that govern how these complex e-commerce markets work, but rather a series of frameworks across many different disciplines that explain components of the system of systems at various scales and assuming different boundaries. The approach we have taken to capture and build a model for how the system performs is a couple of different data science methodologies, both regression and classification-based, that leverage large amounts of data on the key companies and the environment in which the companies are operating.
To this end, the major sources of data we were able to collect and use for these underlying models are:
1) Financial Data (From Company Inception)
- Revenue
- Profit
- Margin
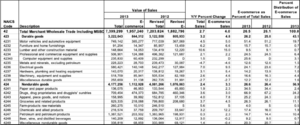
2) Ecommerce vs Conventional Commerce Data (22 different economic Sectors, 2009 - 2017)
- Total Merchant Wholesale Trade Including MSBOs2
- Durable goods
- Motor vehicles and automotive equipment
- Furniture and home furnishings
- Lumber and other construction material
- Professional and commercial equipment and supplies
- Computer equipment and supplies
- Metals and minerals, excluding petroleum
- Electrical goods
- Hardware, plumbing and heating equipment
- Machinery, equipment and supplies
- Miscellaneous durable goods
- Nondurable goods
- Paper and paper products
- Drugs, drug proprietaries and druggists' sundries
- Apparel, piece goods, and notions
- Groceries and related products
- Farm-products raw materials
- Chemicals and allied products
- Petroleum and petroleum products
- Beer, wine, and distilled beverages
- Miscellaneous nondurable goods
Discussion:
Initial approaches to leverage all the above data in a regression model proved impossible, due to all the coupling. Attempts at a CART model also shown little insight into the underlying mechanics of how these complex marketplaces perform. In this stead, we considered micro FOMs, as described above, in light of analysis of inventions of e-commerce companies and their remarks of key drivers of their success. Below we consider the overall growth rates of the US economy and e-commerce sector, as well as the key insights from the country's most robust and sophisticated marketplace, Amazon.
Scale of E-Commerce Market:
Key Factors for User Retention of Amazon:
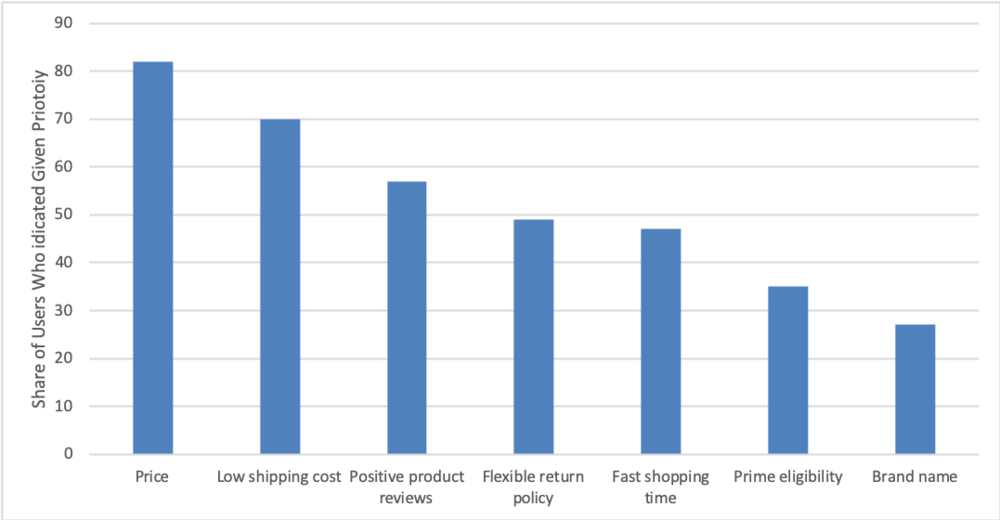
The key factors above provide insight into the factors outside of scale that contribute to user retention of these major platforms. What stand out most is that price is the key consideration that users use to validate their choice in a given marketplace. Other factors having to due with flexibility and ease of use also play a major role in user satisfaction. Using our micro FOM analysis, trust mechanisms include positive product reviews, flexible return policy, and brand name; complexity reduction mechanisms include low shipping cost and fast shopping time; and customer acquisition and retention mechanisms include price and prime eligibility.
Gross Merchandise Volume:
"Gross Merchandise Volume" (alternatively Gross Merchandise Value or GMV) is a term used in online retailing to indicate a total sales dollar value for merchandise sold through a particular marketplace over a certain time frame. Site revenue comes from fees and is different from the dollar value of items sold.[1]
GMV for e-commerce retail companies means sale price charged to the customer multiplied by the number of items sold. For example, if a company sells 10 books at $100, the GMV is $1,000. This is also considered as "gross revenue". In this case, the business model is based on a retail model, where the company basically purchases the items, maintains inventory (if need be) and finally, sells or delivers the items to customers. It does not tell the net sales as GMV does not include costs involved and returns of products." (https://en.wikipedia.org/wiki/Gross_merchandise_volume)
Technical Model & Financial Model: Micro-FOM Data Analysis
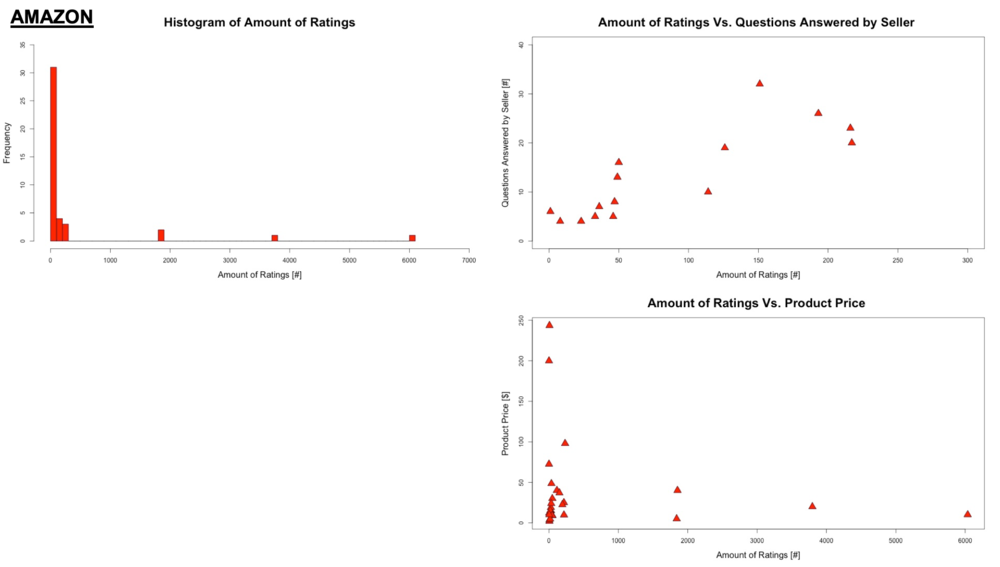
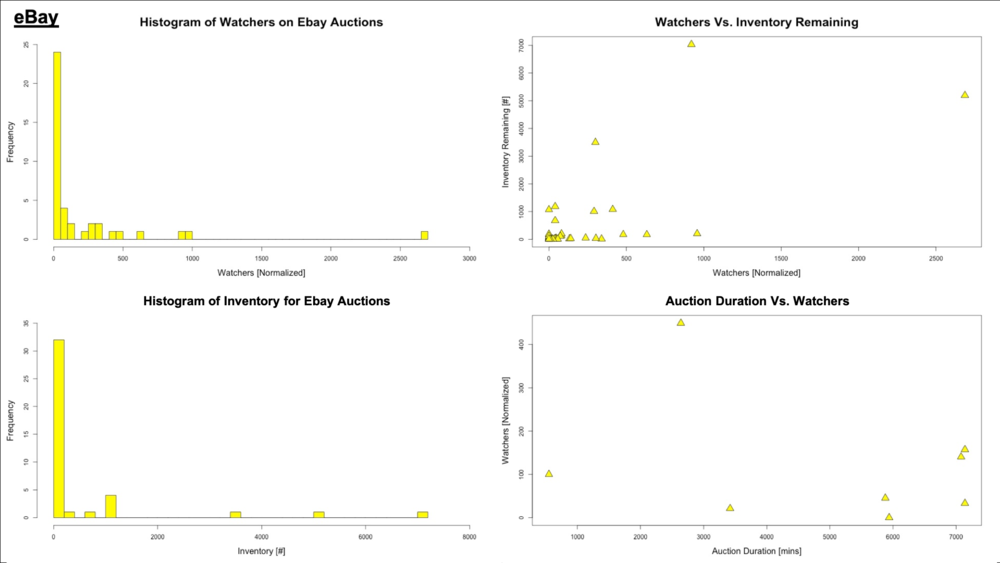
The data used for the generation of all plots in the section was taken via sampling of the data directly from the Amazon.com, Ebay.com, Etsy.com, and mturk.com using a series of both manual and automated web-scrapping processes. All relevant code developed for this effort can be found at Tech RoadMapping Website Scraper
The data for Amazon, Ebay, and Etsy was collected via random sampling of available product listings. The number of data samples for these websites was 75, 50, and 50 respectively. It is important to note that although the websites appear to have a common template for product pages we encountered a significant variety of data reported (or not reported) on each of the product pages. Raw data samples can be found below:
Due to a significantly more robust API, all data for M Turk (which represents all live work currently on the site) could be collected; this resulted in a data with 943 separate observations. This data was also formated extremely consistently, enabling us to build a much better understanding of the underlying trends for the data.
Amazon Data Subset (N = 75):
| Product_Name | Ratings | Questions Answered | Current_Price | Savings | Category |
|---|---|---|---|---|---|
| Vaunn Medical Tool-Free Assembly Spa Bathtub Adjustable Shower Chair Seat Bench with Removable Back | 1,853 ratings | 176 answered questions | $39.99 | [] | Mobility & Daily Living Aids > Bathroom Safety, Aids & Accessories > Bath & Shower Aids > Bath & Shower Safety Seating & Transfer Benches |
| Forge Thin Blue Line Flag Police Pin (Value Pack) | [] | 4 answered questions | $8.99 | [] | Clothing, Shoes & Jewelry > Men > Jewelry > Tie Pins |
| Horseback Riding Gifts Keep Calm Chin Up Heels Down Equestrian Gift Coffee Mug Tea Cup Pink | 30 ratings | [] | $14.99 | [] | Home & Kitchen > Kitchen & Dining > Dining & Entertaining > Novelty > Drinkware > Coffee Mugs |
| Shawn Mendes - Treat You Better - Sheet Music Single | [] | [] | $9.99 | [] | Musical Instruments > Instrument Accessories > General Accessories |
eBay Data Subset (N = 50):
| Item Description | Sale/Auction Duration (Mins) | Inventory (1 = Y/0 = N) | Inventory (Approx. #) | Watchers | Watchers (Normalized) | Questions for Seller/Provider (1 = Y/0 = N) | Questions for Seller/Provider (#) |
|---|---|---|---|---|---|---|---|
| Boat | 7140 | 0 | NA | 157 | 157 | N/A | 0 |
| Car | 2640 | 0 | NA | 449 | 449 | N/A | 0 |
Etsy Data Subset (N = 50):
| Product | Price | Ratings | Score | Response_Rate |
|---|---|---|---|---|
| Sterling Silver or Gold Filled Stackable Ring, Dainty Adjustable Ring, Thin Gold Spiral Ring, Minimalist Ring, Textured Ring. | $10.84+ | 1,844 | 5 out of 5 stars | This seller usually responds within 24 hours. |
| Personalized Wearable Magnetic Name Tags. Your Logo and Names. Get a Spare for 3.99. | $7.99+ | 1,159 | 5 out of 5 stars | [] |
| Yoga Running Headband - Wild Abandon Print - Workout Headband - Fitness Wide Nonslip Headband | $7.00 | 12,338 | 5 out of 5 stars | This seller usually responds within 24 hours. |
| Custom Baby Name Baby Blocks Nursery Baby Shower Gift | $3.40+ | 2,525 | 5 out of 5 stars | This seller usually responds within a few hours. |
Mechanical Turk Data Subset (N = 943):
| Requestors | Titles | HITs | Reward | Created |
|---|---|---|---|---|
| Alexander Elias | What type of instagram account is this? | 46,048 | $0.03 | 11/18/19 11:23 |
| Computer Vision Turk | [NEW BATCH] Trace Object Boundaries | 17,742 | $0.60 | 11/15/19 14:23 |
| Computer Vision Turk | Verify All Instances of Object Have Boundaries | 17,164 | $0.15 | 11/17/19 14:23 |
| Eric Meisel | Find Organization Data Based on Organization Name | 10,344 | $0.01 | 11/15/19 14:23 |
Discussion:
Much of the data sought to analyze the micro-FOMs is not readily apparent from the companies or their public facing websites, as market tests are either not clear or are not distinguishable from the many tests the sites are continuously running. A major takeaway from this analysis is that the technology roadmapping frameworks at first glance do not appear to apply well to this type of system of systems technology. However, at closer look, the frameworks are extremely helpful in capital allocation and project definition efforts. For instance, as stated above, several reverse procurement marketplaces seem to simply use brute force efforts to impact market scale and growth. The technology roadmapping frameworks provide a solid foundation from which to conduct tests, by dividing projects into three categories - trust mechanisms, complexity reduction mechanisms, and customer acquisition and retention mechanisms. Based to the data above, which is imperfect due to the complexity of the systems and their boundary environments, the priorities (based on relative impacts) should be (1) trust mechanisms, (2) complexity reduction mechanisms, and (3) customer retention and acquisition mechanisms. However, it is worth noting that these process types roughly track the typical chronological development of marketplaces - establish trust, simplify transactions, and acquire and retain customers. Regardless, these three micro FOM buckets provide a means to analyze projects and allocated capital effectively. Further, with online platforms, projects and tests can be conducted quickly and at lower costs, permitting the development of data for each micro FOM and sub-ordinate drivers.
Key Publications, Presentations and Patents
A. Patents
Information about patents is set forth below. Unlike in the section concerning literature review, in an abundance of caution, we stayed close to the abstract definitions in describing these technologies. We also felt that these abstracts provided the best explanation of the patented technology. As shown below, eBay was a forerunner in developing technology and processes that undergird e-commerce today.
Name: Information presentation and management in an online trading environment
Patent #: 6058417
Inventors: Hess; Martin L. (Aptos, CA), Wilson; Michael K. (Los Gatos, CA)
Assignee: eBay Inc. (San Jose, CA)
Date: May 2, 2000
Abstract: A method and apparatus for information presentation and management in an online trading environment are provided. According to one aspect of the present invention, person-to-person commerce over the Internet is facilitated by providing prospective buyers the ability to quickly preview items for sale. Images are harvested from a plurality of sites based upon user-supplied information. The user-supplied information includes descriptions of items for sale and locations from which images that are to be associated with the items can be retrieved. Thumbnail images are created corresponding to the harvested images and are aggregated onto a web page for presentation at a remote site. According to another aspect of the present invention, a user may submit a query to preview items for sale. After receiving the query, thumbnail images corresponding to items that satisfy the user query are displayed, each of the thumbnail images previously having been created based upon a user-specified image.
Name: Method and apparatus for verifying the identity of a participant within an online auction environment
Patent #: 6466917
Inventors: Goyal; Anoop (East Palo Alto, CA), Poon; Alex D. (Los Altos Hills, CA), Wen; Wen (Cupertino, CA)
Assignee: eBay Inc. (San Jose, CA)
Date: October 15, 2002
Abstract: A method and apparatus for verifying identity of a participant in a network-based transaction facility are described. According to one embodiment, user interface information is provided to the participant via a communications network. The user interface information specifies an identity verification interface for obtaining personal information of the participant. The personal information of the participant is passed to a third party for verification via the communications network. Subsequently, a verification result is received from the third party via the communications network. The verification result is then communicated to the participant via the communications network.
Name: Generic attribute database system for storing items of different categories having shared attributes
Patent #: 6604107
Inventors: Wang; Hsiaozhang Bill (San Jose, CA)
Assignee: eBay Inc. (San Jose, CA)
Date: August 5, 2003
Abstract: Embodiments of the invention provide a method and apparatus for storing multiple items across different categories in a database. One embodiment of the present invention provides a database that includes an attribute value table that has item entries for items of different categories. Each item entry has attribute values for attributes of the items. The database also includes an attribute map table that has attribute map entries. The attribute map entries have attribute map values. Additionally, an attribute value is associated with an attribute map entry, such that the attribute values are translated based on the attribute map values of the associated attribute map entry. In one embodiment, the translating of an attribute value includes determining an attribute type associated with the attribute value.
Name: Method and system for supplying automatic status updates using electronic mail
Patent #: 7139726
Inventors: Fisher; Alan S. (Fremont, CA), Kaplan; Samuel Jerrold (Hillsborough, CA)
Assignee: eBay Inc. (San Jose, CA)
Date: November 21, 2006
Abstract: A system is disclosed for automatically updating the status of customers’ orders and shipments via electronic mail without using a human attendant to create and send the electronic mail messages. Preferably implemented in software, the updating system allows a large set of customers to be periodically updated over a computer or communications network via electronic mail. The system includes a database for maintaining order and shipping status and other relevant information.
Name: Generic attribute database system
Patent #: 6778993
Inventors: Wang; Hsiaozhang Bill (San Jose, CA)
Assignee: eBay Inc. (San Jose, CA)
Date: August 17, 2004
Abstract: Embodiments of the invention provide a method and apparatus for storing multiple items across different categories in a database. One embodiment of the present invention provides a database that includes an attribute value table that has item entries for items of different categories. Each item entry has attribute values for attributes of the items. The database also includes an attribute map table that has attribute map entries. The attribute map entries have attribute map values. Additionally, an attribute value is associated with an attribute map entry, such that the attribute values are translated based on the attribute map values of the associated attribute map entry. In one embodiment, the translating of an attribute value includes determining an attribute type associated with the attribute value.
B. Literature Review
We considered a variety of articles, beyond those listed below, and focused our discussion on five important articles, which include early analysis of e-commerce and online auctions and more recent consideration of online procurement marketplaces.
In considering the evolution of e-commerce, we started with MIT graduate David Lucking-Reiley’s early work on electronic auctions and e-commerce in general, reviewing three articles (David Lucking-Reiley, 2000; David Lucking-Reiley & Daniel F. Spulber, 2001; Lucking-Reiley, 2000).
David Lucking-Reiley considered internet auctions in “Auctions on the Internet: What’s Being Auctioned, and How?” (Lucking-Reiley, 2000). Lucking-Reiley canvassed the history of internet auctions dating back to the mid-1990’s, which were often completed with meager technological support (Lucking-Reiley, 2000). The paper went on to describe the composition of popular internet auctions in terms of volume, velocity, products, business models, and auction formats (Lucking-Reiley, 2000).
Also in 2000, Lucking-Reiley provided more detail on auction theory as applied to e-commerce (David Lucking-Reiley, 2000). Vickrey auctions, achieving true value bids through second price auctions, and their precursors were explained in detail (David Lucking-Reiley, 2000). This paper provided an in depth historical treatment of commerce in general, from the lens of auction development over time (David Lucking-Reiley, 2000).
In “Business-to-Business Electronic Commerce,” Lucking-Reiley and Daniel F. Spulber provide an early analysis of the potential of e-commerce (David Lucking-Reiley & Daniel F. Spulber, 2001). They promote the vast potential, now realized, of electronic transactions, and detail the cost efficiencies from automated transactions, the benefits of market making including reduced search costs and other marketplace advantages, expected consolidation of marketplace due to returns to scale, and organizational design impacts (David Lucking-Reiley & Daniel F. Spulber, 2001).
Next, we reviewed more recent articles concerning the gig economy and the presence of procurement marketplaces on the internet (Ljungh, 2019; Mortleman, 2018; Popiel, 2017).
In “Are the Workers in the On-Demand Economy Employees, Independent Contractors, or a Hybrid Category?”, Doina Ljungholm tackles a critical question and potential limitation in the growth of online procurement auctions and marketplaces, namely, the legal reality of online workers (Ljungh, 2019). Ljungholm details primary considerations and concerns of the on-demand workers that fuel portions of the e-commerce world (Ljungh, 2019). Notably, many of the considerations, both from the business and worker perspectives gather around variability and flexibility, for both sides (Ljungh, 2019).
In “Gig for Victory,” Jim Mortleman describes the increasing need for on-demand “gig” workers and the reality that higher order jobs are now being worked by ad hoc contractors (Mortleman, 2018). One outstanding question, whether highly variable service quality is an initial learning curve or a permanent state of a distributed marketplace, is considered in some detail (Mortleman, 2018). Mortleman makes several interesting points concerning frustrations with the corporate world and new offerings such as “teams-as-a-service (TaaS)” to conclude the piece (Mortleman, 2018).
Finally, we identified one article reviewing whether the platform economy is sustainable (Culkin, 2019).
Culkin, B. (2019). Is Platform Capitalism Sustainable? Digital Business Models, On-Demand Labor, and Economic Growth. Journal of Self-Governance & Management Economics, 7(1), 31–36. https://doi.org/10.22381/JSME7120195
David Lucking-Reiley. (2000). Vickrey Auctions in Practice: From Nineteenth-Century Philately to Twenty-First-Century E-Commerce. The Journal of Economic Perspectives, (3), 183.
David Lucking-Reiley, & Daniel F. Spulber. (2001). Business-to-Business Electronic Commerce. The Journal of Economic Perspectives, (1), 55.
Ljungh, D. P. (2019). Are the Workers in the on-Demand Economy Employees, Independent Contractors, or a Hybrid Category? Linguistic & Philosophical Investigations, 18, 119–125. https://doi.org/10.22381/LPI1820197
Lucking-Reiley, D. (2000). Auctions on the Internet: What’s Being Auctioned, and How? Journal of Industrial Economics, 48(3), 227.
Mortleman, J. (2018). Gig for Victory. Computer Weekly, 28–31.
Popiel, P. (2017). “Boundaryless” in the creative economy: Assessing freelancing on Upwork. Critical Studies in Media Communication, 34(3), 220–233. https://doi.org/10.1080/15295036.2017.1282618
List of R&T Projects and Prototypes (R&D Portfolio)
In developing the list of projects and their relative projected impacts we focused on high yield and foundational projects (trust mechanisms, then complexity reduction mechanisms), while also allocating money towards customer retention and acquisition efforts. Our three bucket framework and the ability to rapidly test through online platforms undergird our approach to R&D and R&T based on our analysis.
| Number | Title | Description | Focus | Budget Allocation |
|---|---|---|---|---|
| 1 | Influencer Marketing | Through a combination of affiliate links via popular podcasts and a targeted set of Instagram and TikTok influencers will we aim to increase our engagement with the 18 - 25 year old demographic by 20% | Lowering Customer Acquisition Costs | 5% |
| 2 | Internet Marketing | We will leverage Facebook, Instagram, and google ad networks to target ads at the 25 to 35-year-old demographic. The intent is to increase our engagement with this segment by 10% | Lowering Customer Acquisition Costs | 5% |
| 3 | Traditional Media Marketing | TV ads and Billboards in select markets will be purchased with an aim of increasing our engagement with the 35+ year old demographic by 5%. | Lowering Customer Acquisition Costs | 5% |
| 4 | User Data Collection Visualization | A series of automated dashboards will be developed to visualize all data collected on an individual user. Plots will include data about success purchases and/ or sales over time along with Average purchase price and average sale price. Included in this activity will be a series of surveys designed on understanding the kind of data our users would like to see in this new dashboard. | Complexity Appearance Reduction | 15% |
| 5 | User Data Export and Deletion | This project will add a means of users exporting their data via a SQL database or as a raw CSV file. Along with exporting data we will provide users the ability too fully delete all data about themselves from our servers. These efforts together should provide users with an improvement in satisfaction with our platform and through polling our users we aim to increase satisfaction by 15%. | Increasing Trust | 20% |
| 6 | Material Design UI Refresh | This effort will embrace Google's Material design ethos which focuses on simple and clean U.I. that will result in a reduction in website appearance complexity and increased user understanding of how to navigate. We will gage success of this project via control testing of our existing UI with new users and comparing collected data against the same test with our new UI design in place. We will end this project in the Beta version our new UI does not perform at least 15% better when compared to our current design. | Complexity Appearance Reduction | 30% |
| 7 | Validation and Automated Flagging of Malicious Actors | This project will focuses on building out predictive models on whether user activity indicates malicious intent. User terms of service must be updated to enable us to leverage user data to train our machine learning algorithms, and testing sets for our algorithms will be developed via contracting with outside white-hat hacker groups to test our automated systems effectiveness. | Increasing Trust | 20 % |
Technology Strategy Statement
In developing our roadmap, several recurrent issues present difficulties. First, from a data standpoint, we can identify the type of data needed, but would need to self-develop this data. This would be an expansive undertaking and likely performable only by the owner of the marketplace. Second, for a system of systems problem, we cannot isolate variables to determine impact. For example, we can see major efforts to influence micro-level FOMs by eBay or Amazon during a calendar year, but those impacts are drowned by many other macro level trends and activities, such as overall e-commerce growth, competitor actions, etc. In light of the limitations of the technology roadmap model, we are focused on developing intuition and a general feel for magnitudes and directions of variables based on modeling individual marketplaces, as well as identifying the data acquisition necessary to develop a comprehensive roadmap for future reverse procurement marketplaces and auctions.
Our target is to develop a multi-purpose reverse online procurement auction, focused on services of medium complexity, which would be broadly generalizable across different medium complexity service segments. To achieve a target monthly adoption level (change in number of total participants per month) of twice the churn rate for the marketplace every month for a period of 18 months straight (both sides), we focus on enhancing trust mechanisms, efforts to reduce apparent complexity (through API's similar to Mechanical Turk), and lowering customer acquisition costs (and reducing churn/multi-homing) through marketing and financial incentives. Our strategy is to make use of these three categories and to perform many micro-projects and tests to quantify impacts from the three micro FOM groups and sub-ordinate drivers within each group. The first batch of projects provides a good start in this regard.
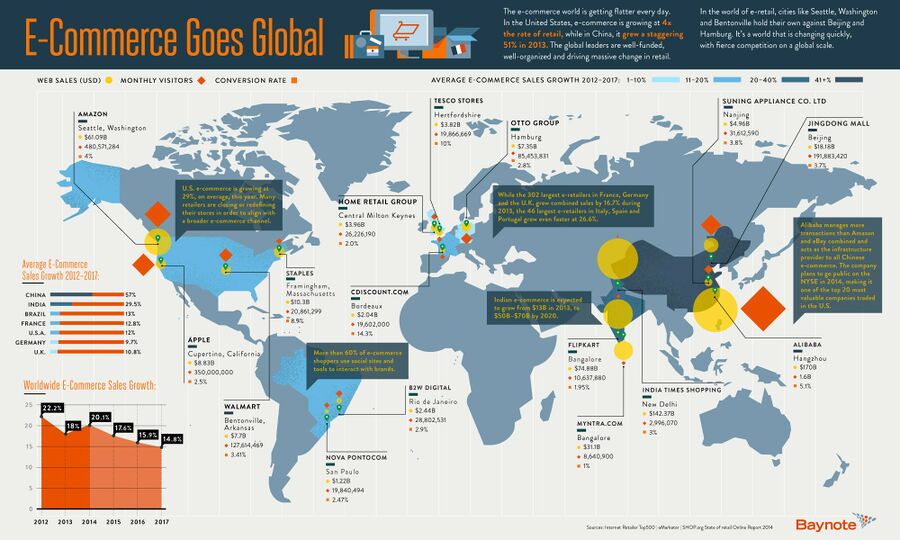
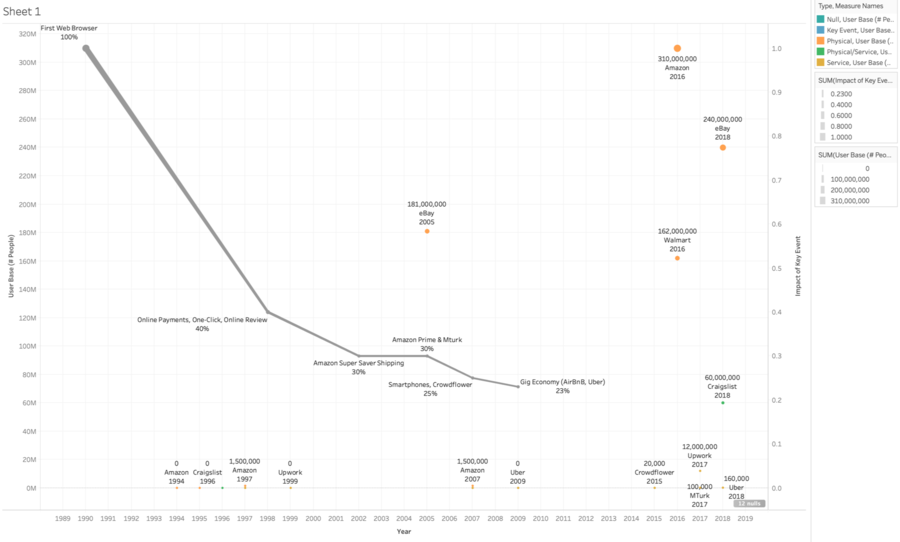
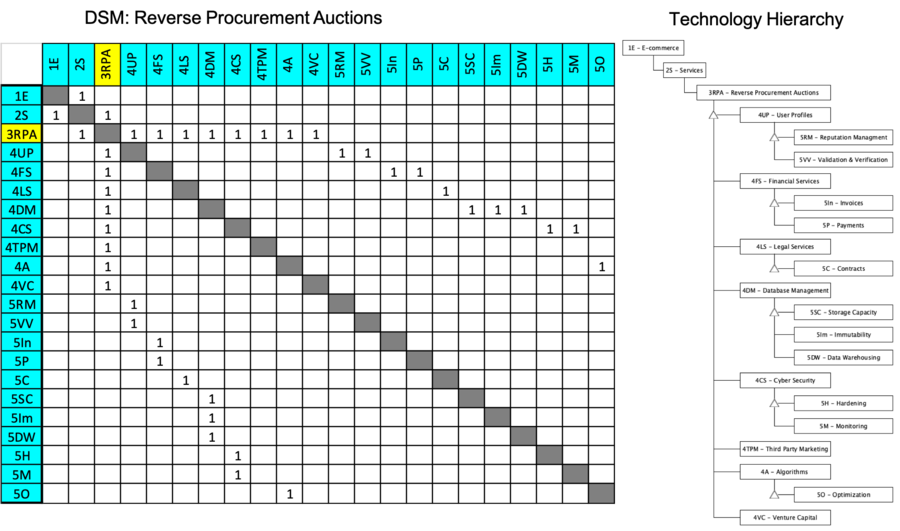
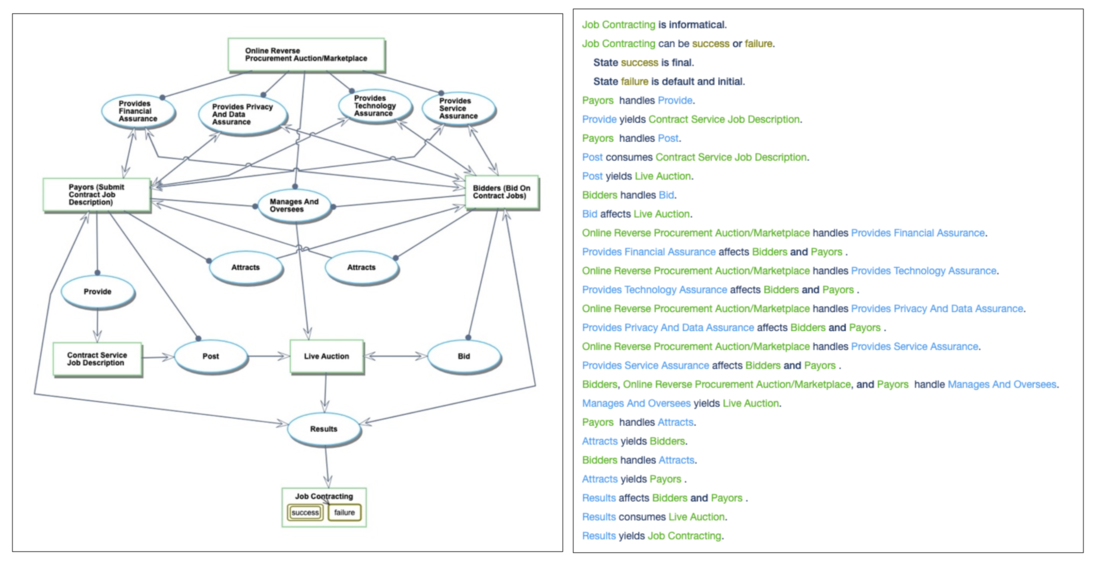
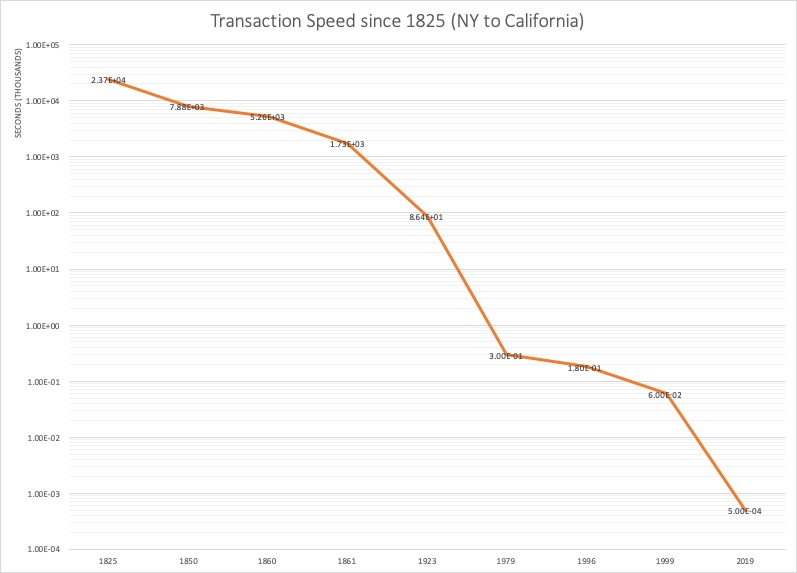
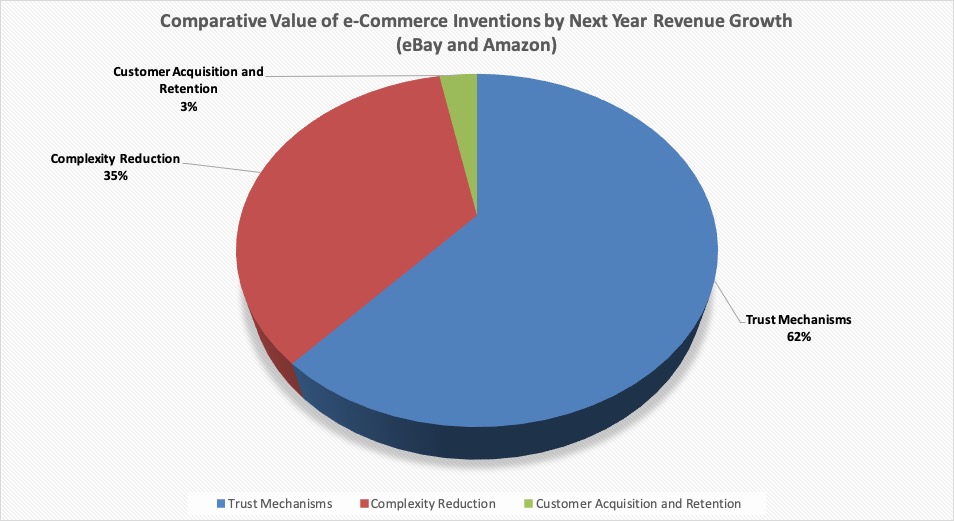
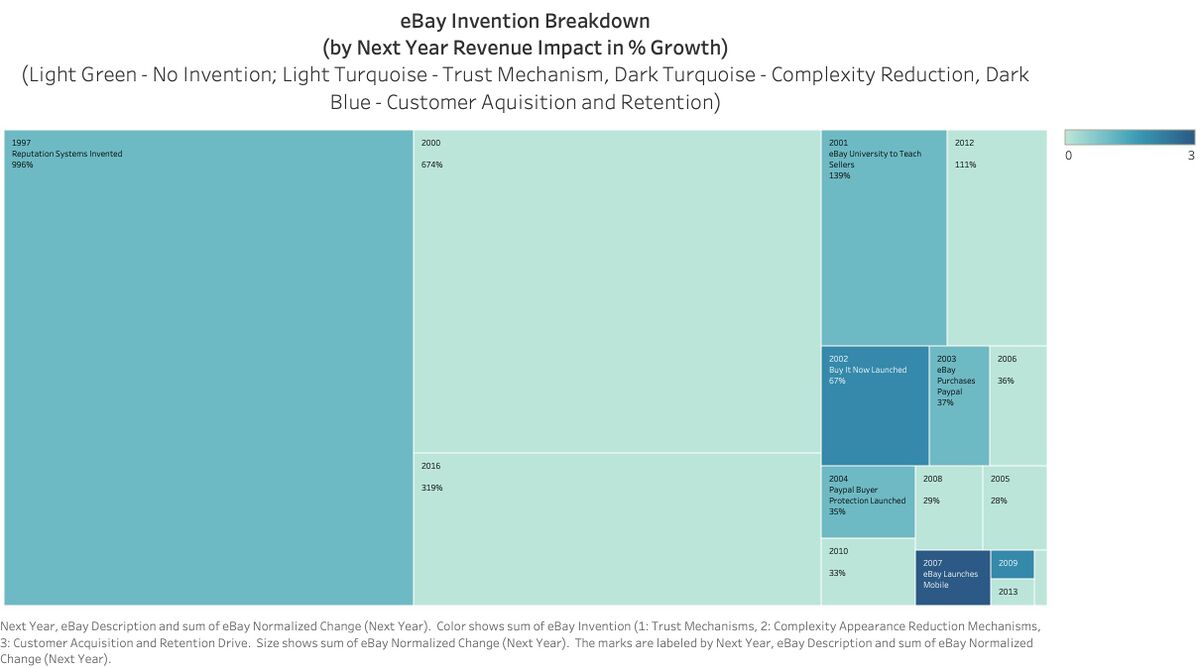
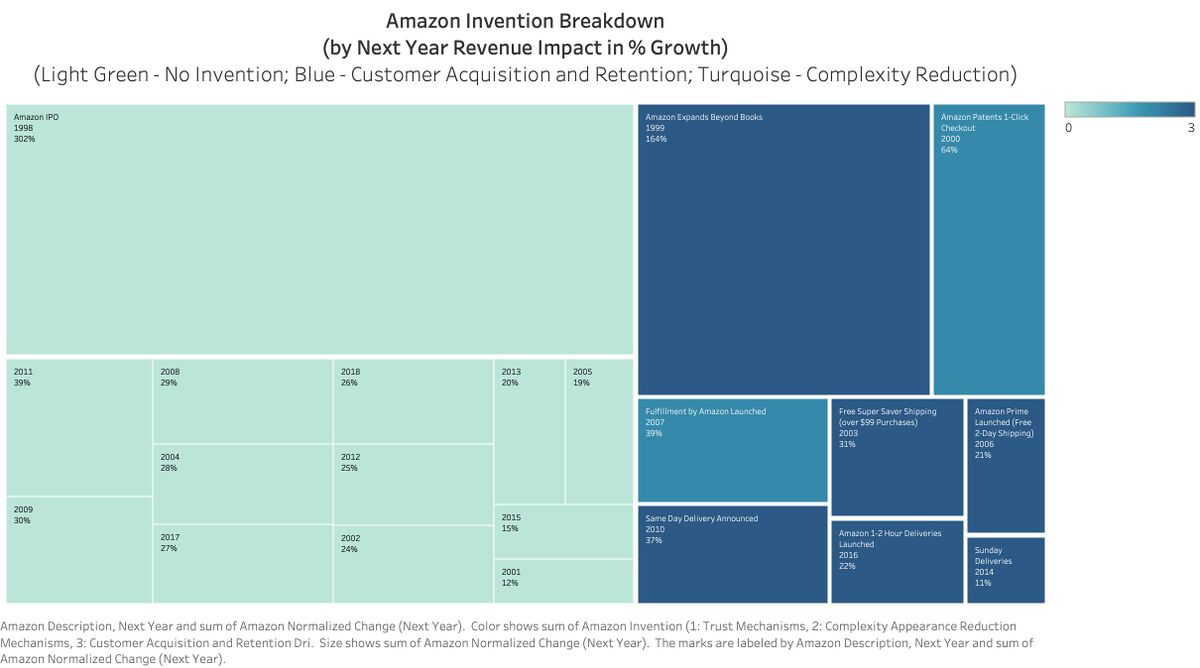
![Source: SimilarWeb]](/images/thumb/d/d2/CompetitionMarketShare.png/1000px-CompetitionMarketShare.png)
