Difference between revisions of "Retail Payment system"
(Created page with "=Technology Roadmap= ==Roadmap Overview== The U.S. financial system processes millions of transactions each day to facilitate purchases and payments. In general terms, a pay...") |
|||
| (327 intermediate revisions by 4 users not shown) | |||
| Line 5: | Line 5: | ||
The U.S. financial system processes millions of transactions each day to facilitate purchases and payments. In general terms, a payment system consists of the means for transferring money between suppliers and users of funds through the use of cash substitutes, such as checks, drafts, and electronic funds transfers. | The U.S. financial system processes millions of transactions each day to facilitate purchases and payments. In general terms, a payment system consists of the means for transferring money between suppliers and users of funds through the use of cash substitutes, such as checks, drafts, and electronic funds transfers. | ||
A payment system is a system | A payment system is a system that exchanges / trades value by changing the ownership of money. It consists of a set of instruments, banking procedures, and, typically, interbank funds transfer systems that ensure the circulation of money. These systems allow for the processing and completion of financial transactions. | ||
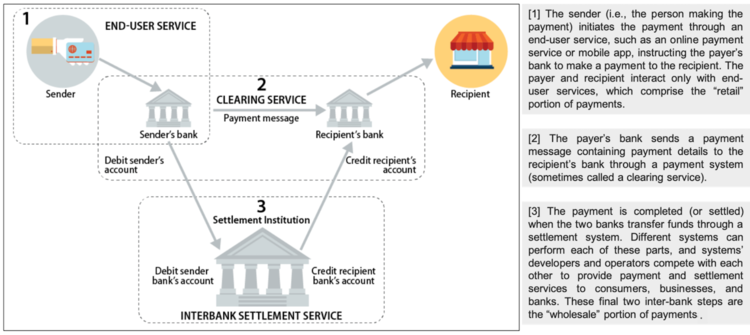
From the typical consumer’s perspective, making a payment is simple. A person swipes a card, clicks a button, or taps a mobile device and the payment is approved within seconds. However, the infrastructure and technology underlying the payment systems are substantial and complex. To simplify, a payment system has three parts (see Figure below). | From the typical consumer’s perspective, making a payment is simple. A person swipes a card, clicks a button, or taps a mobile device and the payment is approved within seconds. However, the infrastructure and technology underlying the payment systems are substantial and complex. To simplify, a payment system has three parts (see Figure below). | ||
[[File:US | [[File:US Payments v2.png|750px|frameless|center|Parts of the US Payment System as per the US Federal Reserve (https://fas.org/sgp/crs/misc/R45927.pdf]] | ||
''*image-source - U.S. Payment System Policy Issues: Faster Payments and Innovation, Congressional Research Service (2019)'' | |||
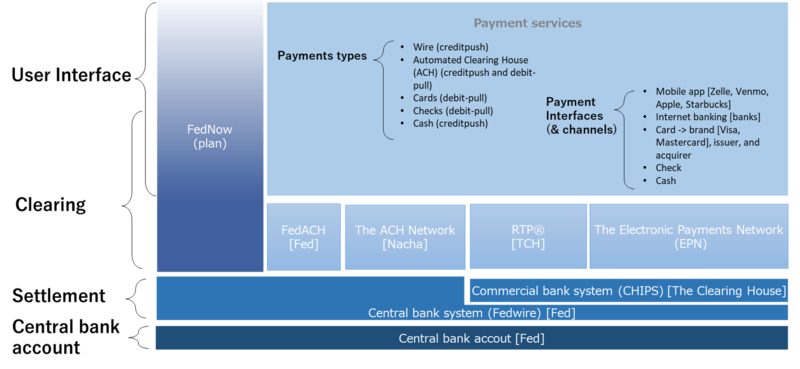
Based on our research, an overview of the US retail payment system can be seen in the following figure. The settlement is needed for finalizing money transfer using the central bank's accounts. The clearing service works by sending the payment message and offset the payments which are the reverse and the same amount. Most retail payments rely on these clearing and settlement. | |||
[[File:Payment system_layer2.png|thumb|800px|center]] | |||
==Design Structure Matrix (DSM) Allocation== | ==Design Structure Matrix (DSM) Allocation== | ||
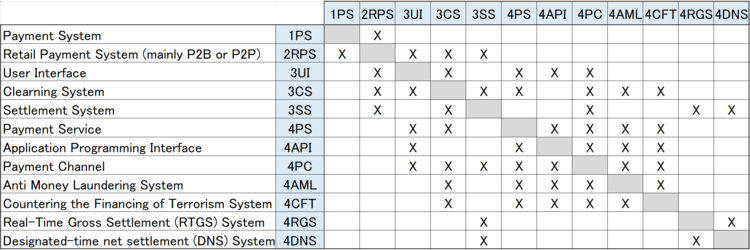
[[File:DSM| | The design structure matrix for the Retail Payment System is depicted in the image below. | ||
[[File:Payment system_DSM.png|frameless|center|750px|Payment System DSM]] | |||
The following figure shows the tree structure of the Retail Payment System. Our roadmap focuses not on the wholesale payment system, but on the retail payment system. | |||
The API is optional and it is not included in all payment systems. | |||
[[File:Payment system_tree.png|frameless|center|500px|Payment System tree]] | |||
==Object Process Model (OPM)== | ==Object Process Model (OPM)== | ||
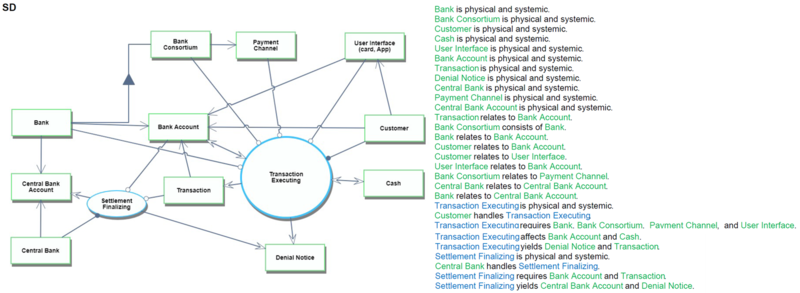
The OPM | The following picture shows the '''whole OPM for the retail payment system'''. These OPM diagrams in the picture are designed referring to the example of Appendix A in the book "Object-Process Methodology A Holistic Systems Paradigm" written by Dov Dori. | ||
[[File: | [[File:Payment System_OPM_WH.png|frame|center]] | ||
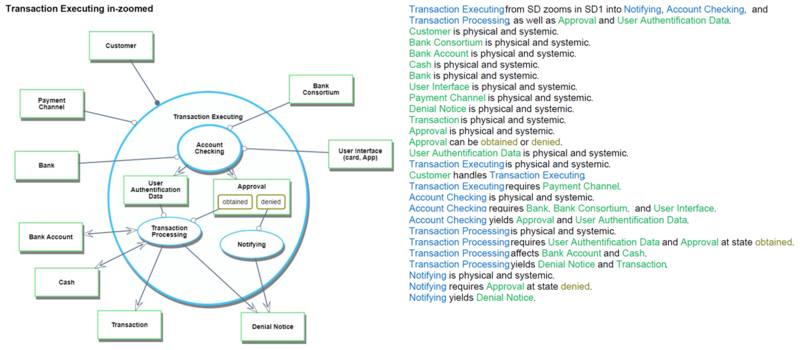
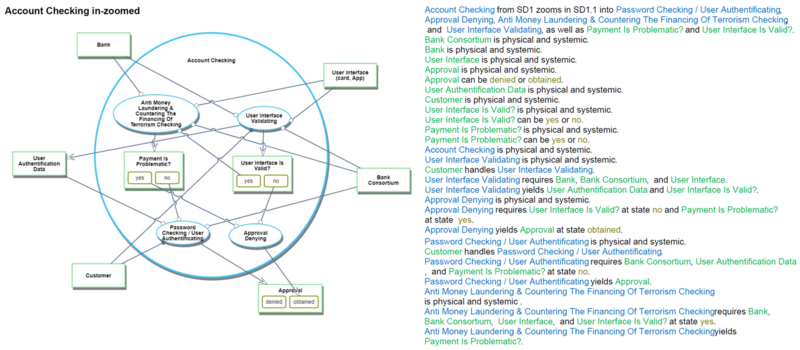
The following diagrams show each OPM for the retail payment system. | |||
[[File:Payment System_OPM_SD.png|800px|frameless|center]] | |||
[[File:Payment System_OPM_TE.png|800px|frameless|center]] | |||
[[File:Payment System_OPM_A.png|800px|frameless|center]] | |||
==Figures of Merit (FOM)== | ==Figures of Merit (FOM)== | ||
The table below show a list of FOMs by which | The table below show a list of FOMs by which can assess a Payment System: | ||
{| class="wikitable" | {| class="wikitable" | ||
|- | |- | ||
! | ! Class !! Figure of Merit !! Units !! Metric | ||
|- | |- | ||
| | | Performance | ||
| Value of transactions processed per annum | | Value of transactions processed per annum | ||
| US$ | | [US$] | ||
| Monetary value of all transactions processed per annum. | |||
|- | |- | ||
| | | rowspan="2" | Productivity | ||
| Number of transactions processed per annum | | Number of transactions processed per annum | ||
| # | | # of transactions processed per country, per individual or business client type | ||
| Count of the number of transactions processed per annum. | |||
|- | |||
| Machine learning accuracy | |||
| Weighted False Positive ratio | |||
| <math>\sum_{i=1}^{Systems} Weight_i \frac{FalsePositives_i}{(FalsePositives_i + TrueNegatives_i)} </math> | |||
|- | |- | ||
| rowspan="2" | Efficiency | | rowspan="2" | Efficiency | ||
| Average cost per transaction | | Average cost per transaction | ||
| US cents | | [US cents] | ||
| The total Earnings Before Interest and Tax (Tax) divided by the Number of transactions processed per annum | |||
|- | |- | ||
| Transaction settlement period | | '''Transaction settlement period''' | ||
| Seconds | | '''[Seconds]''' | ||
| The time lag between the payment initiation of the payment order and its final settlement. | |||
|- | |- | ||
| rowspan=" | | rowspan="3" | Sustainability | ||
| System downtime per year | | System downtime per year | ||
| Seconds | | [Seconds] | ||
| The seconds in a year is that the system is not online and processing successfully, i.e., not “up and running”. | |||
|- | |- | ||
| Payment conversion rate | | Payment conversion rate | ||
| % | | [%] | ||
| # of settled transactions per annum / # of attempted transactions per annum | |||
|- | |||
| Fraud prevention | |||
| [%] | |||
| # of fraudulent transactions / # approved transactions | |||
|} | |||
==== Examples of FOM performance ==== | |||
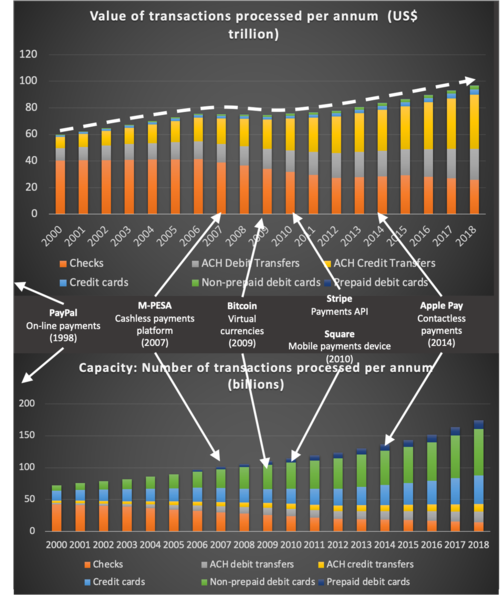
[[File:FOMimprovement v1.png|500px|frameless|center|History of Value of Transactions and Number of Transactions Figures of Merit]] | |||
==Company Strategic Objectives== | |||
We identified strategic objectives that can stand the test of time. We want our clients to understand that we are constant, unchanging, something they can depend on. As technology improves, we can change the respective FOM and targets, without changing our strategic objectives. The table below shows our strategic objectives: | |||
{| class="wikitable" | |||
|- | |||
! Strategic Objective !! Alignment and Targets | |||
|- | |||
| '''An efficient payment system that processes and settles transactions in near real-time.''' | |||
| '''Currently we have a transaction settlement period of 1 day and aim to decrease this to 90 seconds.''' | |||
|- | |||
| Our clients trust us to process their transactions in a safe and secure manner where they do not lose money. | |||
| We aim to maintain System downtime per year to less than 480s (i.e. 8 hours). In the next year we will improve our fraud prevention ratio (by at least 0.5%) and machine learning accuracy (by at least 5%) whilst maintaining or decreasing our cost base. | |||
|- | |||
| Our clients can make payments to anyone, anywhere. | |||
| We continue to grow the number of payments we process pa to more than 1bn, servicing more than 750k individual and 10k business clients in 76 countries. Our goal is to process 1% of all payments made as reported by the Bank of International Settlements. | |||
|} | |||
==Positioning of Company vs. Competition== | |||
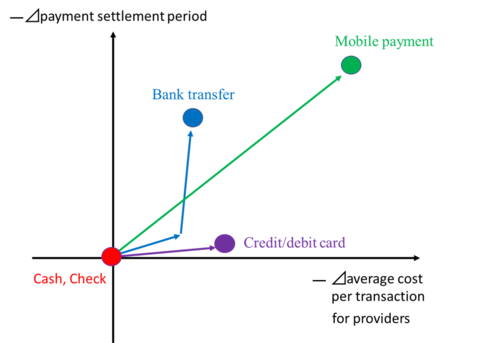
First, the following vector chart shows the competitive situation among different types of payment. The mobile payment has improved both the average cost per transaction and the payment settlement period. When it comes to a bank transfer, it gradually improved productivity, but recently banks offered RTP network, a faster clearing system in the US, so it has shortened the payment settlement period. Credit/ debit card has improved average cost per transaction by raising the precision of fraud detection. | |||
[[File:Payment system_vector chart 1r4.png|thumb|500px|center]] | |||
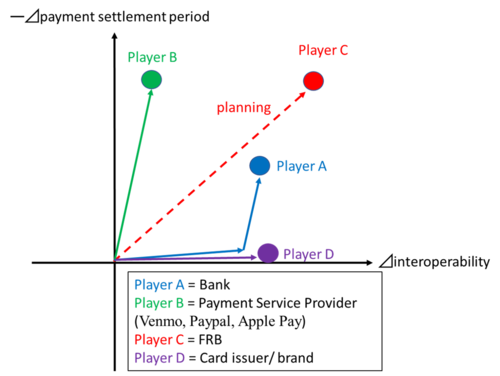
Second, the following vector chart shows the competitive situation among different companies of payment services. Here, we compare the payment settlement period and interoperability. Interoperability is related to cost because it takes money and time to get the system interoperable with other systems or services. Player C announced that it would offer a real-time payment system for everyone, including small commercial banks that are sometimes difficult to access the interbank system because of the cost level. Player A launched a faster clearing system to compete with it. Player B offers faster payment services without interoperability with other payments. Player C has extended the acceptance of merchants where users can use their payment. | |||
[[File:Payment system vector chart 2r.png|thumb|500px|center]] | |||
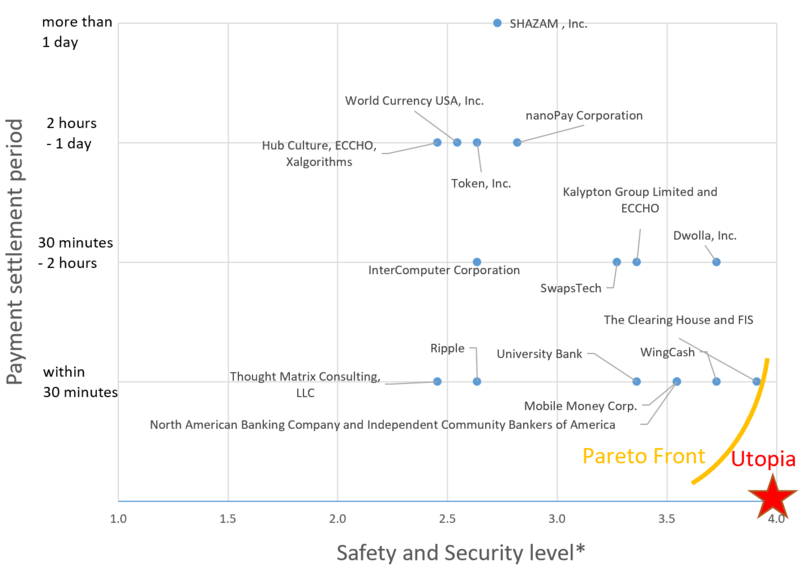
The following figure shows the trade space of the proposals for FedNow. In 2016, the Faster Payments Task Force asked for proposals of FedNow, and more than 30 companies offered the proposals. The figure shows 16 open cases of them. Due to data limitation, we used “Safety and Security level*” as the alternative for the FOM of Safety & Security, Sustainability ratio. | |||
[[File:Payment system_pareto.png|thumb|800px|center]] | |||
''* We calculated “Safety and Security level” as the average level of assessment results for the following assessment criteria.'' | |||
''Assessment criteria:'' | |||
''S.1 Risk Management / S.2 Payer Authorization / S.3 Payment Finality / S.4 Settlement Approach / S.5 Handling Disputed Payments / S.6 Fraud Information Sharing / S.7 Security Controls / S.8 Resiliency / S.9 End-User Data Protection / S.10 End-User/Provider Authentication / S.11 Participation Requirements (https://fasterpaymentstaskforce.org/effectiveness-criteria-and-solution-proposals/)'' | |||
''The number of levels is defined as follows.'' | |||
''4: Very Effective / 3: Effective / 2: Somewhat Effective / 1: Not Effective'' | |||
==Technical model== | |||
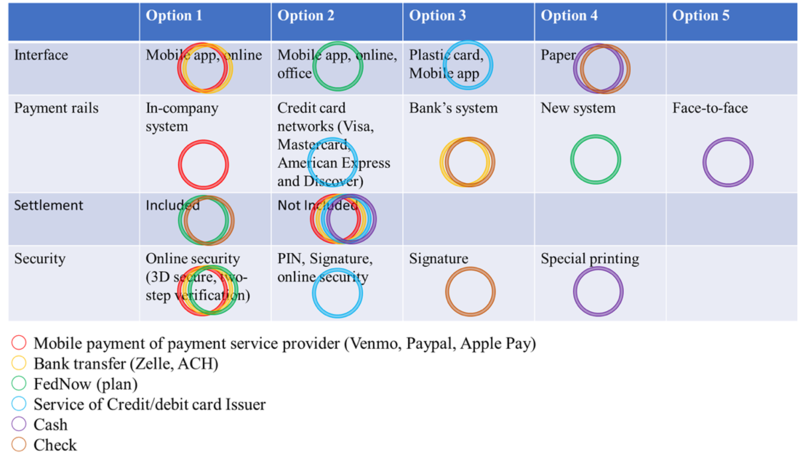
The following table shows the morphological matrix of the retail payment services which consumers can use now or in the future. | |||
There are various interfaces for retail payment. How to get the payment order depends on the interface of the payment, and it is connected to the payment speed. | |||
From the viewpoint of payment rails, mobile payment provided by PSP (Payment Service Provider) use an in-company system, so there is no interoperability with other payment services. Thus, their strategy to utilize the network effect is to expand its services and market share. By contrast, many banks hold their shared system, so a user of bank A can send their money to bank B users through the system. Even if a bank does not have a large market share, a user can benefit from the interbank system. | |||
A critical characteristic of FedNow is that the payment order is processed from the order to the settlement seamlessly. That makes the system to finalize the settlement fast. | |||
The interface, payment rails, and settlement can influence the payment settlement speed. | |||
Security of the payment is important because transferring money accompanies many fraud cases, creating a loss. | |||
[[File:Payment system Morphological Matrix.png|800px|thumb|center]] | |||
For payment systems, the technologies already exist to process a payment near real-time (near real-time is real time with network latency). | |||
The main challenge within the payment industry is to comply with the relevant regulatory requirements. Various acts are relevant to the payment industry, including Anti-Money Laundering (which is used to combat drug trafficking), Cross-border Terrorist Financing (used to combat terrorism) and the Foreign Account Tax Compliance Act (where the US requires all non-U.S. foreign financial institutions to search and monitor their records for customers with a connection to the U.S.). These regulations require payment systems to enforce additional controls within their networks to ensure compliance. | |||
We adopted a top-down and bottom-up approach to identify projects that can pull specific technologies to new capability levels that can best assist in achieving strategic objectives. Due to the unknown regulatory requirements that may impact a specific project, a high-level technical model estimate was performed for various opportunities (opposed to selecting only one project). | |||
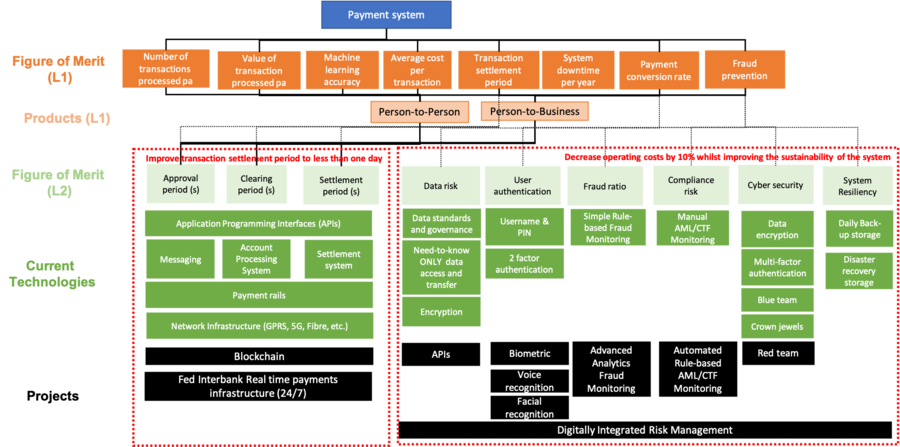
A two-level decomposition is used to identify which technologies can be enhanced to achieve strategic objectives as per below: | |||
[[File:Project Decom 2.png|900px|frameless|center|Two-level decomposition of products (Level 1) to technologies (L2) and projects]] | |||
Below are descriptions for each of the projects: | |||
{| class="wikitable" | |||
|- | |||
! # !! Level 1 FOM !! Project Name !! Description | |||
|- | |||
| 1 || Transaction settlement period || Block chain || Build new blockchain infrastructure to facilitate fast, secure, low-cost local and international payment processing services (and other transactions) through the use of encrypted distributed ledgers that provide trusted real-time verification of transactions without the need for intermediaries such as correspondent banks and clearing houses | |||
|- | |||
| 2 || Transaction settlement period || Fed Interbank real-time payments infrastructure || The Fed has committed to a new real-time payments platform that would enable financial institutions in the U.S. to clear and settle transactions in virtually instantaneous fashion to be completed by 2023/2024. Our payment system is to integrate with this new platform. | |||
|- | |||
| 3 || Fraud Prevention || Application Programming Interfaces (APIs) || Open Banking will require financial institutions to open their data for third parties to access and consume. By developing standardized APIs, we can ensure our clients data is safe, secure and only the relevant data is provided when third parties requires access. | |||
|- | |||
| 4 || Fraud Prevention || Biometric Authentication || Clients can access our payment systems by using fingerprints (opposed to PIN) | |||
|- | |||
| 5 || Fraud Prevention || Voice recognition || Clients can access our payment systems by using their voices (opposed to PIN) | |||
|- | |||
| 6 || Fraud Prevention || Facial recognition || Clients can access our payment systems by using their face (opposed to PIN) | |||
|- | |||
| 7 || Machine learning + Fraud Prevention || Advanced analytics - fraud monitoring || The current false-positive irate in fraud detection is greater than 40%. This should be reduced to 20% by using more advance analytical techniques, and create resource capacity to investigate actual fraud cases. Advanced analytics can also detect and take mitigating action in real-time to decrease client related fraud losses by 30%. | |||
|- | |||
| 8 || Machine Learning || Advanced analytics - AML/CTF monitoring || The current false-positive irate in AML/CTF detection is greater than 90%. This should be reduced to 60% by using advance analytical techniques. | |||
|- | |||
| 9 || System downtime per year || Red team || Recruit a red team (consisting of ethical hackers) to continuously identify and attack cyber security vulnerabilities. | |||
|- | |||
| 10 || Transaction settlement period|| Digitally integrated risk management || Integrate respective risk monitoring performance indicators into system processes and automate reporting. This will decrease time spend on manual tasks. | |||
|} | |||
Each project was quantified and a '''Net Benefit score per dollar''' calculated. This equation utilizes the following variables: | |||
* The project cost '''(C)''' is estimated, utilizing an algorithmic project management software application (example SEER); | |||
* The percentage feasibility '''(F)''' of project success is determined by combining expert SME and technologist opinion; | |||
* The direct benefits '''(D)''' are real monetary benefits (e.g. increased revenue, cost reductions) to be realized by the project which the project sponsor commits to realize; and | |||
* Indirect benefits '''(I)''' are other risk or economic related benefits which will not directly impact the company’s net profit, but will create a more sustainable system (e.g. reduce the risk profile of the system, avoid regulatory fines and losses, etc.) | |||
The '''Net Benefit score per dollar''' is calculated as follow: | |||
[[File:NB calc2.png|frameless|center]] | |||
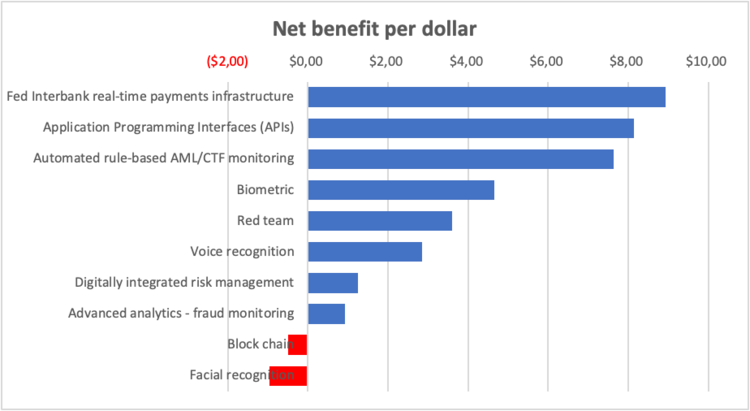
This resulted in the following tornado diagram being generated (projects listed in order of priority): | |||
[[File:Tornado2.png|750px|frameless|center|Project tornado]] | |||
==Financial model== | |||
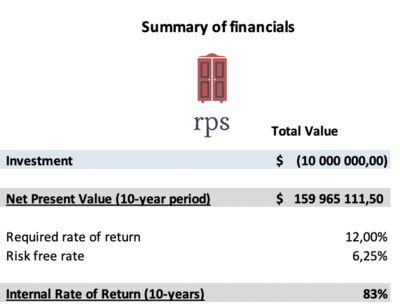
Our financial model is to build a new "Retail Payment System" (RPS). It includes a project development cost of US$100m to be spend over the first 20 months. A project period of 10 years is used and 1% of Revenue pa is to be spent on Research & Development. | |||
[[File:Retail payments returns.png|400px|thumb|right|Summary of investment returns]] | |||
====Assumptions==== | |||
* '''Investment:''' | |||
** US$10m investment and 24-month build period is benchmarked against the cost of conceptualizing, building and launching a platform business within a bank. | |||
* '''Revenue:''' | |||
** A fixed transaction facilitation and data processing fee of US$0.99 (sales cost) per transaction. | |||
*** Currently payment processors take a fixed fee and/or % of transaction value. | |||
*** Benchmarked against various payment platforms (Cybersource, Paypal, Venmo). | |||
** Growth is relevant to number of states/countries, users, and growth of transactions per user. Different ramp-up targets and constraints include: | |||
*** Launch in a new state/country every month until we have a presence in 200 states / countries. | |||
*** 1st day transaction processing starts with 584 transactions per day, and this is to grow by 1% per month within each state / country. | |||
*** Maximum transactions per state/country is capped at 100,000 transactions per day. | |||
* '''Costs:''' | |||
** Bank fees of 5.00% per transaction. | |||
** Sales tax at 6.25%. | |||
** Variable costs related to IT infrastructure where 3rd party cloud infrastructure to be used. Costs of additional infrastructure per transaction is fixed and can be directly passed onto these providers ($0.25 per transaction). | |||
** Expenses related to salaried employees, equipment, office space, travel allowance to see clients. | |||
** 1% of Revenue pa to be spend on Research & Development. | |||
* '''Discount rate:''' | |||
** The discount rate is the Required rate of return (12%). | |||
====Cash flow models==== | |||
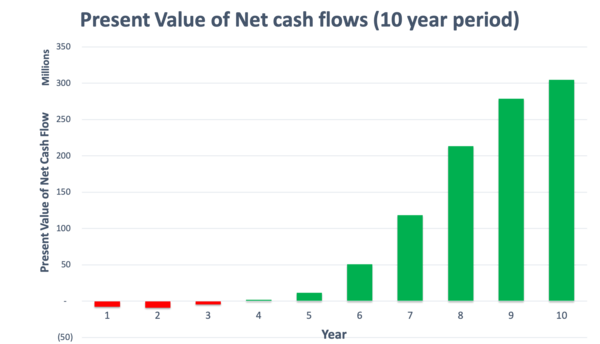
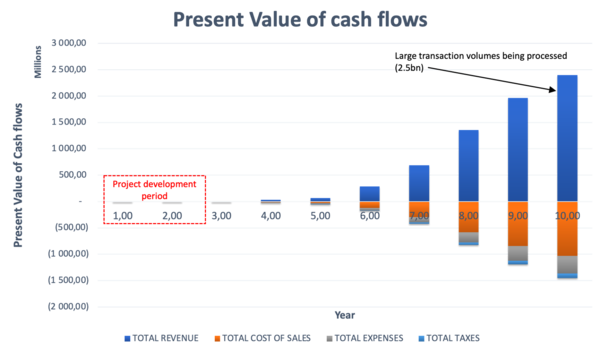
The figure below contains a NPV analysis underlying the Retail Payment system roadmap. | |||
[[File:NPV cash flows.png|600px|thumb|centre|right|Present Value of net cash flows]] | |||
[[File:Cashflow v4.png|600px|thumb|centre|Present Value of cash flows]] | |||
After 10-years, this still represents less than 5% expected of the US market size and we expect growth will continue. We believe the exponential growth nature of this curve will last longer than the period highlighted here as the trend towards digital payments (opposed to physical cash and cheque payments) will continue to accelerate. | |||
====Annual Profit & Loss statement==== | |||
The annual forecasted profit & loss statement is as follow: | |||
==R&D Projects== | |||
The R&D projects their anticipated FOM impact, feasibility, cost estimates and Net Benefit (NB) values are: | |||
{| class="wikitable" | |||
|- | |- | ||
| | ! # !! Project Name !! Value of Transactions !! Number of Transactions !! ML Accuracy !! Cost per transaction !! Transaction settlement period !! System downtime !! Payment conversion rate !! Fraud prevention !! Feasibility !! Project Cost ($m) !! NB per dollar | ||
| | |- | ||
| % | | 1 || Fed Interbank infrastructure || +0.27% || +0.27% || || || < 30 minutes || || || || 95% || $1,400 || $8.94 | ||
|- | |||
| 2 || APIs || +0.5% || +0.5% || || -0.5% || || || || || 80% || $7 || $8.14 | |||
|- | |||
| 3 || Advanced AML/CTF monitoring || +0.01% || +0.01% || || -1% || || || || || 80% || $8 || $7.64 | |||
|- | |||
| 4 || Biometric authentication || +0.25% || +0.25% || || || || || || -3% || 90% || $8 || $4.66 | |||
|- | |||
| 5 || Red team || +0.01% || +0.01% || || || || +2.5% || || || 85% || $1 || $3.60 | |||
|- | |||
| 6 || Voice authentication || +0.25% || +0.25% || || || || || || -3% || 80% || $10.5 || $2.86 | |||
|- | |||
| 7 || Digital risk management|| || || || -0.5% || || || || -4% || 75% || $20 || $1.25 | |||
|- | |||
| 8 || Advanced fraud monitoring || || || -10% || -0.1% || < 30 minutes || || || || 80% || $8.5 || $0.92 | |||
|- | |||
| 9 || Block chain || +0.27% || +0.27% || || -5% || < 30 minutes || || || || 10% || $3,000 || ($0.49) | |||
|- | |||
| 10 || Face authentication || +0.1% || +0.1% || || || || -1% || || || 30% || $15 || ($0.96) | |||
|} | |} | ||
==Patents and papers== | |||
[[File:Patents google.png|right|thumb|Results from Google patent search]] | |||
Extensive information is available pertaining to "payment systems": | |||
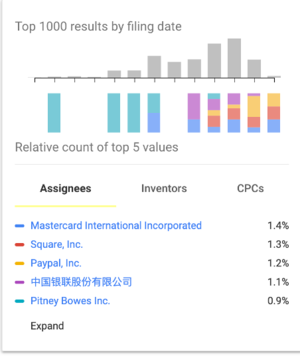
* Google Scholar yielded 31,800 results when searching for “Payment System” from 2016 (excluding references in citations and patents). | |||
* Google Patents yielded 95,500 results. More than half of these were generated from 2010. | |||
* U.S. Trademark and Patent Office yielded 406 results in “Payment System”. | |||
* MIT Libraries yielded the following results for a “Payment System” search: Books and media (88,910), Articles and journals (131,263) and Archives and manuscripts (62) | |||
Other credible sources of public information include: | |||
* US Federal Reserve (Fed) | |||
* World Bank Group | |||
* Bank of International Settlements (BIS) | |||
===Examples of patents:=== | |||
#'''''Methods and systems for IOT enabled payments''''' (US 2018/0197175) by Mastercard International Corporation. | |||
## The inventor of the patent is Peter Groarke (a Mastercard employee based in Dublin, Ireland). The patent was also filed in the European Union. | |||
## This patent addresses a method and system for placing and processing orders for a product in which the processing of the payment is delayed until the product has been successfully received. There exists a need for a payment system that does not require the intervention of a card holder or financial institutions to reverse the payment when an order is not successfully completed. | |||
## The burden to remove incorrectly processed payments is removed. | |||
## It is a utility patent, in that the respective methods and processes to place and process a specific payment transaction is provided. | |||
#'''''System and method for linking payment card to payment contract''''' (United States 3,778,595 on 11 December 1973) by Yoshihiro Hatanaka and Akio Ueba. This is the initial patent for an Automatic Bank Teller (ATM) system. | |||
#'''''Digital fiat currency''''' (US 2020/0151682) by Visa International Service Association. Techniques are disclosed which include receiving, by a central entity computer, a request for digital currency. | |||
#'''''Dynamic provisioning of wallets in a secure payment system''''' (US 2020/0065819) by Radpay , Inc. The patent describe methods and systems for securely conducting a transaction requiring approval via a personal device of a purchaser is provided. | |||
#'''''Electronic funds transfer instruments''''' (US 005677955A) by the Financial Services Consortium, The First National Bank of Boston and Bell Communications Research, Inc. | |||
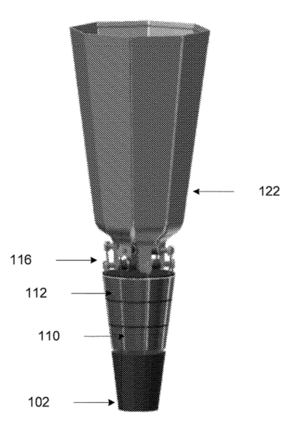
[[File:Patent1.png|thumb|right|Drawing of "Electronic Funds Transfer Instruments" patent]] | |||
## This patent is old and basic one related to funds transfer from payers to payees with electronic instruments. The process includes the process of an electronic signature, automated authentication of users, and the integrated fraud prevention measures. | |||
## The process enables customers to do transmit and deposit their money without going to a bank branch. Interestingly, in the patent, the concept of API function was also articulated. | |||
## The patent has been cited by 1235 other patents and it include basic and general contents, so it is one of the basements in the area of payment. | |||
===Examples of papers:=== | |||
#'''''U.S. Payment System Policy Issues: Faster Payments and Innovation''''' (September 23, 2019) by Cheryl R. Cooper, Marc Labonte and David W. Perkins on behalf of the Congressional Research Reserve. This report examines technological innovation and the regulatory environment of US payment systems generally and particular policy issues as a result of retail (i.e, point of sale) payment innovation. | |||
# '''''Fast payments – Enhancing the speed and availability of retail payments''''' (November 2016), by the Committee on Payments and Market Infrastructures from the Bank of International Settlements. This report highlights the role central banks can take in a the payment system: a catalyst role, an oversight role, and an operational role. It also reaffirms the role and how central banks should enable and support faster payment systems. | |||
# '''''The U.S. path to faster payments - PART ONE''''' (January 2017), by the Faster Payments Task Force. The paper describes the task force’s mission and process, and provides greater detail about the motivation behind the task force’s work in the context of the current payments landscape — explaining why the task force came together to identify and evaluate effective faster payments solutions in the United States. The motivation of the task force is to solve the problem that wide range of end-user needs are not satisfied, to enhance innovation, and to improve the flow of commerce and position of the US by designing payment system with high interoperability and efficiency. The task force was organized by various stakeholders in the United States. In order to design a new payment system, the task force used 36 “effectiveness criteria” to identify relevant solutions from industry. | |||
# '''''The U.S. path to faster payments - PART TWO: A Call to Action''''' (July 2017), by the Faster Payments Task Force. This second paper from the Faster Payments Task Force presents a roadmap for achieving safe, ubiquitous, faster payments that encourages competition among a variety of solutions, as opposed to endorsing a single approach. | |||
==Technology Strategy statement== | |||
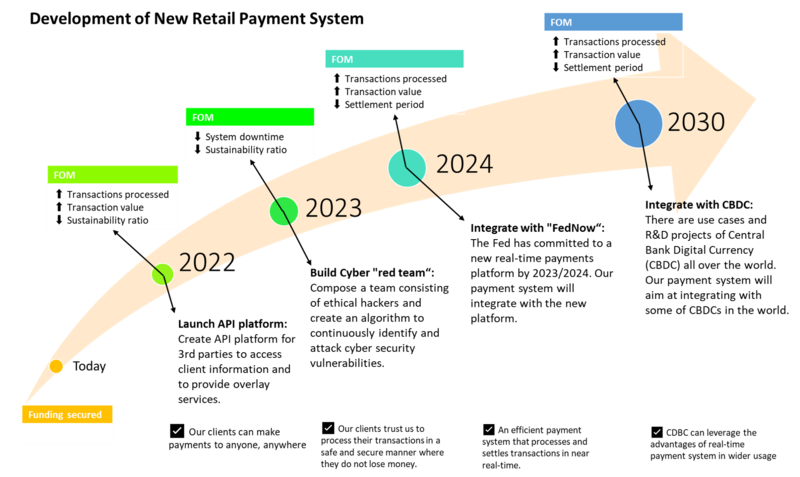
Our technology strategy is to utilize respective technologies that assists in the attainment of our strategic objectives. Improvements due to technology should benefit all customers including consumers and companies. The Swoosh chart contains the major technical milestones over the next decade, how they will impact our FOM and assist in the realization of our strategic objectives. | |||
[[File:payment system_swoosh.png|800px|thumb|center|RPS Swoosh for the future]] | |||
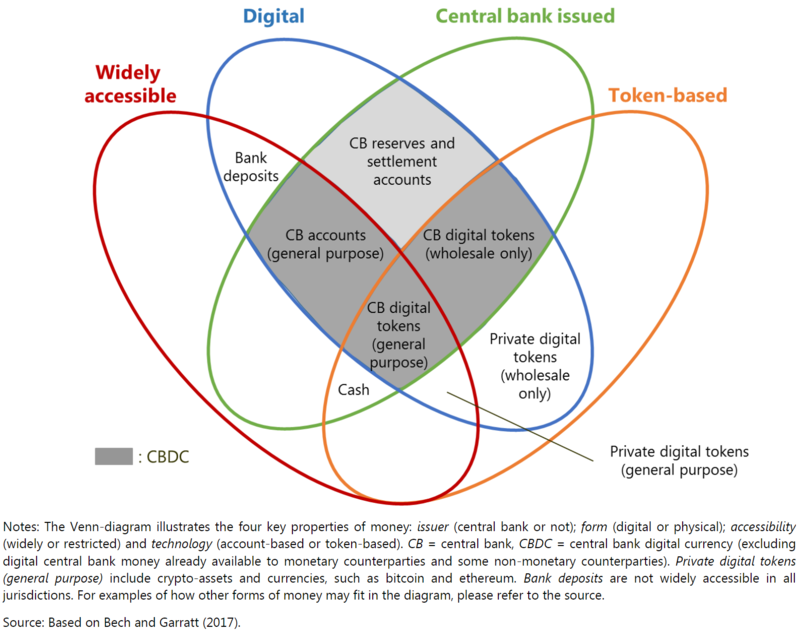
Currently, there are also much more discussions for creating Central Bank Digital Currency (CBDC) in each country. The following figure shows the possible types of CBDC and some types of CBDC include retail payments. In the future, launching a CBDC in each country could be another opportunity to apply the technology. So we will invest additionally after the launch of FedNow to develop the technology into the level where it meets CBDC's requirements. | |||
[[File:payment system_money flower.png|800px|thumb|center]] | |||
Latest revision as of 18:07, 5 November 2024
Technology Roadmap
Roadmap Overview
The U.S. financial system processes millions of transactions each day to facilitate purchases and payments. In general terms, a payment system consists of the means for transferring money between suppliers and users of funds through the use of cash substitutes, such as checks, drafts, and electronic funds transfers.
A payment system is a system that exchanges / trades value by changing the ownership of money. It consists of a set of instruments, banking procedures, and, typically, interbank funds transfer systems that ensure the circulation of money. These systems allow for the processing and completion of financial transactions.
From the typical consumer’s perspective, making a payment is simple. A person swipes a card, clicks a button, or taps a mobile device and the payment is approved within seconds. However, the infrastructure and technology underlying the payment systems are substantial and complex. To simplify, a payment system has three parts (see Figure below).
*image-source - U.S. Payment System Policy Issues: Faster Payments and Innovation, Congressional Research Service (2019)
Based on our research, an overview of the US retail payment system can be seen in the following figure. The settlement is needed for finalizing money transfer using the central bank's accounts. The clearing service works by sending the payment message and offset the payments which are the reverse and the same amount. Most retail payments rely on these clearing and settlement.
Design Structure Matrix (DSM) Allocation
The design structure matrix for the Retail Payment System is depicted in the image below.
The following figure shows the tree structure of the Retail Payment System. Our roadmap focuses not on the wholesale payment system, but on the retail payment system. The API is optional and it is not included in all payment systems.
Object Process Model (OPM)
The following picture shows the whole OPM for the retail payment system. These OPM diagrams in the picture are designed referring to the example of Appendix A in the book "Object-Process Methodology A Holistic Systems Paradigm" written by Dov Dori.
The following diagrams show each OPM for the retail payment system.
Figures of Merit (FOM)
The table below show a list of FOMs by which can assess a Payment System:
| Class | Figure of Merit | Units | Metric |
|---|---|---|---|
| Performance | Value of transactions processed per annum | [US$] | Monetary value of all transactions processed per annum. |
| Productivity | Number of transactions processed per annum | # of transactions processed per country, per individual or business client type | Count of the number of transactions processed per annum. |
| Machine learning accuracy | Weighted False Positive ratio | <math>\sum_{i=1}^{Systems} Weight_i \frac{FalsePositives_i}{(FalsePositives_i + TrueNegatives_i)} </math> | |
| Efficiency | Average cost per transaction | [US cents] | The total Earnings Before Interest and Tax (Tax) divided by the Number of transactions processed per annum |
| Transaction settlement period | [Seconds] | The time lag between the payment initiation of the payment order and its final settlement. | |
| Sustainability | System downtime per year | [Seconds] | The seconds in a year is that the system is not online and processing successfully, i.e., not “up and running”. |
| Payment conversion rate | [%] | # of settled transactions per annum / # of attempted transactions per annum | |
| Fraud prevention | [%] | # of fraudulent transactions / # approved transactions |
Examples of FOM performance
Company Strategic Objectives
We identified strategic objectives that can stand the test of time. We want our clients to understand that we are constant, unchanging, something they can depend on. As technology improves, we can change the respective FOM and targets, without changing our strategic objectives. The table below shows our strategic objectives:
| Strategic Objective | Alignment and Targets |
|---|---|
| An efficient payment system that processes and settles transactions in near real-time. | Currently we have a transaction settlement period of 1 day and aim to decrease this to 90 seconds. |
| Our clients trust us to process their transactions in a safe and secure manner where they do not lose money. | We aim to maintain System downtime per year to less than 480s (i.e. 8 hours). In the next year we will improve our fraud prevention ratio (by at least 0.5%) and machine learning accuracy (by at least 5%) whilst maintaining or decreasing our cost base. |
| Our clients can make payments to anyone, anywhere. | We continue to grow the number of payments we process pa to more than 1bn, servicing more than 750k individual and 10k business clients in 76 countries. Our goal is to process 1% of all payments made as reported by the Bank of International Settlements. |
Positioning of Company vs. Competition
First, the following vector chart shows the competitive situation among different types of payment. The mobile payment has improved both the average cost per transaction and the payment settlement period. When it comes to a bank transfer, it gradually improved productivity, but recently banks offered RTP network, a faster clearing system in the US, so it has shortened the payment settlement period. Credit/ debit card has improved average cost per transaction by raising the precision of fraud detection.
Second, the following vector chart shows the competitive situation among different companies of payment services. Here, we compare the payment settlement period and interoperability. Interoperability is related to cost because it takes money and time to get the system interoperable with other systems or services. Player C announced that it would offer a real-time payment system for everyone, including small commercial banks that are sometimes difficult to access the interbank system because of the cost level. Player A launched a faster clearing system to compete with it. Player B offers faster payment services without interoperability with other payments. Player C has extended the acceptance of merchants where users can use their payment.
The following figure shows the trade space of the proposals for FedNow. In 2016, the Faster Payments Task Force asked for proposals of FedNow, and more than 30 companies offered the proposals. The figure shows 16 open cases of them. Due to data limitation, we used “Safety and Security level*” as the alternative for the FOM of Safety & Security, Sustainability ratio.
* We calculated “Safety and Security level” as the average level of assessment results for the following assessment criteria.
Assessment criteria:
S.1 Risk Management / S.2 Payer Authorization / S.3 Payment Finality / S.4 Settlement Approach / S.5 Handling Disputed Payments / S.6 Fraud Information Sharing / S.7 Security Controls / S.8 Resiliency / S.9 End-User Data Protection / S.10 End-User/Provider Authentication / S.11 Participation Requirements (https://fasterpaymentstaskforce.org/effectiveness-criteria-and-solution-proposals/)
The number of levels is defined as follows.
4: Very Effective / 3: Effective / 2: Somewhat Effective / 1: Not Effective
Technical model
The following table shows the morphological matrix of the retail payment services which consumers can use now or in the future.
There are various interfaces for retail payment. How to get the payment order depends on the interface of the payment, and it is connected to the payment speed. From the viewpoint of payment rails, mobile payment provided by PSP (Payment Service Provider) use an in-company system, so there is no interoperability with other payment services. Thus, their strategy to utilize the network effect is to expand its services and market share. By contrast, many banks hold their shared system, so a user of bank A can send their money to bank B users through the system. Even if a bank does not have a large market share, a user can benefit from the interbank system.
A critical characteristic of FedNow is that the payment order is processed from the order to the settlement seamlessly. That makes the system to finalize the settlement fast.
The interface, payment rails, and settlement can influence the payment settlement speed.
Security of the payment is important because transferring money accompanies many fraud cases, creating a loss.
For payment systems, the technologies already exist to process a payment near real-time (near real-time is real time with network latency).
The main challenge within the payment industry is to comply with the relevant regulatory requirements. Various acts are relevant to the payment industry, including Anti-Money Laundering (which is used to combat drug trafficking), Cross-border Terrorist Financing (used to combat terrorism) and the Foreign Account Tax Compliance Act (where the US requires all non-U.S. foreign financial institutions to search and monitor their records for customers with a connection to the U.S.). These regulations require payment systems to enforce additional controls within their networks to ensure compliance.
We adopted a top-down and bottom-up approach to identify projects that can pull specific technologies to new capability levels that can best assist in achieving strategic objectives. Due to the unknown regulatory requirements that may impact a specific project, a high-level technical model estimate was performed for various opportunities (opposed to selecting only one project).
A two-level decomposition is used to identify which technologies can be enhanced to achieve strategic objectives as per below:
Below are descriptions for each of the projects:
| # | Level 1 FOM | Project Name | Description |
|---|---|---|---|
| 1 | Transaction settlement period | Block chain | Build new blockchain infrastructure to facilitate fast, secure, low-cost local and international payment processing services (and other transactions) through the use of encrypted distributed ledgers that provide trusted real-time verification of transactions without the need for intermediaries such as correspondent banks and clearing houses |
| 2 | Transaction settlement period | Fed Interbank real-time payments infrastructure | The Fed has committed to a new real-time payments platform that would enable financial institutions in the U.S. to clear and settle transactions in virtually instantaneous fashion to be completed by 2023/2024. Our payment system is to integrate with this new platform. |
| 3 | Fraud Prevention | Application Programming Interfaces (APIs) | Open Banking will require financial institutions to open their data for third parties to access and consume. By developing standardized APIs, we can ensure our clients data is safe, secure and only the relevant data is provided when third parties requires access. |
| 4 | Fraud Prevention | Biometric Authentication | Clients can access our payment systems by using fingerprints (opposed to PIN) |
| 5 | Fraud Prevention | Voice recognition | Clients can access our payment systems by using their voices (opposed to PIN) |
| 6 | Fraud Prevention | Facial recognition | Clients can access our payment systems by using their face (opposed to PIN) |
| 7 | Machine learning + Fraud Prevention | Advanced analytics - fraud monitoring | The current false-positive irate in fraud detection is greater than 40%. This should be reduced to 20% by using more advance analytical techniques, and create resource capacity to investigate actual fraud cases. Advanced analytics can also detect and take mitigating action in real-time to decrease client related fraud losses by 30%. |
| 8 | Machine Learning | Advanced analytics - AML/CTF monitoring | The current false-positive irate in AML/CTF detection is greater than 90%. This should be reduced to 60% by using advance analytical techniques. |
| 9 | System downtime per year | Red team | Recruit a red team (consisting of ethical hackers) to continuously identify and attack cyber security vulnerabilities. |
| 10 | Transaction settlement period | Digitally integrated risk management | Integrate respective risk monitoring performance indicators into system processes and automate reporting. This will decrease time spend on manual tasks. |
Each project was quantified and a Net Benefit score per dollar calculated. This equation utilizes the following variables:
- The project cost (C) is estimated, utilizing an algorithmic project management software application (example SEER);
- The percentage feasibility (F) of project success is determined by combining expert SME and technologist opinion;
- The direct benefits (D) are real monetary benefits (e.g. increased revenue, cost reductions) to be realized by the project which the project sponsor commits to realize; and
- Indirect benefits (I) are other risk or economic related benefits which will not directly impact the company’s net profit, but will create a more sustainable system (e.g. reduce the risk profile of the system, avoid regulatory fines and losses, etc.)
The Net Benefit score per dollar is calculated as follow:
This resulted in the following tornado diagram being generated (projects listed in order of priority):
Financial model
Our financial model is to build a new "Retail Payment System" (RPS). It includes a project development cost of US$100m to be spend over the first 20 months. A project period of 10 years is used and 1% of Revenue pa is to be spent on Research & Development.
Assumptions
- Investment:
- US$10m investment and 24-month build period is benchmarked against the cost of conceptualizing, building and launching a platform business within a bank.
- Revenue:
- A fixed transaction facilitation and data processing fee of US$0.99 (sales cost) per transaction.
- Currently payment processors take a fixed fee and/or % of transaction value.
- Benchmarked against various payment platforms (Cybersource, Paypal, Venmo).
- Growth is relevant to number of states/countries, users, and growth of transactions per user. Different ramp-up targets and constraints include:
- Launch in a new state/country every month until we have a presence in 200 states / countries.
- 1st day transaction processing starts with 584 transactions per day, and this is to grow by 1% per month within each state / country.
- Maximum transactions per state/country is capped at 100,000 transactions per day.
- A fixed transaction facilitation and data processing fee of US$0.99 (sales cost) per transaction.
- Costs:
- Bank fees of 5.00% per transaction.
- Sales tax at 6.25%.
- Variable costs related to IT infrastructure where 3rd party cloud infrastructure to be used. Costs of additional infrastructure per transaction is fixed and can be directly passed onto these providers ($0.25 per transaction).
- Expenses related to salaried employees, equipment, office space, travel allowance to see clients.
- 1% of Revenue pa to be spend on Research & Development.
- Discount rate:
- The discount rate is the Required rate of return (12%).
Cash flow models
The figure below contains a NPV analysis underlying the Retail Payment system roadmap.
After 10-years, this still represents less than 5% expected of the US market size and we expect growth will continue. We believe the exponential growth nature of this curve will last longer than the period highlighted here as the trend towards digital payments (opposed to physical cash and cheque payments) will continue to accelerate.
Annual Profit & Loss statement
The annual forecasted profit & loss statement is as follow:
R&D Projects
The R&D projects their anticipated FOM impact, feasibility, cost estimates and Net Benefit (NB) values are:
| # | Project Name | Value of Transactions | Number of Transactions | ML Accuracy | Cost per transaction | Transaction settlement period | System downtime | Payment conversion rate | Fraud prevention | Feasibility | Project Cost ($m) | NB per dollar |
|---|---|---|---|---|---|---|---|---|---|---|---|---|
| 1 | Fed Interbank infrastructure | +0.27% | +0.27% | < 30 minutes | 95% | $1,400 | $8.94 | |||||
| 2 | APIs | +0.5% | +0.5% | -0.5% | 80% | $7 | $8.14 | |||||
| 3 | Advanced AML/CTF monitoring | +0.01% | +0.01% | -1% | 80% | $8 | $7.64 | |||||
| 4 | Biometric authentication | +0.25% | +0.25% | -3% | 90% | $8 | $4.66 | |||||
| 5 | Red team | +0.01% | +0.01% | +2.5% | 85% | $1 | $3.60 | |||||
| 6 | Voice authentication | +0.25% | +0.25% | -3% | 80% | $10.5 | $2.86 | |||||
| 7 | Digital risk management | -0.5% | -4% | 75% | $20 | $1.25 | ||||||
| 8 | Advanced fraud monitoring | -10% | -0.1% | < 30 minutes | 80% | $8.5 | $0.92 | |||||
| 9 | Block chain | +0.27% | +0.27% | -5% | < 30 minutes | 10% | $3,000 | ($0.49) | ||||
| 10 | Face authentication | +0.1% | +0.1% | -1% | 30% | $15 | ($0.96) |
Patents and papers
Extensive information is available pertaining to "payment systems":
- Google Scholar yielded 31,800 results when searching for “Payment System” from 2016 (excluding references in citations and patents).
- Google Patents yielded 95,500 results. More than half of these were generated from 2010.
- U.S. Trademark and Patent Office yielded 406 results in “Payment System”.
- MIT Libraries yielded the following results for a “Payment System” search: Books and media (88,910), Articles and journals (131,263) and Archives and manuscripts (62)
Other credible sources of public information include:
- US Federal Reserve (Fed)
- World Bank Group
- Bank of International Settlements (BIS)
Examples of patents:
- Methods and systems for IOT enabled payments (US 2018/0197175) by Mastercard International Corporation.
- The inventor of the patent is Peter Groarke (a Mastercard employee based in Dublin, Ireland). The patent was also filed in the European Union.
- This patent addresses a method and system for placing and processing orders for a product in which the processing of the payment is delayed until the product has been successfully received. There exists a need for a payment system that does not require the intervention of a card holder or financial institutions to reverse the payment when an order is not successfully completed.
- The burden to remove incorrectly processed payments is removed.
- It is a utility patent, in that the respective methods and processes to place and process a specific payment transaction is provided.
- System and method for linking payment card to payment contract (United States 3,778,595 on 11 December 1973) by Yoshihiro Hatanaka and Akio Ueba. This is the initial patent for an Automatic Bank Teller (ATM) system.
- Digital fiat currency (US 2020/0151682) by Visa International Service Association. Techniques are disclosed which include receiving, by a central entity computer, a request for digital currency.
- Dynamic provisioning of wallets in a secure payment system (US 2020/0065819) by Radpay , Inc. The patent describe methods and systems for securely conducting a transaction requiring approval via a personal device of a purchaser is provided.
- Electronic funds transfer instruments (US 005677955A) by the Financial Services Consortium, The First National Bank of Boston and Bell Communications Research, Inc.
- This patent is old and basic one related to funds transfer from payers to payees with electronic instruments. The process includes the process of an electronic signature, automated authentication of users, and the integrated fraud prevention measures.
- The process enables customers to do transmit and deposit their money without going to a bank branch. Interestingly, in the patent, the concept of API function was also articulated.
- The patent has been cited by 1235 other patents and it include basic and general contents, so it is one of the basements in the area of payment.
Examples of papers:
- U.S. Payment System Policy Issues: Faster Payments and Innovation (September 23, 2019) by Cheryl R. Cooper, Marc Labonte and David W. Perkins on behalf of the Congressional Research Reserve. This report examines technological innovation and the regulatory environment of US payment systems generally and particular policy issues as a result of retail (i.e, point of sale) payment innovation.
- Fast payments – Enhancing the speed and availability of retail payments (November 2016), by the Committee on Payments and Market Infrastructures from the Bank of International Settlements. This report highlights the role central banks can take in a the payment system: a catalyst role, an oversight role, and an operational role. It also reaffirms the role and how central banks should enable and support faster payment systems.
- The U.S. path to faster payments - PART ONE (January 2017), by the Faster Payments Task Force. The paper describes the task force’s mission and process, and provides greater detail about the motivation behind the task force’s work in the context of the current payments landscape — explaining why the task force came together to identify and evaluate effective faster payments solutions in the United States. The motivation of the task force is to solve the problem that wide range of end-user needs are not satisfied, to enhance innovation, and to improve the flow of commerce and position of the US by designing payment system with high interoperability and efficiency. The task force was organized by various stakeholders in the United States. In order to design a new payment system, the task force used 36 “effectiveness criteria” to identify relevant solutions from industry.
- The U.S. path to faster payments - PART TWO: A Call to Action (July 2017), by the Faster Payments Task Force. This second paper from the Faster Payments Task Force presents a roadmap for achieving safe, ubiquitous, faster payments that encourages competition among a variety of solutions, as opposed to endorsing a single approach.
Technology Strategy statement
Our technology strategy is to utilize respective technologies that assists in the attainment of our strategic objectives. Improvements due to technology should benefit all customers including consumers and companies. The Swoosh chart contains the major technical milestones over the next decade, how they will impact our FOM and assist in the realization of our strategic objectives.
Currently, there are also much more discussions for creating Central Bank Digital Currency (CBDC) in each country. The following figure shows the possible types of CBDC and some types of CBDC include retail payments. In the future, launching a CBDC in each country could be another opportunity to apply the technology. So we will invest additionally after the launch of FedNow to develop the technology into the level where it meets CBDC's requirements.
