Difference between revisions of "Electric Vehicle Charging Technologies"
| (24 intermediate revisions by 5 users not shown) | |||
| Line 12: | Line 12: | ||
With today’s technology long-range EVs (200+ mile range) could take as high as 30+ hours to fully charge the battery pack using a regular home outlet. Fast charging technologies have also been developed which can bring the charge time down to a few hours (~2 hours), but these times are still significantly higher than the time needed to fill a fuel tank in a gasoline/ diesel vehicle as shown in the figure below. These would also warrant better cooling technologies to keep optimal battery thermal performance and extend battery lifetime. With the battery cost ($ per KWh or $ per mile) decreasing, we could see a trend of bigger batteries / higher range vehicles being deployed, and an increased rate of adoption of electric vehicles, which would further necessitate faster charging and availability of charge stations. Hence, we feel the current technology would have to be advanced to be able to charge as fast as possible and make charge stations as freely available as gas stations today, thus ultimately reducing range anxiety. | With today’s technology long-range EVs (200+ mile range) could take as high as 30+ hours to fully charge the battery pack using a regular home outlet. Fast charging technologies have also been developed which can bring the charge time down to a few hours (~2 hours), but these times are still significantly higher than the time needed to fill a fuel tank in a gasoline/ diesel vehicle as shown in the figure below. These would also warrant better cooling technologies to keep optimal battery thermal performance and extend battery lifetime. With the battery cost ($ per KWh or $ per mile) decreasing, we could see a trend of bigger batteries / higher range vehicles being deployed, and an increased rate of adoption of electric vehicles, which would further necessitate faster charging and availability of charge stations. Hence, we feel the current technology would have to be advanced to be able to charge as fast as possible and make charge stations as freely available as gas stations today, thus ultimately reducing range anxiety. | ||
[[File:GasStationLine.jpg|thumb]] | |||
[[File:Charge times.png]] | |||
To address some feedback we received from our Midterm presentation and peer reviews on the question: "Why not just swap batteries between the car and the charging station in order to achieve high rates of energy transfer?" | |||
Let's start with a simple model: | |||
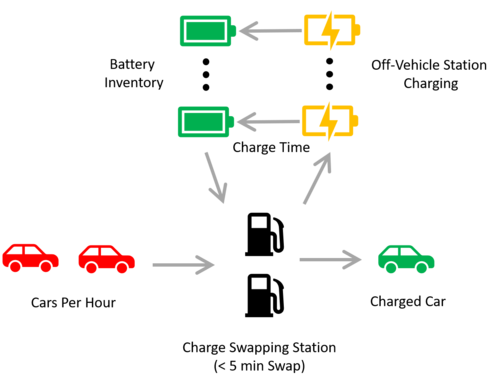
Cars arrive at the battery swapping station at a certain rate (cars/hour). The batteries are swapped in less than 5 minutes and transferred to a charging station. This station is able to charge the batteries at a certain rate. Then the charged batteries must be stored in order to meet the demand of incoming cars. | |||
[[File: | [[File:SwappingModelCartoon.png|500px]] | ||
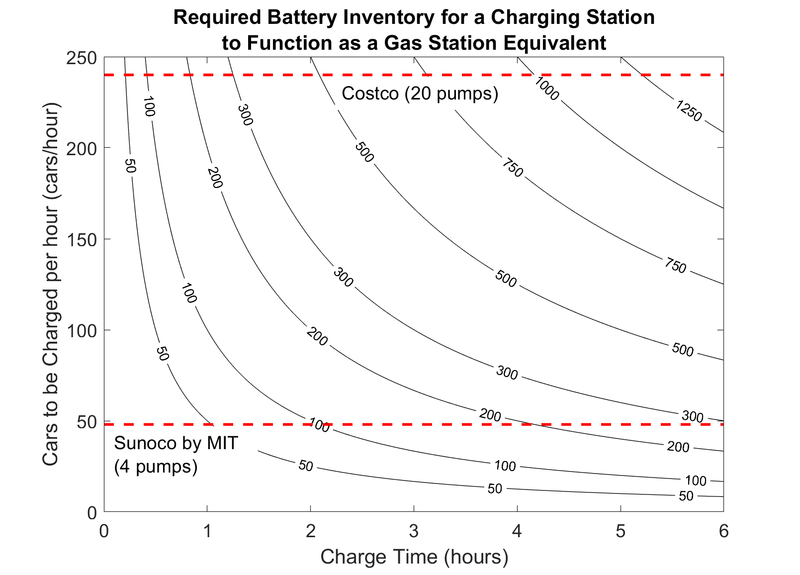
Battery swapping is a much higher rate of energy transfer than on vehicle charging, but transferring batteries forces the charging station to carry a high inventory of charging and fully charged batteries. We performed a sensitivity analysis showing the amount of battery inventory a swapping charging station would need in order to satisfy peak cars arriving per hour and the time it takes to charge a battery. | |||
[[File:BatteryInventoryNum.png|800px]] | |||
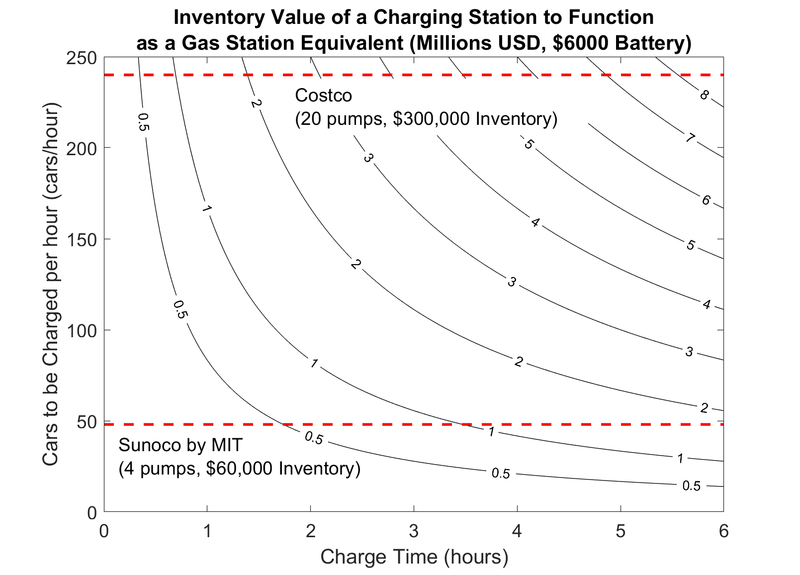
Having this large inventory not only requires a lot of space, it is also inefficient from a business point of view. For each swapping charging station that is built there is an associated fixed inventory cost that can range from 0.5 to multiple millions of dollars for the entire charging station. For a comparison, the maximum fixed inventory of a regular gas station ranges from 0.06 to 0.3 million dollars. A battery was assumed to cost $6,000, which is the current goal that tesla is working towards. | |||
[[File:BatteryInventoryCost.png|800px]] | |||
The takeaway: | |||
Yes, battery swapping is possible, but it is expensive to implement. There are additional costs for charging infrastructure that scales with the battery inventory. | |||
Unlocking fast charging capabilities will significantly reduce the costs associated with a battery swapping charging station or remove the need entirely for battery swapping. | |||
==DSM Allocation== | ==DSM Allocation== | ||
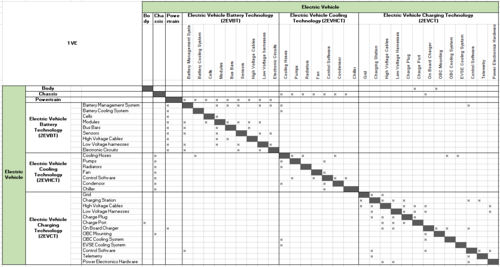
| Line 24: | Line 41: | ||
[[File:Dsm ve.png|500px]] | [[File:Dsm ve.png|500px]] | ||
==Technology Hierarchy Tree== | |||
The following hierarchy shows the breakdown from L1 Technologies (Vehicle Electrification in general) to L2 - Technologies that need to be developed to achieve vehicle electrification. Further, The 2EVCT decomposes into different technologies that are developed to facilitate electric vehicle charging. L4 technologies are the technologies needed to develop the formal entities of products that enable electric vehicle charging. | |||
[[File:Dsm tree.png]] | |||
==Roadmap Model using OPM== | ==Roadmap Model using OPM== | ||
| Line 33: | Line 57: | ||
[[File:Opl3.png|500px]] | [[File:Opl3.png|500px]] | ||
== 2EVCT | == 2EVCT Figures of Merit == | ||
The table below shows a list of FOMs by which charging of electric vehicles can be quantified and compared | The table below shows a list of FOMs by which charging of electric vehicles can be quantified and compared | ||
| Line 67: | Line 91: | ||
The most important figures of merit are charge rates, charge times, and charging stations. These directly affect how fast the vehicle can be charged and the availability of charge stations when needed. Charging is also cross dependant on battery pack behavior and hence will only be effective if the pack thermals are within thresholds. This interdependency of charging and pack behavior put a limitation on the technological advancements in charging (without proper cooling, charging technologies with extremely high charge rates would be worthless). | The most important figures of merit are charge rates, charge times, and charging stations. These directly affect how fast the vehicle can be charged and the availability of charge stations when needed. Charging is also cross dependant on battery pack behavior and hence will only be effective if the pack thermals are within thresholds. This interdependency of charging and pack behavior put a limitation on the technological advancements in charging (without proper cooling, charging technologies with extremely high charge rates would be worthless). | ||
== Competitive Landscape == | == Competitive Landscape == | ||
Below is a plot of vehicle charging times normalized by the distance that the vehicle can travel. There was a >2 fold improvement after 2000 when all EV manufacturers switched to Li-Ion batteries. Tesla is able to outperform all other EV companies by over a factor of two (220V charging numbers were used that could typically be done at some homes or at a business. Not a supercharger station.). | |||
[[File:ChargingTimeImprovement.png|800px]] | |||
As a reference, there are currently 115,000 gas stations in the United States [https://www.marketwatch.com/story/how-many-gas-stations-are-in-us-how-many-will-there-be-in-10-years-2020-02-16]. With electric vehicles, this number is quoted to be larger at (2.5 million World Wide [https://www.chargepoint.com/about/news/chargepoint-partners-total-gas-power-deliver-electric-vehicle-charging-solutions-across/#:~:text=ChargePoint%20currently%20has%20more%20than,company's%20most%20significant%20to%20date]) because of more distributed charging infrastructure located at businesses, parking spots, and also along interstates just like traditional gas stations. | |||
The electric vehicle charging system market is very competitive. As battery costs are coming down, there is a growing competition of deploying charging networks across the country and allowing higher charge rates to decrease the overall charge times. The table below shows the competitive landscape of the players in this industry. | The electric vehicle charging system market is very competitive. As battery costs are coming down, there is a growing competition of deploying charging networks across the country and allowing higher charge rates to decrease the overall charge times. The table below shows the competitive landscape of the players in this industry. | ||
| Line 143: | Line 176: | ||
Charging Current : | Charging Current : | ||
<math> I_{ac}=\min[({OBC}_{\text{Max Power}}/{V_{ac}}),{Max}{I_{ac}}] </math> | |||
<math> P_{ac}=V_{ac}*I_{ac}*PF </math> | |||
<math> P_{dc}=V_{dc}*I_{dc}</math> | |||
Using conservation of energy | Using conservation of energy | ||
<math> I_{dc}=(V_{ac}*I_{ac}*PF*η)/(V_{dc}*(100\%-\text{Derate Percent}))</math> | |||
The charging profile is usually Constant Current Charging until the pack voltage reaches 95% of the max voltage value after which the charging is done at Constant Voltage. | The charging profile is usually Constant Current Charging until the pack voltage reaches 95% of the max voltage value after which the charging is done at Constant Voltage. | ||
| Line 161: | Line 194: | ||
The pack temperature rise due to this charging event would be dependent on the heat rejection ability of the cooling plates inside the pack due to conduction. The rise can be expressed as | The pack temperature rise due to this charging event would be dependent on the heat rejection ability of the cooling plates inside the pack due to conduction. The rise can be expressed as | ||
<math> ΔT=Q*d/(N*K*A)</math> | |||
Conductive | Conductive Losses can be modeled as | ||
<math> Q_{loss}=I_{dc}^2*R</math> | |||
Time taken for charge complete can be expressed as a ratio of remaining energy and charge rate. | Time taken for charge complete can be expressed as a ratio of remaining energy and charge rate. | ||
<math> Time_{\text{charge complete}}=((100\%-SOC)*\text{Pack Capacity})/(V_{ac}*I_{ac})</math> | |||
Miles added due to charging can be expressed as a percent of total range of the vehicle. (Meaning if 100% charge yields “Range” miles, then a vehicle charged to SOC% would yield miles expressed by the formula below): | |||
<math> \text{Miles added}=Range*SOC</math> | |||
Cost of charging can be expressed as: | |||
Cost | <math> Cost=V_{ac}*I_{ac}*Time_{\text{Under Charging}}*($/Wh)</math> | ||
Where: | |||
<math> OBC_{\text{Max Power}}=\text{Power Rating of the onboard charger (KW)}</math> | |||
<math> P_{ac} = \text{AC Power (W)}</math> | |||
<math> V_{ac} = \text{AC Voltage (V)}</math> | |||
<math> I_{ac} = \text{AC Phase current (A)}</math> | |||
<math> PF = \text{Power Factor}</math> | |||
<math> P_{dc} = \text{DC Power (W)}</math> | |||
<math> V_{dc} = \text{Pack DC Voltage (V)}</math> | |||
<math> I_{dc} = \text{DC Current (I)}</math> | |||
<math> SOC = \text{Instantaneous state of charge of the pack (%)}</math> | |||
<math> \text{Pack Capacity} = \text{Total capacity of the pack (Whr)}</math> | |||
<math> R = \text{Total resistance of the high voltage cable}</math> | |||
<math> η = \text{Charging efficiency (includes losses in cables, heating, power conversion, switching etc)}</math> | |||
<math> ΔT = \text{Temperature difference between the pack temperature and ambient (deg C)}</math> | |||
<math> d = \text{Thickness of cooling plate (m)}</math> | |||
<math> K = \text{Conductivity of cooling plate (W/degC*m)}</math> | |||
<math> A = \text{Surface area of cooling plate} (m^2)</math> | |||
<math> N = \text{Number of cooling plates}</math> | |||
<math> Range = \text{Total range of the vehicle}</math> | |||
<math> $/Wh = \text{Electricity cost}</math> | |||
{| class="wikitable" | {| class="wikitable" | ||
| Line 232: | Line 286: | ||
Time to charge completely depends on the pack capacity, grid voltage and AC current sourced by the charger, which in turn depends on pilot duty cycle, on board charger power rating and gird voltage. Substituting values for IAc in the equations below, we get | Time to charge completely depends on the pack capacity, grid voltage and AC current sourced by the charger, which in turn depends on pilot duty cycle, on board charger power rating and gird voltage. Substituting values for IAc in the equations below, we get | ||
<math> \text{Time to charge complete} = ((100-SOC)*\text{Pack Capacity})/(V_{ac}*(min(MAX_{I_{ac}},(OBC_{\text{Max Power}})/V_{ac}))) </math> | |||
<math> \text{Cost} = V_{ac}*(min(MAX_{I_{ac}},(OBC_{\text{Max Power}})/V_{ac}))*\text{TimeUnderCharging}*($/Wh) </math> | |||
<math> I_{dc}=(V_{ac}*(min(MAX_{I_{ac}},(OBC_{\text{Max Power}})/V_{ac}))*PF*η)/V_{dc}*(100\%-\text{derate pct}) </math> | |||
Thus it can be seen that | Thus it can be seen that | ||
| Line 247: | Line 303: | ||
# The temperature difference between ambient and the pack depends on the cooling effectiveness of the system. More cooling plates in the system (N), higher surface area of each cooling plate (A), higher thermal conductivity (K), or thinner plates would aid better heat rejection, thus maintaining the temperature difference as small as possible – keeping the system charging at its maximum capacity. | # The temperature difference between ambient and the pack depends on the cooling effectiveness of the system. More cooling plates in the system (N), higher surface area of each cooling plate (A), higher thermal conductivity (K), or thinner plates would aid better heat rejection, thus maintaining the temperature difference as small as possible – keeping the system charging at its maximum capacity. | ||
[[File: | [[File:Sensitivitych1.png|500px]] | ||
For the sensitivity plot above we assumed a nominal 8 hr charge time for a pack of 100KWh. The plot shows sensitivities of four variables by illustrating how the charge time is affected due to 1% increase in each variable. | |||
The plot below shows the tradespace for different types of on board charger technologies for home charging. The utopia point is minimum charging time for maximum pack size. This tradespace is generated by a simple charging model developed using excel and the technical model illustrated above. | The plot below shows the tradespace for different types of on board charger technologies for home charging. The utopia point is minimum charging time for maximum pack size. This tradespace is generated by a simple charging model developed using excel and the technical model illustrated above. | ||
| Line 261: | Line 319: | ||
[[File:Morph-matrix.png|500px]] | [[File:Morph-matrix.png|500px]] | ||
== | |||
==Financial Model== | |||
Based on the technology assessment and FOM targets for 2040, we have decided to focus the incoming investment on expanding the charging network to achieve 20M charge stations globally by 2040. In addition to that, the target of achieving charging time better than the time needed to fill a tank of gas for a similar ranged vehicle is on the 2040 roadmap. To that extent, we have developed a financial model to show the discounted cash flow. For the purposes of this wiki, the model has been simplified. Below are some of the assumptions of the model | |||
* Initial investment of $400M to be invested in the first 5 years. $100M is allocated each year for the first three years followed by $50M each for the remaining two years. The initial investment is to enhance the technologies for better cooling and faster charging. This investment would also be used in acquiring real estate to realize the charging station deployment plan in the US and outside. | |||
* The cost to build each station is estimated to be $500K. The revenue from the sale of each station is estimated to be $1M. We would see economies of scale, where the COGS will reduce as we deploy more stations in later years. For simplicity for this model, we have considered average values | |||
* The deployment plan to achieve 20M station in the next 20 years is scoped out according to the table below | |||
{| class="wikitable" | |||
|- | |||
! Year!! 2021 !! 2022 !! 2023 !! 2024 !! 2025 !! 2026 !! 2027 !! 2028 !! 2029 !! 2030 !!2031 !! 2032 !! 2033 !! 2034 !! 2035 !!2036 !! 2037 !! 2038 !! 2039 !! 2040 | |||
|- | |||
| Number of Charging Stations || 0 || 0 || 0 || 0 || 0 || 200k || 200k || 400k || 600k || 1000k || 1000k || 1000k || 1000k || 1000k || 1500k || 1500k || 1500k || 1500k || 2000k || 2000k | |||
|} | |||
* Discount rate - 12% | |||
[[File:Dcfch.png|500px]] | |||
[[File:Npvchg.png|500px]] | |||
==Portfolio of R&D Projects and Prototypes== | |||
There are several ongoing projects in the portfolio. The diagram below shows the division of projects into different categories. The size of the circles represents the priority of the project (bigger circle is higher priority) while the color represents the risk (legend is shown in the table below). The table also shows how each project relates to a particular figure of merit. | |||
[[File:Rndprojects.png|350px]] | |||
{| class="wikitable" | |||
|- | |||
! Number !! Project Name !! Project Type !! Priority !! Risk Level !! FOM Improvement | |||
|- | |||
| 1 || Develop high frequency IGBTs || Breakthrough || High || Medium || Charge Time, Efficiency | |||
|- | |||
| 2 || Develop efficient cooling system for extreme fast charging || R&D || High || Medium || Charging Efficiency | |||
|- | |||
| 3 || Wireless charging || Platform || Low || Low || Charging Efficiency | |||
|- | |||
| 4 || Charge station deployment ramp Up|| Platform || High || High || Charging availability per mile | |||
|- | |||
| 5 || Architecting system to support SaaS model || Derivative || Medium|| Low || Charge Cost | |||
|- | |||
| 6 || Expansion to accommodate multiple charging standards || Derivative || Medium || Low || Compatibility | |||
|} | |||
The R&D portfolio of the company is aligned with the figure of merits that our company is aiming to optimize. The two critical figure of merits are - a) number of charging stations deployed and b) time to complete charging. In addition to these, the company has plans to enter the vehicle-to-grid market. So providing bi-directional solutions to balance grid demand using the energy storage in vehicles is also on the roadmap. To summarize, the R&D portfolio consists of the following projects | |||
* '''Project V2X''' - By 2025 the company aims to be a leader in vehicle-2-grid and vehicle-2-load offerings. Vehicle-2-Load offering would enable utility fleets to run their power tools using the on board energy storage. The charging system shall provide 120V, 15A outlet for people to use power tools. The Vehicle-To-Grid project would enable the vehicle owners put additional energy back to the grid. This would result in additional revenue for vehicle owners, where the revenue would be scaled based on the time of the day when energy is supplied to the gird (more $ when grid demand is higher). This proposition would make our product attractive to our customers. | |||
* '''Project xFC''' - By 2030, the company aims to reduce the charging time by 50%. This means, a typical Tesla Model S vehicle will be able to charge in less than 7 minutes. As of today, this vehicle needs up to 15 minutes when charged at the highest possible rate. The power electronics redesign is a demonstrators project where new technologies would have to be implemented to enable the PCBs and chips sustain high values of current over longer periods of time. | |||
{| class="wikitable" | |||
|- | |||
! Project xFC !! 2020 !! 2022 !! 2025 !! 2028 !! 2030 | |||
|- | |||
| Component sizing and modeling || X || || || || | |||
|- | |||
| High pressure cooling plate development|| X || X || || || | |||
|- | |||
| Optimized cooling system for extremely high currents || X || X || || || | |||
|- | |||
| Power electronics for sustaining in-phase high currents || || X || X || || | |||
|- | |||
| Prototype completion || || || || X || | |||
|- | |||
| Verification and Validation || || || || X || X | |||
|- | |||
| Deployment || || || || || X | |||
|} | |||
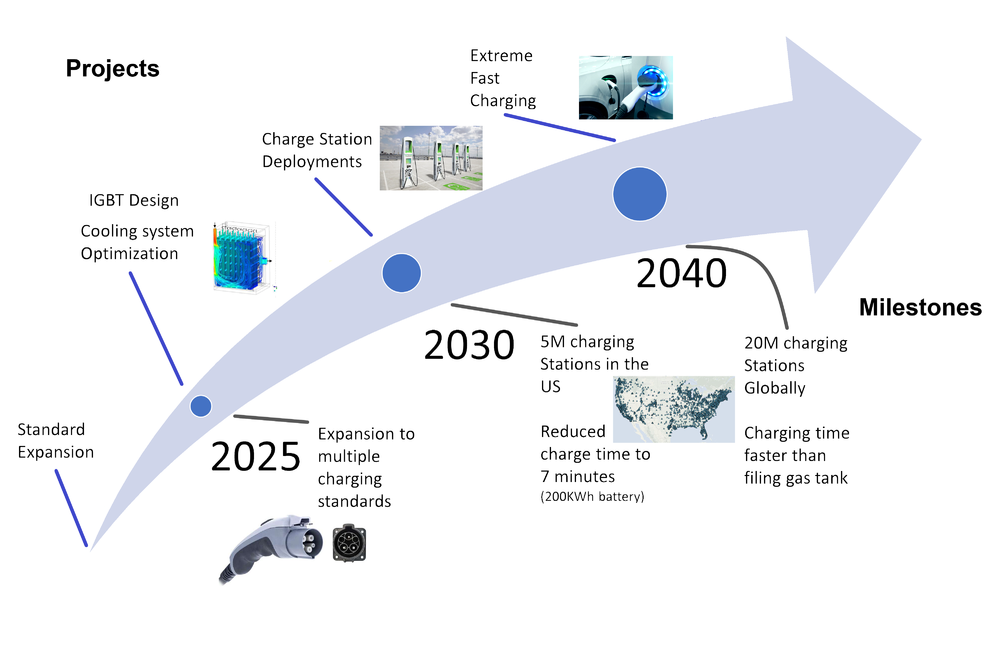
* '''Project ChargeMap''' - EVs and charging infrastructure are critical to efforts to fight global climate change, grow the clean energy economy, and bring innovative technology solutions to market that accelerate the adoption of zero-emission vehicles worldwide. By 2040, it is anticipated that EVs will account for more than half of new vehicles sold around the world (ref-Chargepoint website). By 2030 our company intends to have 5 million charging stations on the interstates. Each charge stop would host 5 charging stations, all of them equipped with fast charging technologies. By 2040, the company aims to reach the same density of charging stops as there are gas stations in the US. The company aims to prioritize interstate roadways for charge station deployments to enable interstate travel. | |||
[[File:Chargemap1.png|500px]] | |||
==Key Publications and Patents== | |||
===Patents=== | ===Patents=== | ||
* '''Managing electric current allocation between charging equipment for charging electric vehicles''' | * '''Managing electric current allocation between charging equipment for charging electric vehicles''' | ||
| Line 326: | Line 456: | ||
This publication gives a snapshot of the state of art charging infrastructure in the US and a projection into 2025. The report goes over electric vehicle adoption trend and charging energy and charge units needed to keep up with increasing deployments of EVs. It also summarizes key sensitivities in charging infrastructure analysis – sensitivities like increased access to home charging on level 1 and level 2, increased non residential charging and their effects on DC fast charging. The report provides inputs on the gaps seen in this market | This publication gives a snapshot of the state of art charging infrastructure in the US and a projection into 2025. The report goes over electric vehicle adoption trend and charging energy and charge units needed to keep up with increasing deployments of EVs. It also summarizes key sensitivities in charging infrastructure analysis – sensitivities like increased access to home charging on level 1 and level 2, increased non residential charging and their effects on DC fast charging. The report provides inputs on the gaps seen in this market | ||
==Technology Strategy Statement== | |||
Our company's R&D targets are aligned with our mission to reduce the range anxiety and facilitate adoption of electric vehicles. To that end, we believe the execution of following strategies would be helpful. | |||
* Reducing the time taken to charge a typical electric vehicle to make it comparable to the time taken to fill a tank of gas. We believe by 2030 we would advance the state of art to reduce the current fastest charging time by half and then by 2040 we would beat the time taken to fill a tank of gas. | |||
* Increasing the number of charging stations - With increasing adoption of EVs, we are targeting to deploy atleat 5 million stations globally by 2030 | |||
* Deploying vehicle-2-grid and smart charging technologies to enabling additional revenue generation within our customer base and cost savings by enabling charging at most efficient hours of the day. | |||
[[File: | [[File:TimelineSwoosh.png|1000px]] | ||
Latest revision as of 04:36, 4 December 2020
EV Charging Technology Roadmap
- 2EVCT - Electric Vehicle Charging Technology
This is a Level 2 roadmap. Level 1 would be the technologies enabling zero-emission transport while Level 3 and 4 would include technologies enabling the charging of electric vehicles.
Roadmap Overview
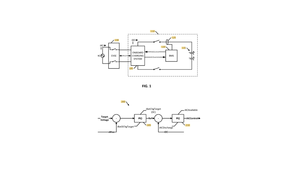
Our chosen technology is that of charging energy storage devices using power from the grid. With the current technology, electric vehicles can be charged using a standard 120V outlet or a 240V industrial outlet. An electric vehicle usually has an onboard charger unit (OBC) which converts AC power into DC to store it in the high voltage battery. The vehicle accepts charge via a charge port where the user can insert the charging plug. The charging plug is a part of a wall-mounted (off-board) unit which is connected to the grid and supplies AC power to the vehicle when the vehicle is ready to accept charge. The user is usually responsible for initiating charging by connecting the vehicle to the off-board unit (EVSE) and optionally keying in a unique id to “unlock” the unit to provide charge. Recent advances in charging technologies have enabled DC fast charging which has resulted in faster charge rates and reduced charging times.
*image-source - https://www.verdemobility.com/charge.html
With today’s technology long-range EVs (200+ mile range) could take as high as 30+ hours to fully charge the battery pack using a regular home outlet. Fast charging technologies have also been developed which can bring the charge time down to a few hours (~2 hours), but these times are still significantly higher than the time needed to fill a fuel tank in a gasoline/ diesel vehicle as shown in the figure below. These would also warrant better cooling technologies to keep optimal battery thermal performance and extend battery lifetime. With the battery cost ($ per KWh or $ per mile) decreasing, we could see a trend of bigger batteries / higher range vehicles being deployed, and an increased rate of adoption of electric vehicles, which would further necessitate faster charging and availability of charge stations. Hence, we feel the current technology would have to be advanced to be able to charge as fast as possible and make charge stations as freely available as gas stations today, thus ultimately reducing range anxiety.
To address some feedback we received from our Midterm presentation and peer reviews on the question: "Why not just swap batteries between the car and the charging station in order to achieve high rates of energy transfer?"
Let's start with a simple model: Cars arrive at the battery swapping station at a certain rate (cars/hour). The batteries are swapped in less than 5 minutes and transferred to a charging station. This station is able to charge the batteries at a certain rate. Then the charged batteries must be stored in order to meet the demand of incoming cars.
Battery swapping is a much higher rate of energy transfer than on vehicle charging, but transferring batteries forces the charging station to carry a high inventory of charging and fully charged batteries. We performed a sensitivity analysis showing the amount of battery inventory a swapping charging station would need in order to satisfy peak cars arriving per hour and the time it takes to charge a battery.
Having this large inventory not only requires a lot of space, it is also inefficient from a business point of view. For each swapping charging station that is built there is an associated fixed inventory cost that can range from 0.5 to multiple millions of dollars for the entire charging station. For a comparison, the maximum fixed inventory of a regular gas station ranges from 0.06 to 0.3 million dollars. A battery was assumed to cost $6,000, which is the current goal that tesla is working towards.
The takeaway: Yes, battery swapping is possible, but it is expensive to implement. There are additional costs for charging infrastructure that scales with the battery inventory. Unlocking fast charging capabilities will significantly reduce the costs associated with a battery swapping charging station or remove the need entirely for battery swapping.
DSM Allocation
The matrix below shows the allocation of technologies at various levels to enable vehicle electrification. The selected technology 2EVCT is shown as a part of the bigger 1VE technology DSM
Technology Hierarchy Tree
The following hierarchy shows the breakdown from L1 Technologies (Vehicle Electrification in general) to L2 - Technologies that need to be developed to achieve vehicle electrification. Further, The 2EVCT decomposes into different technologies that are developed to facilitate electric vehicle charging. L4 technologies are the technologies needed to develop the formal entities of products that enable electric vehicle charging.
Roadmap Model using OPM
We provide an Object-Process-Diagram (OPD) of the 2EVCT roadmap in the figure below. This diagram captures the main product, Its decomposition, and shows the process flow of achieving the desired function (in this case charging the battery pack).
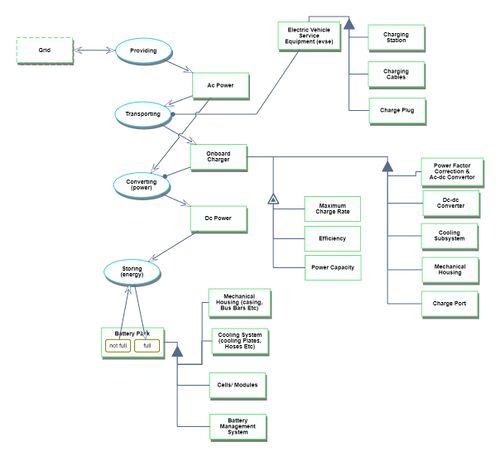
In the charging technology, the EVSE (Electric Vehicle Service Equipment, a.k.a charging station) receives AC power from the grid and transports it to the vehicle's on-board charger. This onboard charger is responsible for converting AC power into DC power and storing it in the high voltage battery. The EVSE can be decomposed into the main charging station, the power lines from the charging station to the vehicle, and the plug that connects to the vehicle's charge port. The onboard charger comprises electronics to correct the power factor and to convert AC power into DC and stores it in a battery pack. It has an associated cooling system to maintain the thermal performance of the unit and mechanical housing to house all the electronics. The high voltage battery comprises of the battery management system, cells, sensors (voltage, current, temperature) along with the associated cooling assembly and mechanical housing to hold everything together. Below is an OPD representation of the system and the associated OPL.
2EVCT Figures of Merit
The table below shows a list of FOMs by which charging of electric vehicles can be quantified and compared
| Figure of Merit | Units | Description |
|---|---|---|
| Charge Rate | [KW/hr] | Total energy/ power added to the battery per unit time |
| Charge Time | [Hrs] | Total time taken to fully charge the battery pack of known KWh capacity |
| Charge Efficiency | [%] | Percent of grid power that is stored in the battery |
| Cost to charge | [$] | Total electricity cost for a full charge cycle at a certain time of the day |
| Charge Power | [KW] | Power rating of the charger (This will determine the magnitude of DC current that the pack will be charged at) |
| Charge Level | [dimensionless] | L1 (120V AC), L2 (240V AC), L3 (Direct Current charging) |
| Charging Stations | [per mile] | Number of charging stations per mile |
| Pack Temperature Rise (normalized to pack size) | [degC/ KWhr] | Rise in temperature of the battery pack after charging is complete |
| Coolant Flow Rate | [gals/hr] | Flow rate required to keep maintain the rise in temperature below a predefined threshold |
| Power Factor | [%] | Ratio between real and reactive power consumption from the grid |
| Pack capacity degradation | [Ah per year] | Reduction in the capacity of the pack after a known number of years due to frequent fast charging |
Charge levels are defined by Level 1, Level 2 and Level 3 (or DC Fast Charging). Level 1 chargers are usually plugged into the home wall outlets and can do up to a 3.3KW. Level 2 chargers are usually outside the commercial establishments and also can be installed in residential homes. These chargers have charge rates varying from 3.3KW to up to 80KW. Level 3 charging, usually called DC Fast charging is the ability to charge the battery pack at rates between 80KW up to 450KW. DC Fast charging significantly rises the pack temperature and hence regular fast charging could accelerate cell degradation and reduce battery life faster than normal.
The most important figures of merit are charge rates, charge times, and charging stations. These directly affect how fast the vehicle can be charged and the availability of charge stations when needed. Charging is also cross dependant on battery pack behavior and hence will only be effective if the pack thermals are within thresholds. This interdependency of charging and pack behavior put a limitation on the technological advancements in charging (without proper cooling, charging technologies with extremely high charge rates would be worthless).
Competitive Landscape
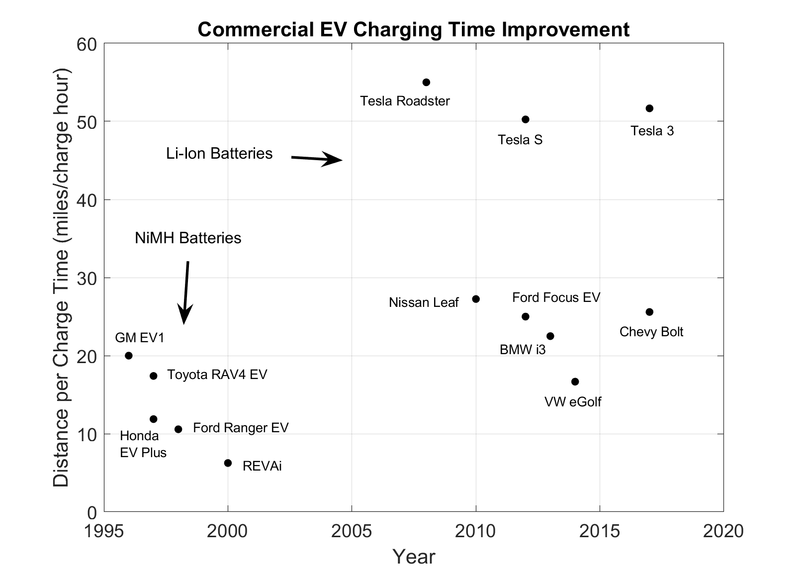
Below is a plot of vehicle charging times normalized by the distance that the vehicle can travel. There was a >2 fold improvement after 2000 when all EV manufacturers switched to Li-Ion batteries. Tesla is able to outperform all other EV companies by over a factor of two (220V charging numbers were used that could typically be done at some homes or at a business. Not a supercharger station.).
As a reference, there are currently 115,000 gas stations in the United States [1]. With electric vehicles, this number is quoted to be larger at (2.5 million World Wide [2]) because of more distributed charging infrastructure located at businesses, parking spots, and also along interstates just like traditional gas stations.
The electric vehicle charging system market is very competitive. As battery costs are coming down, there is a growing competition of deploying charging networks across the country and allowing higher charge rates to decrease the overall charge times. The table below shows the competitive landscape of the players in this industry.
Each company has a unique strategic roadmap. The comparison of multiple charging companies is based on their company strategy. These are evaluated across areas like vision, go-to-market strategy, partnerships, technology, geographic reach, product performance, product portfolio, and pricing.
| Top Contenders | Challengers | Emerging |
|---|---|---|
| Electromotive, ABB, Aerovironment, Better Place, Coulomb Technologies, GE Energy, Schneider Electric | Clipper Creek, Delphi, Eaton, Go Smart, Seimens AG, Add Energie | Chargepoint, Alpha, Brusa, Greenlots, Witricity, WattsNXT, Power Pack, Powerstream, Evatran |
The two main strategic drivers for the charging technology are to bring the charging time down and make charge stations as easily available as there are gas stations today. The following table shows how the roadmap targets for the company are aligned to these drivers.
| Number | Strategic Driver | Alignment to Targets |
|---|---|---|
| 1 | Develop a network of charge stations such that open charging station is as easy to find as a gas station | The charging technology roadmap should target to deploy as many charging stations as there are gas stations (if not more) and optimize their geographic locations like today's gas stations. |
| 2 | Develop charging equipment to bring the charge times comparable to times taken to fill a full tank of gas | The charging technology roadmap should support upwards of 600KW of charging power to enable fast charging of the batteries. |
Charging network deployments
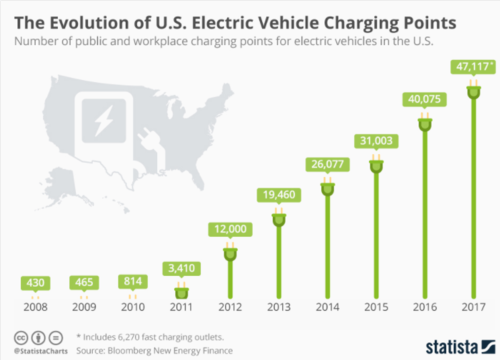
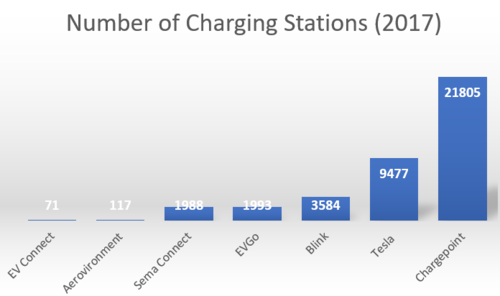
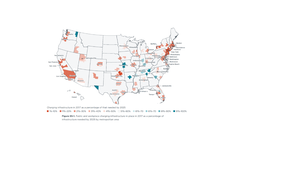
The figure below gives a sense of the rate of charging station deployments over the last several years.
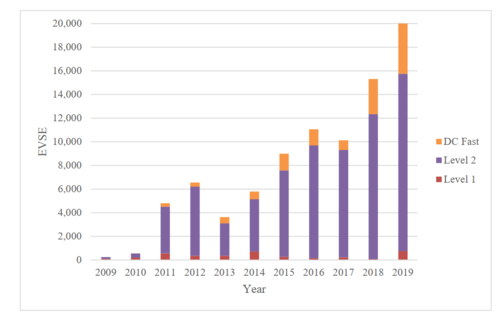
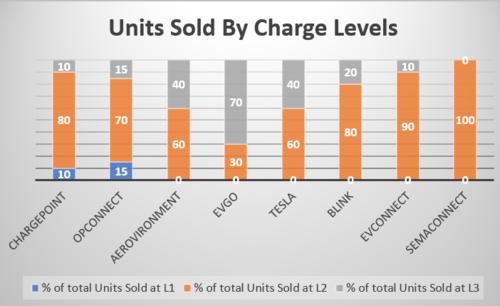
The figure below gives a split between total number of units deployed over the last few years divided by the charging technology.
Dependence on parallel technology roadmaps
Charging at such high rates is going to result in overheating of the battery pack, thus eventually limiting the power flow to keep the pack temperatures in check. To enable an extended period of the high power charging operation, technologies would have to be developed to better cool the battery pack / better reject the heat. This would drive roadmaps for battery pack manufacturers in designing cooling plates for better heat rejection, cell researchers for investigating chemistries that do not accelerate cell degradation under extreme temperatures and vehicle manufacturers to enable better cooling systems (pumps, radiators etc). Thus, this strategic driver in the charging roadmap is limited by the advances in battery technology and the company should be aware of the battery technology roadmaps.
Positioning of the Company vs Competition
This section compares the competition in the EV charging market. The two main figure of merits that the comparison is usually made is a) Total number of stations and b) Rate of charging (Level 1, Level 2, DC Fast Charge)
The pot below gives a sense of investment in the technology from each company. As it can be seen, Tesla splits its resources evenly between fast charging and Level 2 charging. It is natural too assume Tesla not doing L1 charging technology as it would take upwards of 40 hours to fully charge the pack. SemaConnect is investing completely into fast charging networks whereas EVGo's and Chargepoint's most of the deployments are in the L2 charging areas. Chargepoint has a small percent of chargers supporting L1 as well which enables them to expand to the customer base owning smaller EVs.
Technical Model
The figure below shows system level decomposation into to levels. The first being the product level and the second being technology. The charging system comprises of a charging station, battery pack and an on board charger. Each of these products are built using various technologies around cooling systems, structural integrity, controls/ software and electronics/ hardware.
The following are in inputs, outputs and constants assumed for the technical model.
Outputs – (FOMs) – Charge time, Cost to Charge
Inputs
- Pilot waveform Duty cycle (This determines maximum AC current that can be sourced from the charging station) (see lookup table)
- Charging current (IAc, IDc)
- Grid voltage (120V, 240V)
- Pack size (Vdc) (260V, 360V, 400V..)
- Number of cooling plates (directly affects amount of heat rejection) (2,5,10)
Constants
- Area of the cooling plate
- Charge conversion efficiency (in this model, this is kept constant, but this can also be an output / figure of merit, if the technology is to be assessed to maximize charging efficiency) (95%)
- Power Factor (95%)
- Amount of safety derating due to over heating (see lookup table)
- OBC Max Power (6.6KW)
System Model The system is modeled to compute the charge time and the cost to charge the pack giving the inputs and constants as mentioned above. The Charging current is usually the minimum between the maximum current the charging station can supply and the amount that can be sourced from the wall based off the power rating of the on board charger.
Charging Current :
<math> I_{ac}=\min[({OBC}_{\text{Max Power}}/{V_{ac}}),{Max}{I_{ac}}] </math>
<math> P_{ac}=V_{ac}*I_{ac}*PF </math>
<math> P_{dc}=V_{dc}*I_{dc}</math>
Using conservation of energy
<math> I_{dc}=(V_{ac}*I_{ac}*PF*η)/(V_{dc}*(100\%-\text{Derate Percent}))</math>
The charging profile is usually Constant Current Charging until the pack voltage reaches 95% of the max voltage value after which the charging is done at Constant Voltage. The derate_pct will cutback the amount of charging current for safety reasons in relation to
- increasing temperature or the charger
- increasing temperature of the pack (only this is considered for the model for simplicity)
- state of charge/nominal voltage of the pack
The pack temperature rise due to this charging event would be dependent on the heat rejection ability of the cooling plates inside the pack due to conduction. The rise can be expressed as
<math> ΔT=Q*d/(N*K*A)</math>
Conductive Losses can be modeled as
<math> Q_{loss}=I_{dc}^2*R</math>
Time taken for charge complete can be expressed as a ratio of remaining energy and charge rate.
<math> Time_{\text{charge complete}}=((100\%-SOC)*\text{Pack Capacity})/(V_{ac}*I_{ac})</math>
Miles added due to charging can be expressed as a percent of total range of the vehicle. (Meaning if 100% charge yields “Range” miles, then a vehicle charged to SOC% would yield miles expressed by the formula below):
<math> \text{Miles added}=Range*SOC</math>
Cost of charging can be expressed as:
<math> Cost=V_{ac}*I_{ac}*Time_{\text{Under Charging}}*($/Wh)</math>
Where:
<math> OBC_{\text{Max Power}}=\text{Power Rating of the onboard charger (KW)}</math>
<math> P_{ac} = \text{AC Power (W)}</math>
<math> V_{ac} = \text{AC Voltage (V)}</math>
<math> I_{ac} = \text{AC Phase current (A)}</math>
<math> PF = \text{Power Factor}</math>
<math> P_{dc} = \text{DC Power (W)}</math>
<math> V_{dc} = \text{Pack DC Voltage (V)}</math>
<math> I_{dc} = \text{DC Current (I)}</math>
<math> SOC = \text{Instantaneous state of charge of the pack (%)}</math>
<math> \text{Pack Capacity} = \text{Total capacity of the pack (Whr)}</math>
<math> R = \text{Total resistance of the high voltage cable}</math>
<math> η = \text{Charging efficiency (includes losses in cables, heating, power conversion, switching etc)}</math>
<math> ΔT = \text{Temperature difference between the pack temperature and ambient (deg C)}</math>
<math> d = \text{Thickness of cooling plate (m)}</math>
<math> K = \text{Conductivity of cooling plate (W/degC*m)}</math>
<math> A = \text{Surface area of cooling plate} (m^2)</math>
<math> N = \text{Number of cooling plates}</math>
<math> Range = \text{Total range of the vehicle}</math>
<math> $/Wh = \text{Electricity cost}</math>
| PILOT Duty cycle | Max_IAc (Amps) |
|---|---|
| 10% | 6 |
| 30% | 18 |
| 50% | 30 |
| 80% | 48 |
| 96% | 80 |
| Temperature Difference (Pack and Ambient) | Current Derate % |
|---|---|
| 0C | 0 |
| 30C | 30% |
| 60C | 90% |
| 65C | 100% |
Sensitivity Analysis
Time to charge completely depends on the pack capacity, grid voltage and AC current sourced by the charger, which in turn depends on pilot duty cycle, on board charger power rating and gird voltage. Substituting values for IAc in the equations below, we get
<math> \text{Time to charge complete} = ((100-SOC)*\text{Pack Capacity})/(V_{ac}*(min(MAX_{I_{ac}},(OBC_{\text{Max Power}})/V_{ac}))) </math>
<math> \text{Cost} = V_{ac}*(min(MAX_{I_{ac}},(OBC_{\text{Max Power}})/V_{ac}))*\text{TimeUnderCharging}*($/Wh) </math>
<math> I_{dc}=(V_{ac}*(min(MAX_{I_{ac}},(OBC_{\text{Max Power}})/V_{ac}))*PF*η)/V_{dc}*(100\%-\text{derate pct}) </math>
Thus it can be seen that
- Going from 120V (normal wall outlet) to 240V (industrial outlet), doubles the AC charging current and reduces the charge time by half (other factors remaining constant)
- Charge time also depends on the pack capacity. A pack of half the capacity would charge in half of the time
- The cost, on the other hand, would remain the same if charging is performed at 240V compared to 120V as at 240V as effectively the user is putting same amount of power into the vehicle.
- The cost to charge would depend on the electricity rates though. E.g At night time $/Wh would be much lower than during noon time.
- The DC current is inversely proportional to the pack size. Ie If the nominal voltage of the pack is lower, the pack can be charged at higher DC current for the given wall power.
- The rate of charging (and hence effectively charge time) also depends on the difference between ambient and pack temperature. Higher the difference, the control algorithm would derate the power put into the pack, which would result in lower Idc, and hence higher charge time.
- The temperature difference between ambient and the pack depends on the cooling effectiveness of the system. More cooling plates in the system (N), higher surface area of each cooling plate (A), higher thermal conductivity (K), or thinner plates would aid better heat rejection, thus maintaining the temperature difference as small as possible – keeping the system charging at its maximum capacity.
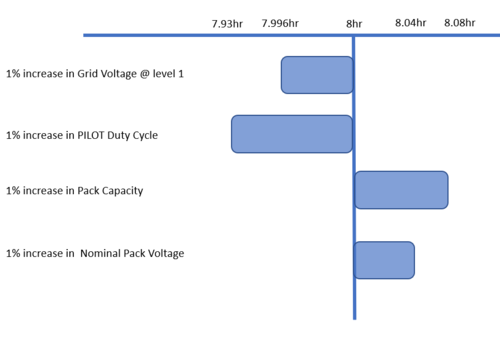
For the sensitivity plot above we assumed a nominal 8 hr charge time for a pack of 100KWh. The plot shows sensitivities of four variables by illustrating how the charge time is affected due to 1% increase in each variable.
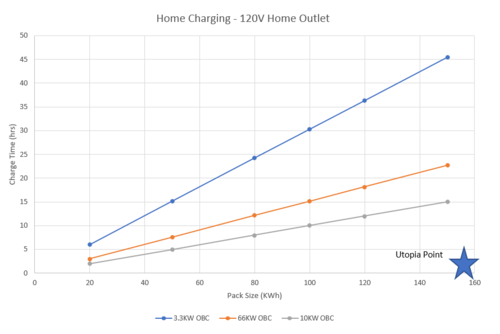
The plot below shows the tradespace for different types of on board charger technologies for home charging. The utopia point is minimum charging time for maximum pack size. This tradespace is generated by a simple charging model developed using excel and the technical model illustrated above.
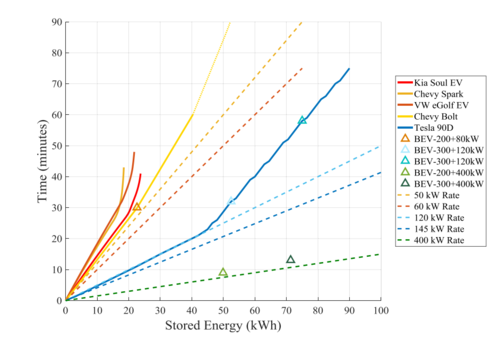
The plot below shows a similar tradespace from literature*. This plot compares charge times for various sizes of energy storage devices, multiple charge rates and overlays typical EVs in the market.
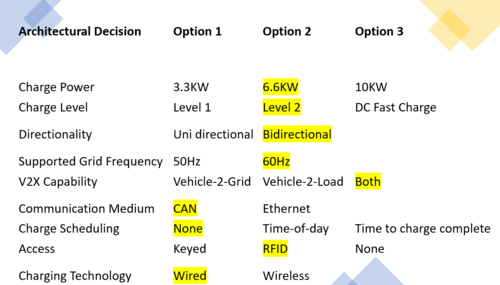
The figure below shows a morphological matrix of architectural decisions that can result in unique architectural choices. The highlighted combination represents one such choice of charging technology.
Financial Model
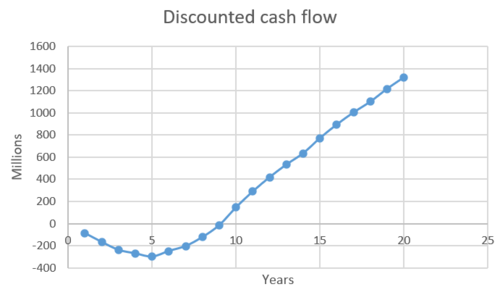
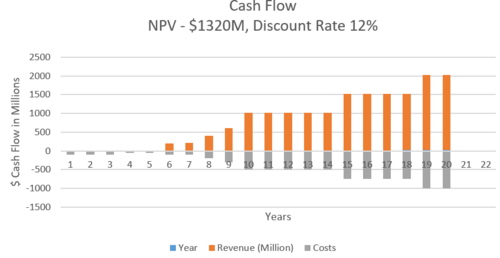
Based on the technology assessment and FOM targets for 2040, we have decided to focus the incoming investment on expanding the charging network to achieve 20M charge stations globally by 2040. In addition to that, the target of achieving charging time better than the time needed to fill a tank of gas for a similar ranged vehicle is on the 2040 roadmap. To that extent, we have developed a financial model to show the discounted cash flow. For the purposes of this wiki, the model has been simplified. Below are some of the assumptions of the model
- Initial investment of $400M to be invested in the first 5 years. $100M is allocated each year for the first three years followed by $50M each for the remaining two years. The initial investment is to enhance the technologies for better cooling and faster charging. This investment would also be used in acquiring real estate to realize the charging station deployment plan in the US and outside.
- The cost to build each station is estimated to be $500K. The revenue from the sale of each station is estimated to be $1M. We would see economies of scale, where the COGS will reduce as we deploy more stations in later years. For simplicity for this model, we have considered average values
- The deployment plan to achieve 20M station in the next 20 years is scoped out according to the table below
| Year | 2021 | 2022 | 2023 | 2024 | 2025 | 2026 | 2027 | 2028 | 2029 | 2030 | 2031 | 2032 | 2033 | 2034 | 2035 | 2036 | 2037 | 2038 | 2039 | 2040 |
|---|---|---|---|---|---|---|---|---|---|---|---|---|---|---|---|---|---|---|---|---|
| Number of Charging Stations | 0 | 0 | 0 | 0 | 0 | 200k | 200k | 400k | 600k | 1000k | 1000k | 1000k | 1000k | 1000k | 1500k | 1500k | 1500k | 1500k | 2000k | 2000k |
- Discount rate - 12%
Portfolio of R&D Projects and Prototypes
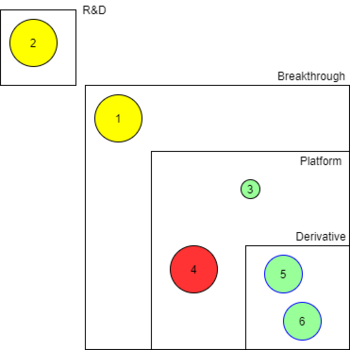
There are several ongoing projects in the portfolio. The diagram below shows the division of projects into different categories. The size of the circles represents the priority of the project (bigger circle is higher priority) while the color represents the risk (legend is shown in the table below). The table also shows how each project relates to a particular figure of merit.
| Number | Project Name | Project Type | Priority | Risk Level | FOM Improvement |
|---|---|---|---|---|---|
| 1 | Develop high frequency IGBTs | Breakthrough | High | Medium | Charge Time, Efficiency |
| 2 | Develop efficient cooling system for extreme fast charging | R&D | High | Medium | Charging Efficiency |
| 3 | Wireless charging | Platform | Low | Low | Charging Efficiency |
| 4 | Charge station deployment ramp Up | Platform | High | High | Charging availability per mile |
| 5 | Architecting system to support SaaS model | Derivative | Medium | Low | Charge Cost |
| 6 | Expansion to accommodate multiple charging standards | Derivative | Medium | Low | Compatibility |
The R&D portfolio of the company is aligned with the figure of merits that our company is aiming to optimize. The two critical figure of merits are - a) number of charging stations deployed and b) time to complete charging. In addition to these, the company has plans to enter the vehicle-to-grid market. So providing bi-directional solutions to balance grid demand using the energy storage in vehicles is also on the roadmap. To summarize, the R&D portfolio consists of the following projects
- Project V2X - By 2025 the company aims to be a leader in vehicle-2-grid and vehicle-2-load offerings. Vehicle-2-Load offering would enable utility fleets to run their power tools using the on board energy storage. The charging system shall provide 120V, 15A outlet for people to use power tools. The Vehicle-To-Grid project would enable the vehicle owners put additional energy back to the grid. This would result in additional revenue for vehicle owners, where the revenue would be scaled based on the time of the day when energy is supplied to the gird (more $ when grid demand is higher). This proposition would make our product attractive to our customers.
- Project xFC - By 2030, the company aims to reduce the charging time by 50%. This means, a typical Tesla Model S vehicle will be able to charge in less than 7 minutes. As of today, this vehicle needs up to 15 minutes when charged at the highest possible rate. The power electronics redesign is a demonstrators project where new technologies would have to be implemented to enable the PCBs and chips sustain high values of current over longer periods of time.
| Project xFC | 2020 | 2022 | 2025 | 2028 | 2030 |
|---|---|---|---|---|---|
| Component sizing and modeling | X | ||||
| High pressure cooling plate development | X | X | |||
| Optimized cooling system for extremely high currents | X | X | |||
| Power electronics for sustaining in-phase high currents | X | X | |||
| Prototype completion | X | ||||
| Verification and Validation | X | X | |||
| Deployment | X |
- Project ChargeMap - EVs and charging infrastructure are critical to efforts to fight global climate change, grow the clean energy economy, and bring innovative technology solutions to market that accelerate the adoption of zero-emission vehicles worldwide. By 2040, it is anticipated that EVs will account for more than half of new vehicles sold around the world (ref-Chargepoint website). By 2030 our company intends to have 5 million charging stations on the interstates. Each charge stop would host 5 charging stations, all of them equipped with fast charging technologies. By 2040, the company aims to reach the same density of charging stops as there are gas stations in the US. The company aims to prioritize interstate roadways for charge station deployments to enable interstate travel.
Key Publications and Patents
Patents
- Managing electric current allocation between charging equipment for charging electric vehicles
Assignee – Chargepoint Inc Inventors – David Baxter, Carl Hagenmaier Jr., Milton Tormey, Richard Lowenthal
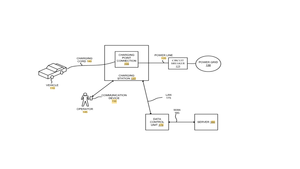
The total amount of current drawn through multiple charging stations that are wired on a same electrical circuit should not exceed a maximum amount of electric current supported by the electrical circuit to prevent the electrical circuit from being overloaded. This is achieved by communicating the current limits to the electric vehicles connected to the stations to not exceed individual current limits. The charging stations are to be connected with each other to share this current consumption data by multiple vehicles such that the total current from the grid is modulated to not exceed the limit.
- Detecting and responding to unexpected electric vehicle charging disconnections
Assignee – Chargepoint, Inc Inventors - David Baxter, James Solomon., Milton Tormey, Richard Lowenthal
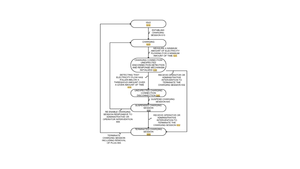
It is important to detect and respond to unexpected electric vehicle charging disconnections. This is necessary to properly notify the stakeholders so that proper action could be taken and to eliminate safety hazards of having live voltage exposed to the environment. An electrical vehicle charging station establishes a charging session with an electric vehicle which includes energizing a power receptacle in the station While the charging session is established and responsive to detecting that a charging connection between the electric vehicle and the electric vehicle charging station has been unexpectedly disconnected, the power receptacle is de-energized to prevent electricity from flowing through the charging cord.
- AC current control of mobile battery chargers
Assignee – Tesla Inventors – Anil Paryani, Troy Nergaard, Andrew Baglino
A charging system and method that improves utilization of available AC power during onboard charging of energy storage systems of electric vehicles. In a charging method for an energy storage system of an electric vehicle using an AC power source, includes a) establishing a maximum DC charging current for the energy storage system responsive to a control signal indicating real-time available current/power from the AC source; and b) controlling a charging system to provide an actual DC charging current, up to the maximum DC charging current, to the energy storage system.
- Charge rate optimization
Assignee – Tesla Inventors – Kurt Kelty, Clay Kishiyama
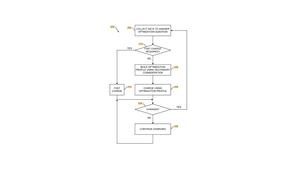
It is important to optimize the charging profiles so as to reduce the charging time while maintaining battery thermals, cell degradation etc. This patent describes a system of transferring charging energy from the charging station to the battery pack at a maximum fast charge rate in a first operational mode and at a slower charge rate in a second operational mode; a data collection system acquiring a set of data indicating a state of charge (SOC) of the battery pack and one or more desired charge optimization parameters; and a station control, responsive to the set of data and to the desired charge optimization parameters, automatically establishing a charging profile for the battery pack to assert a control signal and operate the charging station in the second operational mode whenever the charging station is able to transfer sufficient energy to the battery pack at the slower charge rate to meet an SOC target and a charge completion time target, otherwise asserting the control signal and operate the charging station in the first operational mode
- Configurable battery pack for fast charge
Assignee – Rivian Automotive Inventor – Mason Verbrdge
Advances in charging technologies are coupled with advances in battery/ energy storage technologies. Pushing the boundaries of energy storage systems would open up more avenues of better/ more optimal charging. A configurable battery system may be arranged in such a way that two battery modules are connected in parallel to achieve a target maximum voltage for a load, or in series to achieve a high voltage of about double the target maximum voltage. Fast charging, at high voltage, may allow both battery modules to be charged at a charging current near a desired maximum current at the battery charger. A battery management module determines a switch configuration, coupling the battery modules in series or parallel. The battery management module applies the switch configuration to one or more switches to manage charging of the battery modules. The battery management module may receive charger capability information, local charging information, and fault information to aid in determining a switch configuration.
Publications
- Enabling Fast Charging – Vehicle Considerations
Andrew Meintz, et al., Journal of Power Sources, 2017
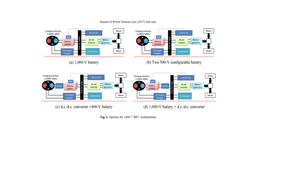
To achieve a successful increase in the plug-in battery electric vehicle (BEV) market, it is anticipated that a significant improvement in battery performance is required to increase the range that BEVs can travel and the rate at which they can be recharged. While the range that BEVs can travel on a single recharge is improving, the recharge rate is still much slower than the refueling rate of conventional internal combustion engine vehicles. To achieve comparable recharge times, this publication explores the vehicle considerations of charge rates of at least 400 kW. Faster recharge is expected to significantly mitigate the perceived deficiencies for long-distance transportation, to provide alternative charging in densely populated areas where overnight charging at home may not be possible, and to reduce range anxiety for travel within a city when unplanned charging may be required. This substantial increase in charging rate is expected to create technical issues in the design of the battery system and the vehicle's electrical architecture that must be resolved. This publication focuses on vehicle system design and total recharge time to meet the goals of implementing improved charge rates and the impacts of these expected increases on system voltage and vehicle components.
The paper goes over fast charging impacts on power electronics, vehicle thermal system impacts, impacts on increased insulation and creepage requirements, fusing, accurate SOC predictions at very high charging currents, charging interface and impacts on cyber security
- Evaluation of Fast Charging Efficiency under Extreme Temperatures
Germana Trentadue et al. European Commission, Joint Research Center Directorate C Energy, Transport and Climate, July 2018
Multi-type fast charging stations are being deployed over Europe as electric vehicle adoption becomes more popular. The growth of an electrical charging infrastructure in different countries poses different challenges related to its installation. One of these challenges is related to weather conditions that are extremely heterogeneous due to different latitudes, in which fast charging stations are located and whose impact on the charging performance is often neglected or unknown. This publication focuses on the evaluation of the electric vehicle (EV) charging process with fast charging devices (up to 50 kW) at ambient (25 ◦C) and at extreme temperatures (−25 ◦C, −15 ◦C, +40 ◦C).
As part of the study, three phase voltages and currents at the wall socket, where the charger was connected, as well as voltage and current at the plug connection between the charger and vehicle is recorded. According to SAE J2894/1, the power conversion efficiency during the charging process has been calculated as the ratio between the instantaneous DC power delivered to the vehicle and the instantaneous AC power supplied from the grid in order to test the performance of the charger. The inverse of the efficiency of the charging process, i.e., a kind of energy return ratio (ERR), has been calculated as the ratio between the AC energy supplied by the grid to the electric vehicle supply equipment (EVSE) and the energy delivered to the vehicle’s battery. The evaluation has shown a varied scenario, confirming the efficiency values declared by the manufacturers at ambient temperature and reporting lower energy efficiencies at extreme temperatures, due to lower requested and, thus, delivered power levels. The lowest and highest power conversion efficiencies of 39% and 93% were observed at −25 ◦C and ambient temperature (+25 ◦C), respectively
- Quantifying electric vehicle charging infrastructure gap across US markets
Dale Hall, Nicholas Lutsey, Technical Report, Internaltional council of clean transportation. January 2019.
This publication gives a snapshot of the state of art charging infrastructure in the US and a projection into 2025. The report goes over electric vehicle adoption trend and charging energy and charge units needed to keep up with increasing deployments of EVs. It also summarizes key sensitivities in charging infrastructure analysis – sensitivities like increased access to home charging on level 1 and level 2, increased non residential charging and their effects on DC fast charging. The report provides inputs on the gaps seen in this market
Technology Strategy Statement
Our company's R&D targets are aligned with our mission to reduce the range anxiety and facilitate adoption of electric vehicles. To that end, we believe the execution of following strategies would be helpful.
- Reducing the time taken to charge a typical electric vehicle to make it comparable to the time taken to fill a tank of gas. We believe by 2030 we would advance the state of art to reduce the current fastest charging time by half and then by 2040 we would beat the time taken to fill a tank of gas.
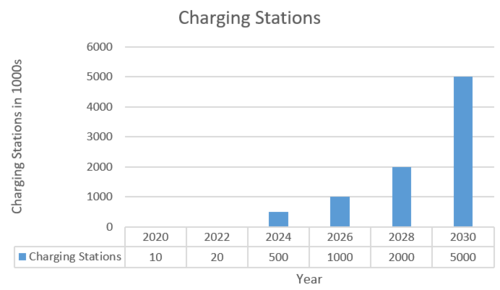
- Increasing the number of charging stations - With increasing adoption of EVs, we are targeting to deploy atleat 5 million stations globally by 2030
- Deploying vehicle-2-grid and smart charging technologies to enabling additional revenue generation within our customer base and cost savings by enabling charging at most efficient hours of the day.
