Difference between revisions of "Earth Observation Satellites"
| (11 intermediate revisions by 2 users not shown) | |||
| Line 168: | Line 168: | ||
* Hardware unit sales account for 60% of total revenue | * Hardware unit sales account for 60% of total revenue | ||
* Customer service sales account for 40% of total revenue and is a function of units sold | * Customer service sales account for 40% of total revenue and is a function of units sold | ||
* Roughly 200 units are sold annually in year 0 and all of them sell at the same price | |||
* 4% year over year growth in unit sales | * 4% year over year growth in unit sales | ||
* 2% year over year rate of inflation, impacting the sales revenue per unit and the customer service revenue per unit | * 2% year over year rate of inflation, impacting the sales revenue per unit and the customer service revenue per unit | ||
* The terminal value of the company can be estimated as a perpetuity of the final year with the expected annual growth rate of 4% and a discount rate of 10%. The value of the perpetuity can be discounted from the penultimate year of the model. | |||
Costs: | Costs: | ||
| Line 176: | Line 178: | ||
* Selling, general, and administrative is ~15% total revenue | * Selling, general, and administrative is ~15% total revenue | ||
* Interest is incurred at a fixed $500,000 per year | * Interest is incurred at a fixed $500,000 per year | ||
* A tax rate of | * A tax rate of 10% | ||
* A discount rate of 10% as this is not particularly high-risk technology | * A discount rate of 10% as this is not particularly high-risk technology | ||
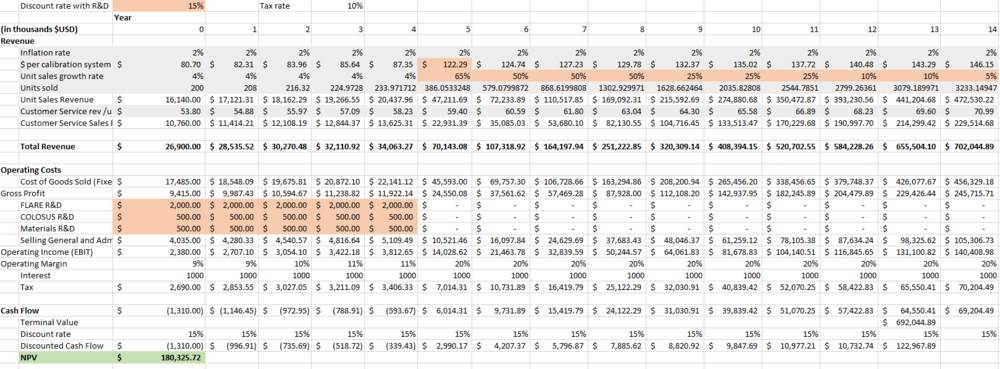
These assumptions are modeled in the proforma income statement below | These assumptions are modeled in the proforma income statement below. | ||
[[File:Financial model baseline baseline.png|center|1000px|Pro forma income statement for Labsphere as a fully operational company]] | |||
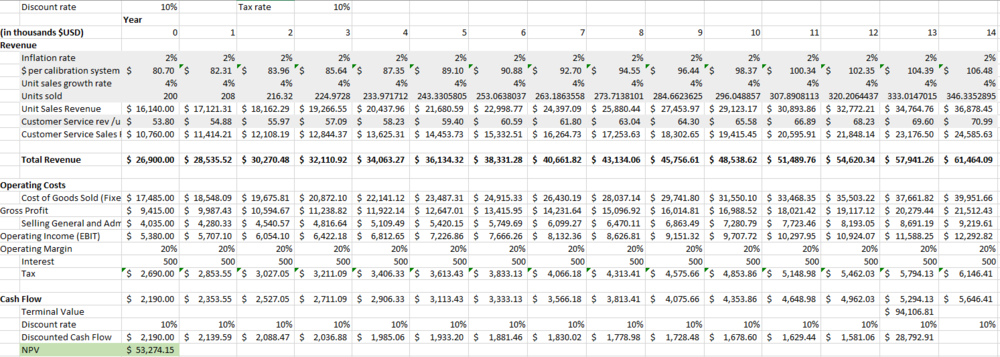
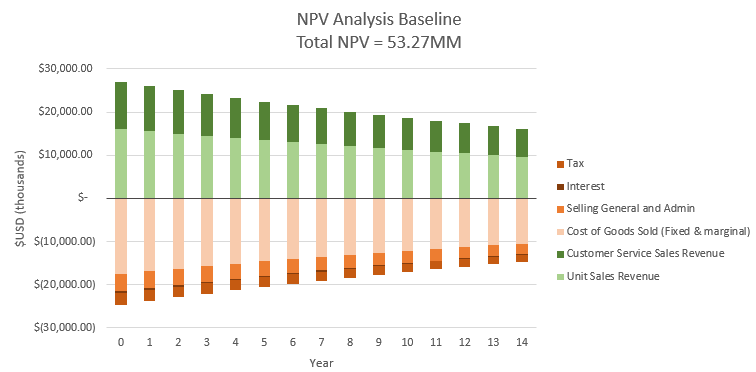
As is clear from the income statement above, the NPV of the baseline business model is $53.27 million USD. To better illustrate the drivers behind this NPV analysis, a discounted cash flow analysis for each year has been included below. | |||
[[File:NPV analysis LabSphere baseline.png|center|800px|Discounted Cash Flow Analysis annual break down. Total NPV = $53.27 million USD ]] | |||
The primary take away from this activity is that the Labsphere business model continues to be profitable and have a positive net present value. It is important to note the uncertainty introduced into the model by the assumptions, such as the revenue breakdown and units sold. It is also important to highlight this model does not correct for any impacts of R&D that may currently be implicitly included in the 2018 estimated revenue and therefore the outcome of the model. | |||
===Delta Net Present Value Analysis=== | ===Delta Net Present Value Analysis=== | ||
A Discounted Cash Flow and Net Present Value (NPV) Analysis was conducted for LabSphere incorporating R&D investments from their [[Earth_Observation_Satellites#List_of_R.26D_Projects|R&D investment portfolio]]. LabSphere's primary research investment is in the FLARE program which they have considerable industry interests in that they are working to convert to sales. This pro forma financial model is based on the baseline model above and the following assumptions: | |||
Revenue: | |||
* Returns on R&D investments will begin in year 5 | |||
* A 40% increase in average price per calibration system can be expected given the nature of the new FLARE program | |||
* A 65% increase in units sales in year 5, 50% increase in years 6-8, 25% increase in years 9-11, a 10% increase in years 12-13, and a 5% increase indefinitely | |||
Costs: | |||
* A total of 10% of revenue reinvested into R&D (~$3 million per year) for 5 years divided between the 3 R&D investments included in the [[Earth_Observation_Satellites#List_of_R.26D_Projects|R&D investment portfolio]] | |||
** FLARE is the primary investment with $2 million per year | |||
** COLOSUS and Materials split the remaining R&D budget with $500k per year | |||
* A discount rate of 15% given the increased risk associated with R&D development | |||
These assumptions are modeled in the R&D proforma income statement below. | |||
[[File:Financial model delta.png|center|1000px|Proforma income statement for Labsphere including R&D investments ]] | |||
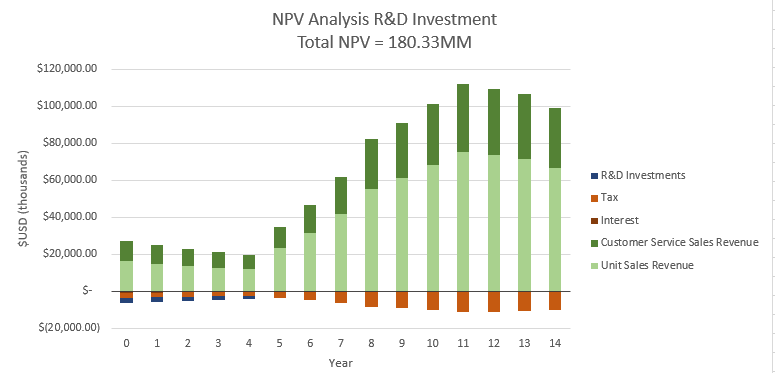
As is clear from the income statement above, the NPV of the baseline business model is $180.325 million USD, a considerable increase from the baseline NPV of $53 million. To better illustrate the drivers behind this NPV analysis, a discounted cash flow analysis for each year has been included below. | |||
[[File:NPV analysis LabSphere delta.png|center|800px|Discounted Cash Flow Analysis annual break down inclusing R&D investments. Total NPV = $180.33 million USD ]] | |||
Assuming LabSphere is able to convert industry interest to sales and the projected revenue growth holds, there is a $127 million delta in NPV, a considerable benefit from investing in their R&D portfolio. | |||
==List of R&D Projects== | ==List of R&D Projects== | ||
Latest revision as of 20:42, 29 November 2020
Technology Roadmap Sections and Deliverables
Roadmap Overview
This technology roadmap is a level 2 assessment of earth observation satellites (EOS). Earth observation satellites are one of the latest applications of remote sensing.
Remote sensing is the process of observing an object or phenomenon without making physical contact and it can be traced back to World War I, when aircraft were used for military surveillance and reconnaissance. In the last 15 years, technological advancements enabling the miniaturization of processing components and hardware mechanisms have given birth to small satellites. These small satellites are becoming commoditized as production lead times, the price of commercial off the shelf (COTS) components, and manufacturing and launch costs begin to fall. The combination of these factors with increasing demands for big data to feed machine learning and artificial intelligence algorithms is creating a rapidly growing market need for remote sensing in low earth orbit (LEO).
This roadmap will walk through the next steps for innovation in remote sensing by earth observation satellites.
Design Structure Matrix (DSM) Allocation
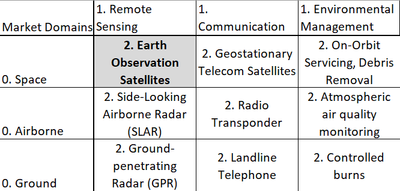
We have designated Earth Observation Satellites (2EOS) as a Level-2 Technology. It is present in the Level 1 Markets of 1) Low-Earth Orbital Technologies and Remote Sensing Technologies. For other examples of intersections on the basis of these markets, see the following figure:
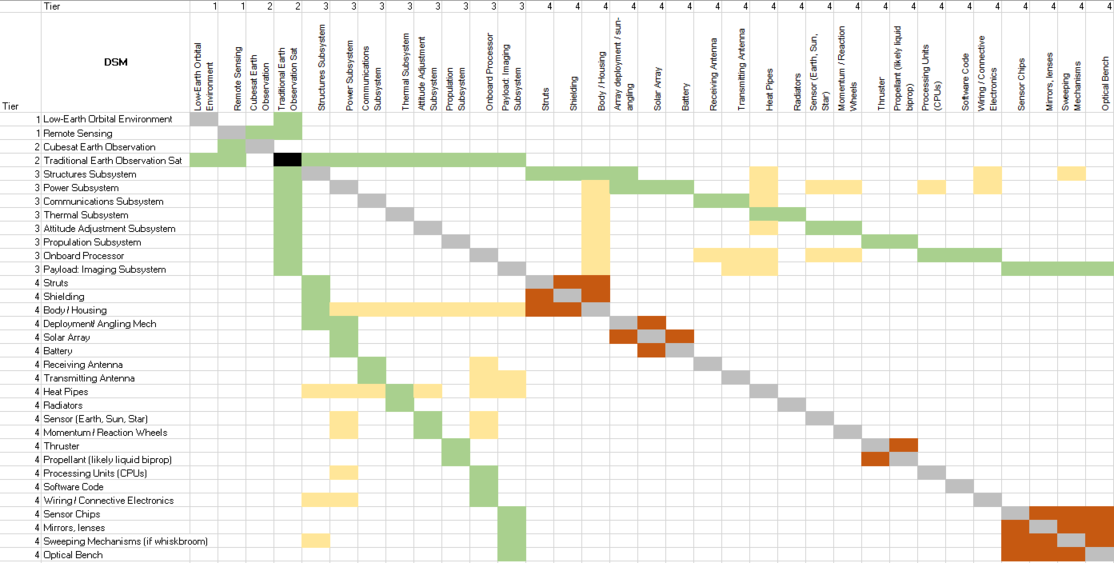
Our Design Structure Matrix (DSM) is as follows:
Legend: Green: Direct Component (solar arrays are a component of the Power Subsystem) Yellow: Cross-relationships between technologies and other subsystems (heat pipes interact with all other subsystems to transfer heat) Orange: Physical interactions between Level four technologies within the same subsystem (solar arrays interact with any deployment and angling mechanisms)
Roadmap Model using OPM
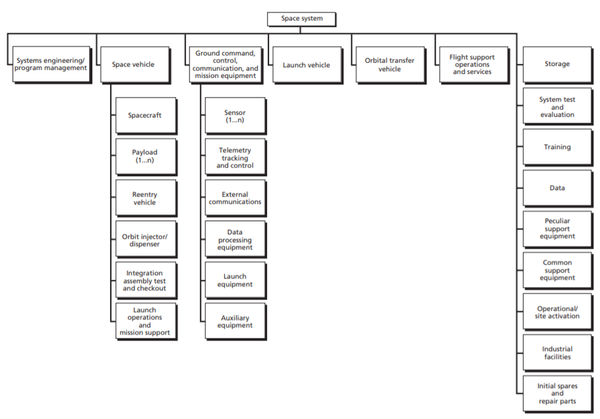
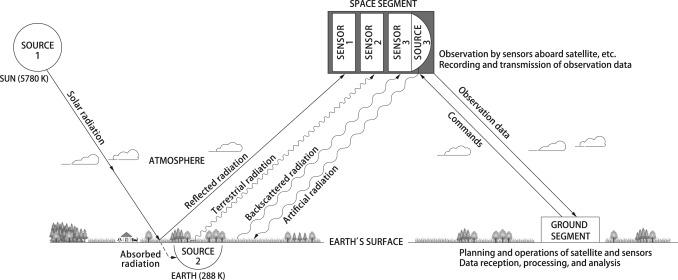
To begin, we have reproduced a diagram from the RAND Corporation showing the broader context of any space system, as a Level 1 technology, or perhaps even more appropriately, an entire Level 0 technological market domain. (Source: Bernard Fox, Kevin Brancato, Brien Alkire's 2008 "Guidelines and Metrics for Assessing Space System Cost Estimates") Many of the elements included here, such as launch vehicle and ground segment facilities are far outside of the scope of our analysis.
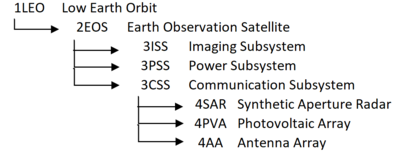
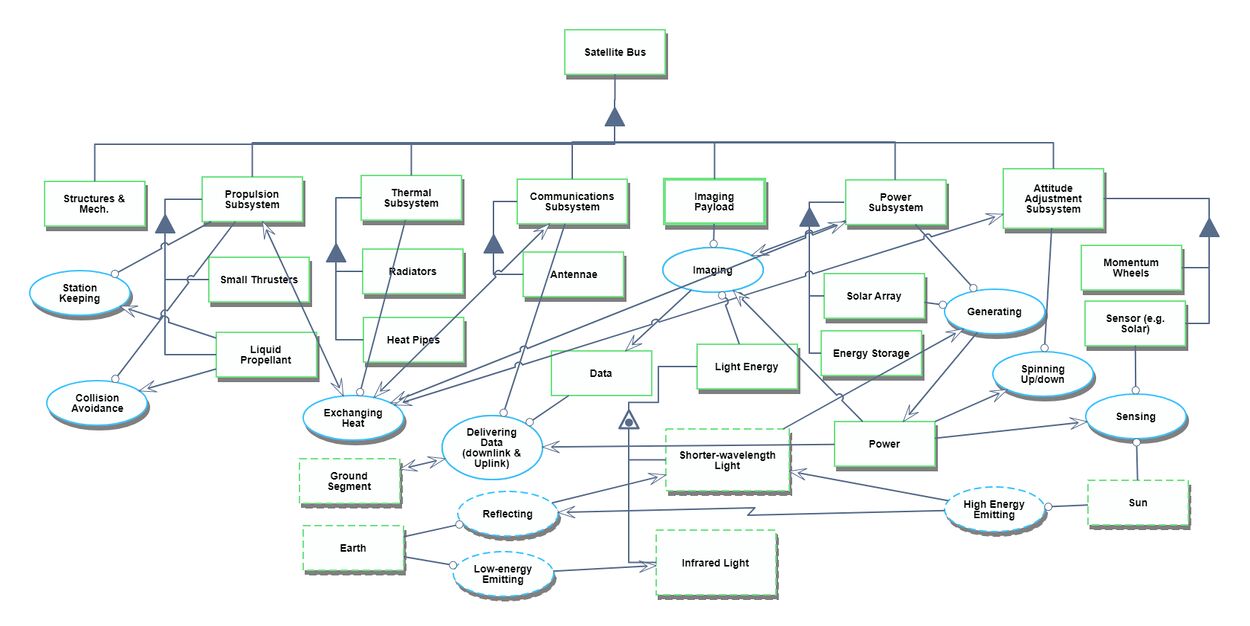
Our Object Process Diagram (OPD) for the Level 2 Technology 2EOS is pictured below, created using OPCloud. This can be considered a rough equivalent to a zoom view to the "spacecraft" box, under the subheading "space vehicle" in the RAND diagram above.
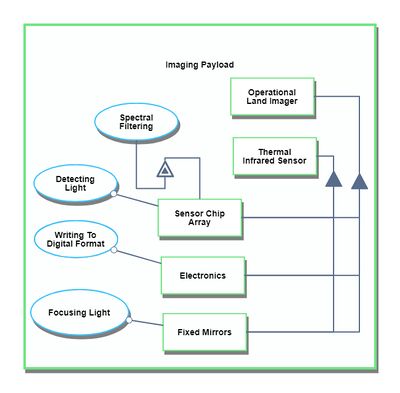
Next, we show another Level Zoom to examine components of the Imaging Subsystem in greater depth, using Landsat 8's imaging payload as an example. The subcomponents of the imaging subsystem, such as a sensor chip array, are highly specified Level 4 technologies.
Figures of Merit (FOMs)
Several relevant Figures of Merit exist for Earth Observation Satellites. The imaging system in particular is constrained by four types of resolution:
- Spatial [m]
- Spectral [nm]
- Temporal [days] (also called revisit period)
- Radiometric [bits]
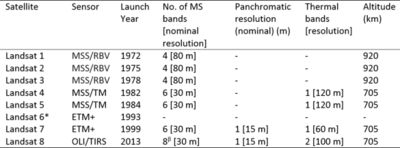
We will consider spatial resolution as principle among these, for most applications, including surveying, land management, urban planning, and disaster relief. Some hard tradeoffs exist between these. Generally, spatial resolution decreases with increasing spectral resolution; a minimum threshold of energy must reach the imaging sensor in order to resolve an image, and the smaller the band of electromagnetic radiation considered, the less power received. Wider accepted bands (panchromatic) have more difficulty discerning color and material reflectivity, but gain in spatial resolution. The following figures show estimations of the improvement in spatial resolution over time. For further discussion of trade-offs between types of resolution, see Technical Model: Morphological Matrix and Tradespace below.
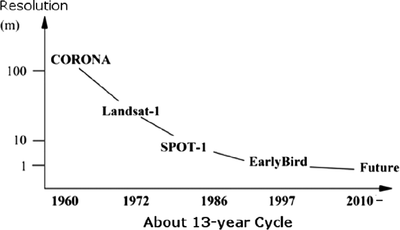
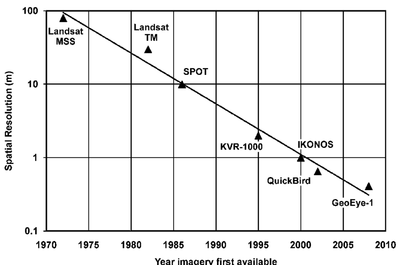 (Left: Zhou 2010; Right: Fowler 2010)
The 10x improvement in spatial resolution over a 13-15 year cycle suggests a decline rate in minimum resolvable distance (increase in resolution) of ~14% per year. Improvements in spectral resolution is evident in the increasing number of bands used in successive Landsat missions, with Landsat 1 carrying only 4 visible/near-visible bands, and the most recent Landsat 8 detecting 8 distinct visible/near-visible bands, one wide panchromatic band, and two long-wave thermal infrared bands.
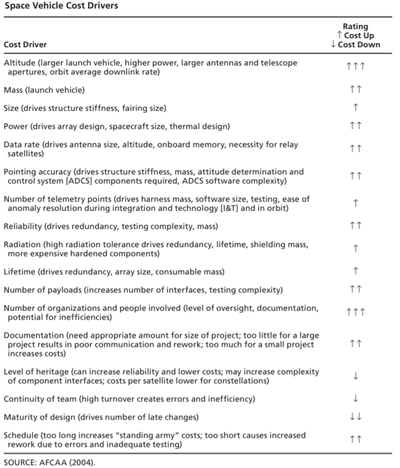
All four types of resolution are inversely associated with monetary cost; finer spatial, spectral temporal or radiometric resolution will all cost more to manufacture in an imaging sensor. We have been unable to pin down exact statistics on the effects of resolution on cost, e.g. estimation equations with coefficients and associated uncertainty, likely as a result of high mission-to-mission variability. While more specifics would be ideal, broadly, Fox et al. in a study published in affiliation with the RAND Corporation note that: "Cost-driving parameters for remote sensors include size, aperture, pointing accuracy, slew rate, number of detectors, operating temperature, resolution or sensitivity, and manufacturing yield." Relatedly, shown below are a set of wider cost trends for any space vehicle, produced by the Air Force Cost Analysis Agency, based primarily on the parameters of the subsystems shown in our Object-Process Diagram above. (See Bernard Fox, Kevin Brancato, Brien Alkire's 2008 "Guidelines and Metrics for Assessing Space System Cost Estimates" for more information)
Other high-relevance FOMs include the power draw of the imager relative to the power output of the solar arrays. If the power draw of the imager is too high, it may reduce the rate at which is it able to capture images, creating data gaps and lowering temporal resolution. A variety of measures exist to quantify this relationship, including the unitless fraction of generated power consumed by the imager, the unitless efficiency of the cells, or the power output per size and mass of the solar arrays [W/(m2*kg)], as smaller arrays cost less to install and launch, and thus more funds can be directed into the imaging subsystem.
For more information on the improvement of solar cell power efficiency over time, refer to recent publications of the National Renewable Energy Laboratory. Finally, the bit error rate (BER) of the communications channel is a relevant Figure of Merit to the wider satellite system. If the BER is too high, it can either slow the system down by necessitating redundancy, or effectively reduce the spatial resolution by decreasing the confidence of any one pixel, necessitating spatial aggregation of the data in post-processing. The BER is a function of some systemic factors like chosen modulation scheme, but many extrasystemic variables, including interference from transmission medium, and as such no clear figure showing improvement over time has yet been identified.
Strategic Drivers
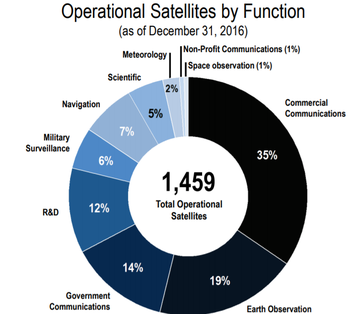
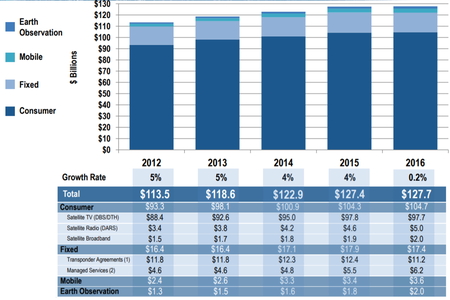
Earth Observation satellites represent nearly a fifth of all active satellites, but account for less than a percent of the revenue in space services.
(Figures by the Satellite Industry Association and sponsored by Bryce Space and Technology; they have been reproduced here from NASA, which has published the 2017 State of the Satellite Industry)
This suggests a far lower value per satellite than space-enabled television and broadband, and thus incentivizes low-cost operations. When this strategy is achievable, it may provide an entry point into space technologies that is less costly than traditionally-sized geosynchronous communications satellites. Although some of the best known Earth Observation projects are large, Earth Observation is posed to dominate the very small and CubeSat market segment. Companies like Planet Labs Inc have garnered notoriety in the past few years for their ambitious imaging projects relying on hundreds of so-called "Doves", each weighing less than 5 kilograms.
The active industry driver here is lowering barriers of entry (which in this case, is primarily costs) to increase the number of consumers and the size of the total addressable market and to establish the foundation for strong positive network externalities. As the market begins to expand in both consumers of observation data, and gatherers/suppliers of observation data, innovation in applications of this information will begin to occur. As more innovation occurs and the data can be applied to more use cases, more suppliers and consumers will enter the market, securing this positive feedback network externality. The barrier to entry is being lowered by lowering costs. Companies are lowering total costs through innovation in machine learning software models that are used to increase autonomy in fleet control and therefore lower operational costs, innovation in manufacturing and automated testing to reduce production costs, and innovation in processing and hardware technology, increasing performance/mass, and therefore decreasing launch costs.
This project has been sponsored in partnership with Labsphere Inc, a New Hampshire-based photonics company. Labsphere provides optical calibration services for a variety of applications, including but not limited to remote sensing in both satellites and consumer cameras. To discuss Labphere's strategic drivers more specifically, their primary business challenge at this time is in convincing customers of the utility of high-quality calibration. As satellites grow cheaper and more expendable, it may be tempting to cost-cut by circumventing aspects of sensor calibration, resulting in inconsistencies in data between imagers in a satellite constellation. Labsphere argues that the customers of satellite imaging companies, e.g. those who are buying remotely sensed scenes, are buying those data to inform their own choices, for example, where to build, when to harvest, and what policies to write, and if that data turns out to be unreliable or inconsistent, then satellite imaging companies will lose their customers. By ensuring image consistency and quality with calibration at a firm like Labsphere, those imaging companies may be able to better attract and retain customers.
Positioning vs. Competitors
For Earth Observation, operators have choice in where and how to calibrate their measurements. Labsphere currently dominates this marketplace, with the vast majority (>90%) of major imaging sensors being calibrated with Labsphere. This includes the Landsast series. Some designers may choose to complete this step in-house, for example, as in NASA's Calibration and Metrology Program, but his option is only available to organizations large enough to have dedicated departments for optics. Other satellite manufacturers, particularly those planning to create a large constellation where the individual requirements on any individual satellite are low due to their short lifespan and high replaceability, may also perform low-cost calibrations in house using their own integration spheres.
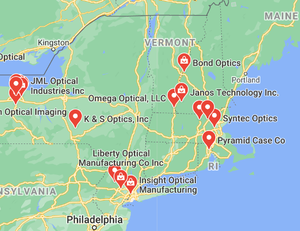
Relative to the wider field of optical firms, Labsphere emphasizes its testing and calibration services as a major selling point. Many other small firms exist, but some deal almost exclusively in hardware. A non-exhaustive survey of its competitors in the North-East reveal a wide variety of optical technicians who all perform some kind of manufacturing function. It is common for firms to list a wide variety of services. For instance, Labsphere, Andover, Headwall, and Omega Optics, all located within New Hampshire, all list Defense, Astronomy, and Medicine/Life Science as among their principle industries served.
Technical Model: Morphological Matrix and Tradespace
Our morphological matrix for an Earth Observation payload is shown below. Underlined values reflect those present on the Landsat 8 mission.
Some choices cause more constraint on the rest of the matrix than others. For example, choosing an imaging satellite does not necessarily restrict the choice of active vs passive sensor type (see figure below, with real-world examples given in parentheses). However, among Earth Observation satellites, geostationary orbits are almost exclusively used for meteorology missions (e.g. the GOES series), so the restrictions imposed by GEO may favor satellites that use non-imaging techniques.
As another feature of our tradespace, we note that the presence of scanning mechanisms introduces new failure modes (see the failure of Landsat-7) and may necessitate additional instruments for reconfigurability or added redundancy, reducing risk. Some features are cost-limited, or constrained by technological limits, rather than trades with other system decisions, for example, radiometric resolution is limited by the quality of available sensor technology. Additionally, we note that although this matrix only represents decision variables for the Earth Observation payload, these choices will have cascading effects on other satellites subsystems (active satellites require higher power draw; more unique instruments will yield greater dry mass).
Sensitivity Analysis
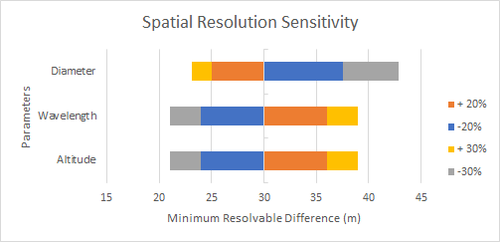
We consider first the relationship of minimum resolvable difference given by Rayleigh’s Resolution limit: X=h* / D (Wertz et al. Eq. 17-6) where X is our figure of merit, the spatial resolution, h is the satellite altitude, is the light wavelength, and D is the diameter of the lens aperture. The partial derivative of this system are quite simple to compute, namely:dX/dh = / D dX/d = h / D dX/dD = -h* / D2 Showing that slight changes to altitude and wavelength should result in constant changes in resolution (proportional to the ratio of the other two parameters), while changes in aperture diameter result in nonlinear effects on resolution. The tornado plot of the sensitivity of ground-range spatial resolution on these variables is as shown, based on figures for Landsat-8 with +/- 20% and +/- 30% changes:
The differences between these variables is hardly dramatic relative to the baseline! However, we must also consider where they are constrained. The baseline values chosen were 700 meter altitude, 550 nanometer wavelength (green), and 13 mm diameter aperture, and 30 m resolution. Because the Sun’s spectrum peaks in irradiance near this wavelength and drops off sharply with decreasing wavelength, a 30% reduction in wavelength may cut received power in half, leading to a decrease in the signal-to-noise ratio due, ultimately leading to new difficulties in resolving an image. Likewise, a 30% increase to wavelength puts us outside of the visible spectrum and into near-IR.
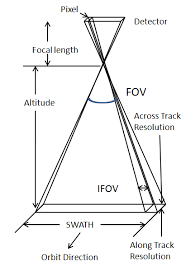
Conversely, altitude is less constrained. A decrease in altitude by 30% would yield a new mission altitude of 490 m, which is quite low, but still feasible; any lower and gains in spatial resolution will be traded against added costs of station keeping due to the presence of thin upper atmosphere air drag. Additionally, the lower the altitude, the smaller the instantaneous field of view, as shown in the figure below, and fewer total meters of ground area will be able to be imaged. Since remotely sensed scenes are often priced by the square kilometer (Mustafa et al. 2012), this may result in fewer potential product scenes for customers to be and necessitate an increase in price per km2 on existing scenes to break even.
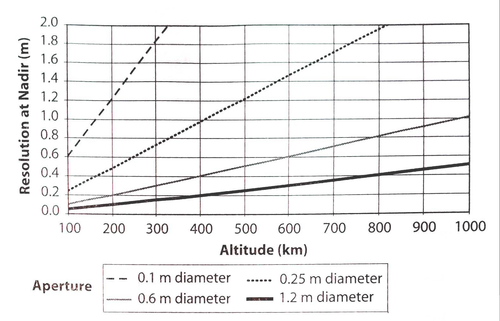
This spatial resolution relationship is also captured well by the following figure, reproduced from Space Mission Engineering: The New SMAD (Wertz et al. 2011). The heightened sensitivity to aperture diameter results in wide variations in the constant slopes of resolution vs. altitude (all lines are held at fixed wavelength in the visible spectrum).
Although we have not yet touched on temporal resolution, our figure of merit concerned with average revisit time and coverage, it will be excluded from this analysis because it is typically simulated numerically in software like STK (Wertz 2011). Although stand-alone analytical methods have been considered recently for applications relevant to road-mapping like system optimization, they nevertheless depend on a wide range factors-- altitude, inclination, eccentricity, swath width, ability to alter pointing from nadir, number of satellites in a constellation-- which may be determined by a particular mission (Nicholas Crisp et al. 2018, arXiV).
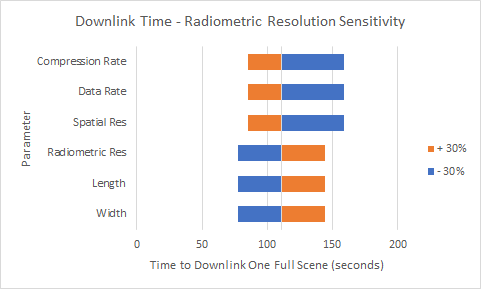
We will now discuss a final figure of merit: the data transmission rate of the signal as it relates to radiometric resolution. A Landsat-8 scene is 185 km cross-track and 180 km along-track, yielding a total area of 3.33*1010 square meters. Each pixel in the scene represents 30m, due to Landsat’s spatial resolution, yielding 1.11*109 pixels per full scene. Because Landsat-8 uses 12-bit radiometric resolution (212 = 4096 available grayvalues), each of these scenes represents approximately 1.6 GB of data (verified here). Landsat-8 regularly returns ~500 scenes per day (source), totaling over 800 GB of data, which at a mission data rate of ~5 MB/s would be impossible in a 86400 second day without lossless data compression. Based on these parameters, we can set up the following equation: t = (w*l*r)/(X*R*C) where t is the time in seconds to relay a scene, w and l are the swath width and scene length, respectively, r is the radiometric resolution, X is the spatial resolution, see above, R is the data transmission rate (in bits), and C is the lossless compression rate. Again, partial derivatives, assuming variables are totally independent, are relatively easy to compute. Two are shown here as examples, acknowledging that the other four would look very similar. dt/dw = (l*r)/(X*R*C) dt/dX = -(w*l*r)/(X2*R*C)
A tornado chart expressing sensitivity surrounding these variables is shown below.
Publication and Patent Review
“Understanding an urbanizing planet: Strategic directions for remote sensing” by Zhe Zhu, Yuyu Zhou, Karen C. Seto, Eleanor C. Stokes, Chengbin Deng,Steward T.A. Pickett, and Hannes Taubenböck.
Accepted in 2019, the article reviews some strategic drivers for the development of remote sensing within the context of the application of remote sensing to urban planning. The identify “four strategic directions for future urban remote sensing research: high temporal frequency analysis, characterization of urban heterogeneity, characterization of urban form and structure in two and three dimensions, and linking remote sensing with emerging urban data. Advances in these four areas are likely to generate significant new insights that will be useful to both science and policy.” The full text can be found here: https://www.sciencedirect.com/science/article/abs/pii/S0034425719301658
"Optimal Scheduling of a Constellation of Earth-Imaging Satellites, for Maximal Data Throughput and Efficient Human Management" by Sean Augenstein, Alejandra Estanislao, Emmanuel Guere, Sean Blaes.
Published in 2016, this article presents an mixed integer linear program model used to optimize scheduling of data downlinking at Terra Bella. As more satellites are added to earth-imaging constellations, the time and effort to manage the constellation increases. The article summarizes some of the constraints and objectives in data scheduling which can be used as strategic drivers for technological development. The operations driven constraints and objectives are summarized in the following excerpt from the article: • Satisfy the minimum contact frequency for each satellite • Balance the competing objectives of image collecting and data downlinking • Provide human operators the ability to manually ”lock-in” or ”lock-out” a given contact • Constellation-wide optimization occurs in a short period of time (less than 15 seconds) The full text can be found here.
The first relevant patent that we looked at was US 20190025422 A1, High Efficiency Synthetic Aperture Radar Satellite, published Jan 24, 2019. The patent defines a synthetic aperture radar equipped satellite that is able to achieve higher power efficiency and higher antenna aperture size to satellite mass ratio than the current state of the art. This is achieved through a parabolic reflector antenna and potentially a traveling wave tube amplifier. This patent is important and relevant because it could indicate a push in the pareto front by using methodological developments to overcome the physical constraints that cap antenna size. The full text can be found here.
We also looked at patent US 20140040282 A1, Satellite scheduling system using crowd-sourced data, published in 2014. This patent proposes a scheduling system that identifies and priorities high-interest locations for imaging based on crowdsourcing data. This system would use social media, news sources, etc. to determine locations of interests based on hyper-current events. This system would then prioritize these locations in the scheduler. This patent is relevant and important because it implies a technology infusion of internet scraping, machine learning, and autonomous systems, into the current earth imaging satellite technology. This could potentially push past the current pareto optimal front. The full text can be found here.
Third, we examine: US 20180286052 A1, Object motion mapping using panchromatic and multispectral imagery from single pass electro-optical satellite imaging sensors, issued July 7, 2020. This patent describes the method by which the slight time difference between images created by different spectral bands of a spectral sensor can be used to infer motion. This technique has been shown to have value in tracking and surveillance, but is not useful in other applications of multispectral sensing, like mineral prospecting, where the target is immobile. Claims describe the specific calculations in image normalization and treatment of edge pixels, essentially a high tech v = Δx/t. Multispectral sensing is, right now, among the more expensive Earth Observation tools in operators' arsenal, so this patent represents and opportunity to diversify the range of products multispectral and panchromatic satellites can offer, further offsetting their cost. The full text can be found here.
Financial Model
Baseline Net Present Value Analysis
A Discounted Cash Flow and Net Present Value (NPV) Analysis was conducted for LabSphere which has been operable since 1979 and is currently profitable. This pro forma financial model is based on an estimate of $26.99million USD in revenue in 2018 and the following assumptions:
Revenue:
- Hardware unit sales account for 60% of total revenue
- Customer service sales account for 40% of total revenue and is a function of units sold
- Roughly 200 units are sold annually in year 0 and all of them sell at the same price
- 4% year over year growth in unit sales
- 2% year over year rate of inflation, impacting the sales revenue per unit and the customer service revenue per unit
- The terminal value of the company can be estimated as a perpetuity of the final year with the expected annual growth rate of 4% and a discount rate of 10%. The value of the perpetuity can be discounted from the penultimate year of the model.
Costs:
- Fixed operating margin of 20%
- Cost of good sold (including fixed and marginal) is ~65% of total revenue
- Selling, general, and administrative is ~15% total revenue
- Interest is incurred at a fixed $500,000 per year
- A tax rate of 10%
- A discount rate of 10% as this is not particularly high-risk technology
These assumptions are modeled in the proforma income statement below.
As is clear from the income statement above, the NPV of the baseline business model is $53.27 million USD. To better illustrate the drivers behind this NPV analysis, a discounted cash flow analysis for each year has been included below.
The primary take away from this activity is that the Labsphere business model continues to be profitable and have a positive net present value. It is important to note the uncertainty introduced into the model by the assumptions, such as the revenue breakdown and units sold. It is also important to highlight this model does not correct for any impacts of R&D that may currently be implicitly included in the 2018 estimated revenue and therefore the outcome of the model.
Delta Net Present Value Analysis
A Discounted Cash Flow and Net Present Value (NPV) Analysis was conducted for LabSphere incorporating R&D investments from their R&D investment portfolio. LabSphere's primary research investment is in the FLARE program which they have considerable industry interests in that they are working to convert to sales. This pro forma financial model is based on the baseline model above and the following assumptions:
Revenue:
- Returns on R&D investments will begin in year 5
- A 40% increase in average price per calibration system can be expected given the nature of the new FLARE program
- A 65% increase in units sales in year 5, 50% increase in years 6-8, 25% increase in years 9-11, a 10% increase in years 12-13, and a 5% increase indefinitely
Costs:
- A total of 10% of revenue reinvested into R&D (~$3 million per year) for 5 years divided between the 3 R&D investments included in the R&D investment portfolio
- FLARE is the primary investment with $2 million per year
- COLOSUS and Materials split the remaining R&D budget with $500k per year
- A discount rate of 15% given the increased risk associated with R&D development
These assumptions are modeled in the R&D proforma income statement below.
As is clear from the income statement above, the NPV of the baseline business model is $180.325 million USD, a considerable increase from the baseline NPV of $53 million. To better illustrate the drivers behind this NPV analysis, a discounted cash flow analysis for each year has been included below.
Assuming LabSphere is able to convert industry interest to sales and the projected revenue growth holds, there is a $127 million delta in NPV, a considerable benefit from investing in their R&D portfolio.
List of R&D Projects
Labsphere's ongoing projects include:
- FLARE, short for Field, Line-of-sight Automated Radiance Exposure, a vicarious calibration network provides new capabilities for on-orbit calibration. FLARE will characterize imager spatial resolution and radiometric resolution performance on-demand with ground-truth measurements, allowing subscribers to verify their image quality at any time. This is turn proves to remote sensing satellite operators' customers that data remains of high quality and measurably consistent performance. FLARE also helps eliminate some of the burden of inconsistent standardization leading to subjective interpretation of calibration models which can lead to operators' and image customers' uncertainty in the quality of the data product.
- COLOSUS, short for COLlimated Optics, Software and Uniform Source solutions. Collimators (devices to narrow a beam of light), integration spheres, blackbodies of known irradiance, and custom-built testing software form the backbone of COLOSUS, serving as a platform for high-control calibration across a wide range of spectrum bands.
- Materials improvements, particularly in the creation of diffuse reflectance coatings useful for defining the grey values of a LiDAR system, as well as in LCD screen backlight paneling. Materials developed by Labphere include Permaflect® and Spectralon®.
Visit Labsphere's website to read documentation and supplemental materials on these projects as well as others.
Technology Strategy Statement
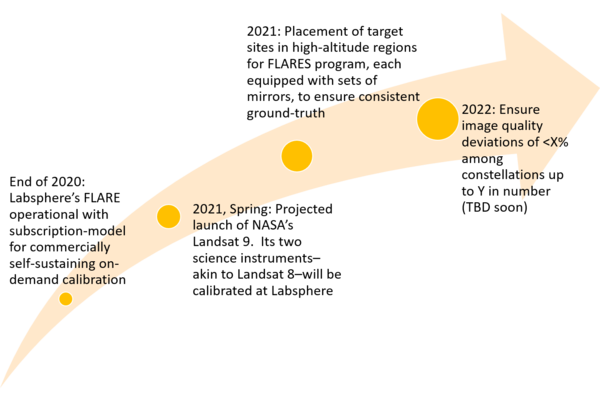
Our target is to encourage the use of high-quality optical calibrations to the new and growing smallsat market. Increased spatial and radiometric resolution remain consistent goals, but in the 2020s market landscape predicted to be dominated by large constellations of satellites, interoperability and data comparability become increasingly important targets. The movement toward analysis-ready data (ARD) which requires no postprocessing by either operator nor customer incentivizes well-calibrated imaging sensors, which can be maintained on-orbit using regular testing against ground sites designed specially for consistent reflective signal across spectrum bands. [Specific quantitative FOM targets in progress, to be included on Friday November 20th, after we touch base with our sponsor at Labsphere.]
