Difference between revisions of "Laser Powder Bed Fusion - Metal"
| Line 38: | Line 38: | ||
==Figures of Merit== | ==Figures of Merit== | ||
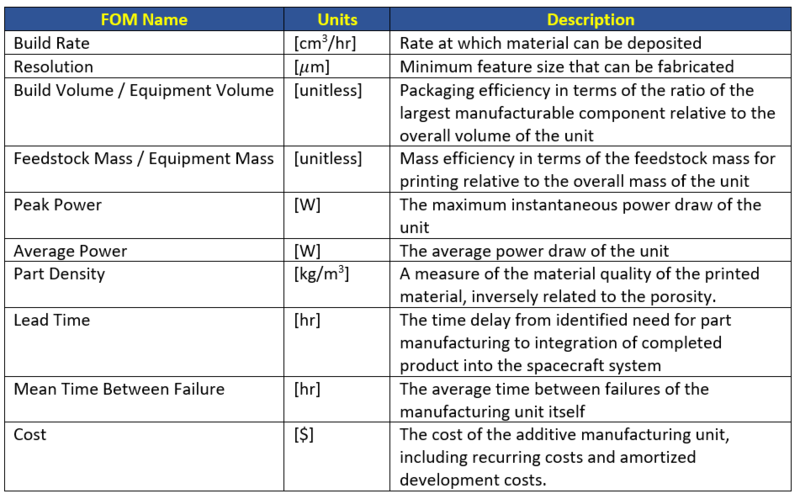
The table below shows a list of FOMs by which | The table below shows a list of FOMs by which Laser Powder Bed Fusion - Metal can be assessed. | ||
The sentence will come here. The sentence will come here. The sentence will come here. The sentence will come here. The sentence will come here. The sentence will come here. The sentence will come here. The sentence will come here. The sentence will come here. The sentence will come here. The sentence will come here. The sentence will come here. The sentence will come here. The sentence will come here. The sentence will come here. The sentence will come here. The sentence will come here. The sentence will come here. The sentence will come here. The sentence will come here. The sentence will come here. The sentence will come here. The sentence will come here. The sentence will come here. The sentence will come here. The sentence will come here. The sentence will come here. The sentence will come here. The sentence will come here. The sentence will come here. The sentence will come here. The sentence will come here. | |||
[[Image:FOM Table 1.png|800px|center]] | [[Image:FOM Table 1.png|800px|center]] | ||
Revision as of 18:10, 11 October 2021
Technology Roadmap Sections and Deliverables
The clear and unique identifier for this technology roadmap is:
- 2LPBF-M - Laser Powder Bed Fusion - Metal
This indicates that we are dealing with a “level 2” roadmap at the specific implementation level, where “level 1” would have indicated the over-arching roadmap and “level 3” or “level 4” would have indicated an individual technology roadmap.
Roadmap Overview
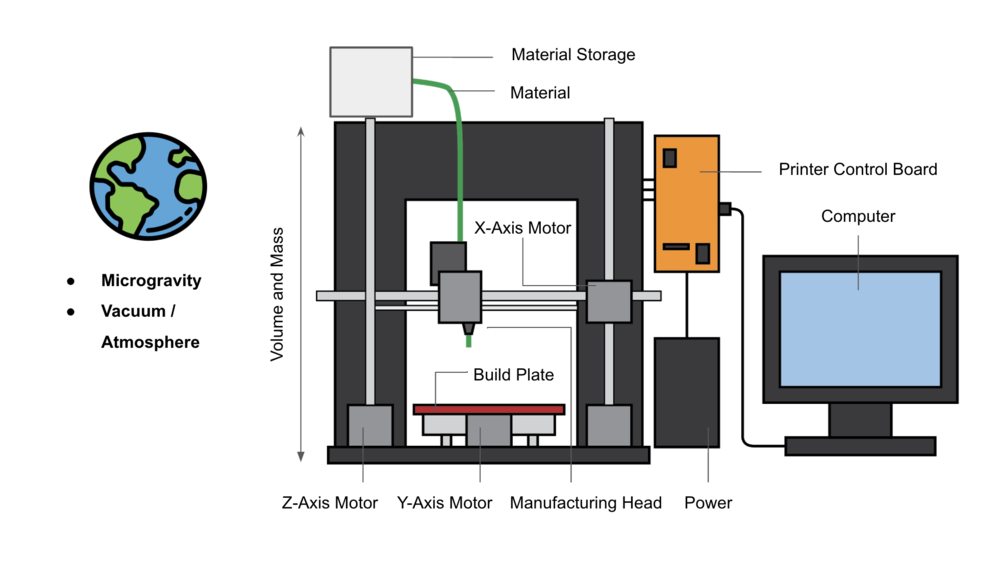
The working principle and architecture of Laser Powder Bed Fusion - Metal is depicted in the image below.
Laser Powder Bed Fusion - Metal (LPBF-M)is an additive manufacturing technology that enables the creation of more or less complex metal components directly from a 3D model without any tools. While the number of available materials is still limited compared to other milling and injection molding processes, LPBF-M utilizes various metal and alloy materials such as stainless steel and cobalt chrome to generate substantial and durable parts, functional metal prototypes, high-temperature applications, and end-use parts. The LPBF-M technology offers comparable quality to parts made with traditional manufacturing methods. LPBF-M can be used for producing parts in highly cosmetic applications, manufacturing aids, small integrated structures, dental components, surgical implants, and aerospace parts.
The process is almost the same as other layer additive manufacturing technologies. A program utilizes 3D model data and mathematically slices it into 3D cross-sections. Each section will act as a draft that lets the LPBF-M machine know where to center the metal material precisely. The data is transferred to the LPBF-M equipment to assembly powered metal material from the powers to produce a uniform layer over the base plane. A layer then draws a 2D cross-section on the build material, fusing the material using a laser beam or an electron beam. Once a layer is complete, the base plate is lowered enough to make room for the next layer. More material is raised from the cartridge and recoated evenly on the previously sintered layer. The LPBF-M machine continues to center layer upon layer building from the bottom up as the part is built. Support structures are added to gives supplemental strength to find features and overhanging surfaces. The completed part is removed from the base play and treated with an age-hardening heat process to harden the part further.
The advantage is the excellent material efficiency of most additive manufacturing processes. While the scrap rate for many complex milled parts is over 90%, the scrap rate for LPBF-M parts is typically less than 5%.
With decreasing available raw materials and rising costs, this material efficiency will be a significant advantage in the long run. In the future, the introduction of high-speed systems with more powerful lasers and larger build chambers is expected to increase the share of LPBF-M in the production process, and a significant number of materials will become compatible with LPBF-M.
Design Structure Matrix (DSM) Allocation
The sentence will come here. The sentence will come here. The sentence will come here. The sentence will come here. The sentence will come here. The sentence will come here. The sentence will come here. The sentence will come here. The sentence will come here. The sentence will come here. The sentence will come here. The sentence will come here. The sentence will come here. The sentence will come here. The sentence will come here. The sentence will come here. The sentence will come here. The sentence will come here. The sentence will come here. The sentence will come here. The sentence will come here. The sentence will come here. The sentence will come here. The sentence will come here. The sentence will come here. The sentence will come here. The sentence will come here. The sentence will come here. The sentence will come here. The sentence will come here. The sentence will come here. The sentence will come here. The sentence will come here. The sentence will come here. The sentence will come here. The sentence will come here. The sentence will come here. The sentence will come here. The sentence will come here. The sentence will come here. The sentence will come here. The sentence will come here. The sentence will come here. The sentence will come here. The sentence will come here. The sentence will come here. The sentence will come here. The sentence will come here. The sentence will come here. The sentence will come here. The sentence will come here. The sentence will come here. The sentence will come here. The sentence will come here. The sentence will come here. The sentence will come here. The sentence will come here. The sentence will come here. The sentence will come here. The sentence will come here. The sentence will come here. The sentence will come here. The sentence will come here. The sentence will come here. The sentence will come here. The sentence will come here. The sentence will come here. The sentence will come here. The sentence will come here. The sentence will come here. The sentence will come here. The sentence will come here. The sentence will come here. The sentence will come here. The sentence will come here. The sentence will come here. The sentence will come here. The sentence will come here. The sentence will come here. The sentence will come here. The sentence will come here. The sentence will come here. The sentence will come here. The sentence will come here. The sentence will come here. The sentence will come here. The sentence will come here. The sentence will come here. The sentence will come here. The sentence will come here. The sentence will come here. The sentence will come here. The sentence will come here.
Roadmap Model using OPM
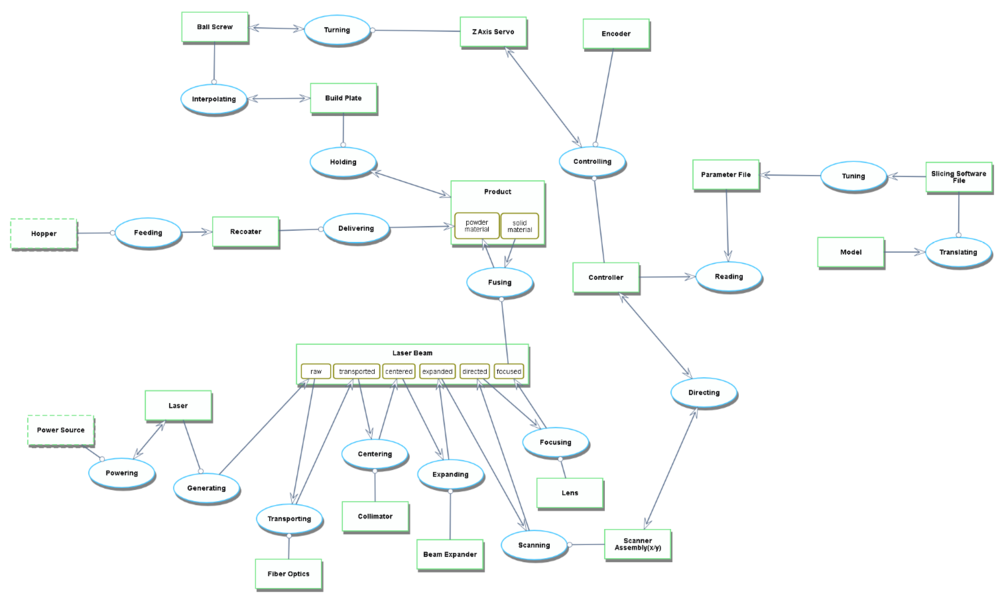
We provide an Object-Process-Diagram (OPD) of the 2LPBF-M roadmap in the figure below. This diagram captures the main object of the roadmap (Laser Powder Bed Fusion - Metal), its various instances including development projects, its decomposition into subsystems, its characterization by Figures of Merit (FOMs) as well as the main processes.
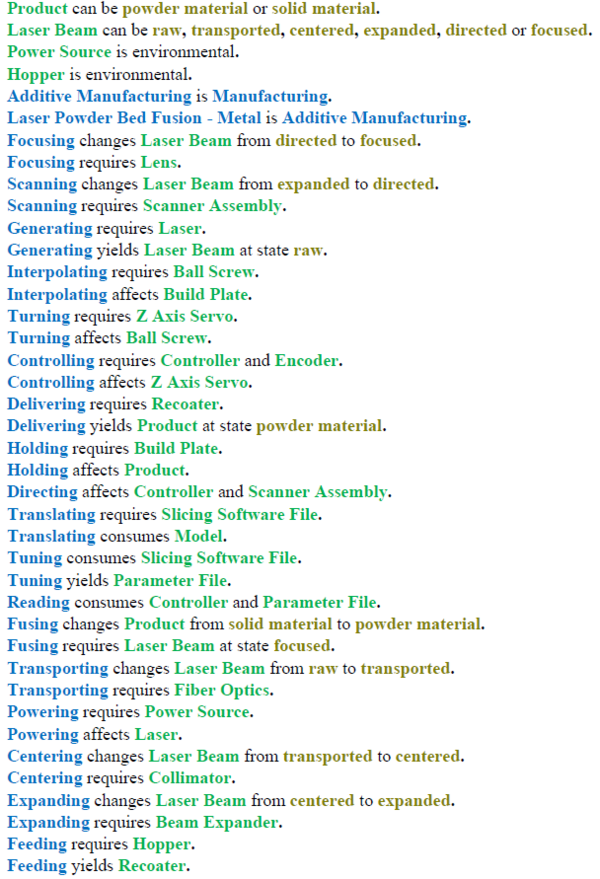
An Object-Process-Language (OPL) description of the roadmap scope is auto-generated and given below. It reflects the same content as the previous figure, but in a formal natural language.
Figures of Merit
The table below shows a list of FOMs by which Laser Powder Bed Fusion - Metal can be assessed.
The sentence will come here. The sentence will come here. The sentence will come here. The sentence will come here. The sentence will come here. The sentence will come here. The sentence will come here. The sentence will come here. The sentence will come here. The sentence will come here. The sentence will come here. The sentence will come here. The sentence will come here. The sentence will come here. The sentence will come here. The sentence will come here. The sentence will come here. The sentence will come here. The sentence will come here. The sentence will come here. The sentence will come here. The sentence will come here. The sentence will come here. The sentence will come here. The sentence will come here. The sentence will come here. The sentence will come here. The sentence will come here. The sentence will come here. The sentence will come here. The sentence will come here. The sentence will come here.
Alignment with Company Strategic Drivers
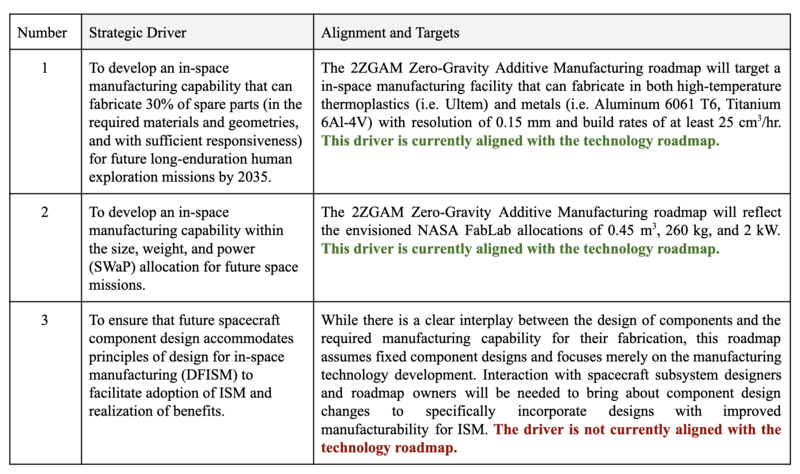
The table below shows an example of strategic drivers and their alignment with the Zero-Gravity Additive Manufacturing (2ZGAM) roadmap.
The list of drivers shows that the company wants to develop an in-space manufacturing capability that can fabricate at least 30% of spare parts for future long-endurance human exploration missions by 2035. The company wants to develop this in-space manufacturing capability within the size, weight, and power (SWaP) allocation for future space missions. Both of these aforementioned strategic drivers are aligned with the technology roadmap at present. As a third strategic driver, the company also wants to ensure that future spacecraft component design incorporates principles of design for in-space manufacturing (DFISM) to facilitate the adoption of ISM and realization of benefits. However, this driver is not aligned with the roadmap as currently scoped. While there is a clear interplay between the design of components and the required manufacturing capability for their fabrication, this roadmap makes an assumption of fixed component designs to focus specifically on the manufacturing technology development alone.
A target of 30% parts was determined as a feasible target which can be achieved by 2035. A high level of resolution is required for the manufacturing of spare parts for space systems due to the sensitivity of the systems involved and the complexity of the parts to be manufactured. However, the resolution is not the only critical factor as AM technologies that have very high resolution but low build rates would compromise on the time-sensitivity of the required spare parts. Hence it is essential that we are able to manufacture a wide variety of parts that are precise in their structural composition. If we are not able to manufacture at least 30% spare parts, then there would be minimal additional value for the launching organizations or government agencies to invest in the same and they would continue with the present process of terrestrial manufacturing and deployment to space.
Positioning of Company vs. Competition
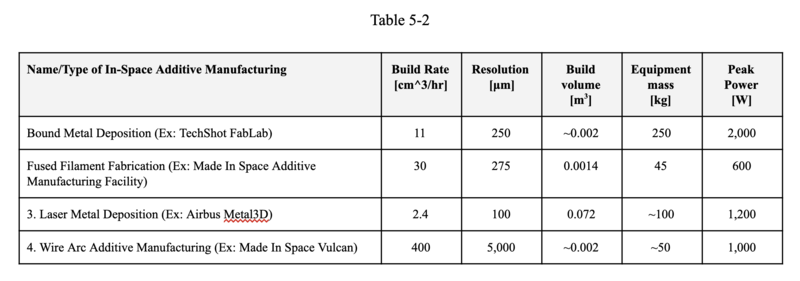
We compared and organized the FOM from related/competitive companies. Some key data/info is confidential, therefore we will keep it blank.
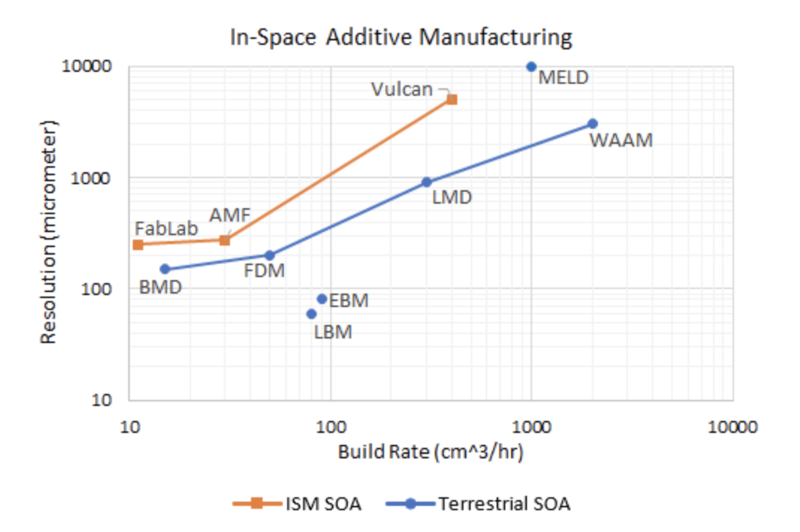
The following figure is the Pareto Front of Resolution vs. Build Rate for Various Additive Manufacturing Processes
The utopia point for the chart above is on the bottom right corner and at-present the Pareto front for Terrestrial SOA is closer to the utopia point than for ISM SOA. The parts which we will be manufacturing in space need to be of high quality and should have a reasonable manufacturing time. If the parts produced in space have a much lower resolution (higher micrometers) and have a low build rate (and consequently high build times and mean times to failure), then the manufactured parts may be unusable and provide minimal advantage over manufacturing on earth. The focus here is to shift the Pareto front for ISM SOA closer to the utopia point which can be achieved by maximizing resolution (lower micrometers) and build rate within reasonable limits. Working on improvements in both areas align with our strategic drivers and will help us achieve our goals within the target dates specified in the Technology Strategy Statement mentioned in the latter section.
While there are many technically feasible approaches to additive manufacturing of parts and systems, not all are adaptable to space. Present limitations for in-space manufacturing which contribute to the differences in the Pareto front for resolution and build rate include -
- Space systems engineering is a complex discipline with very mature methods of certification which results in the deployment of extensively tested apparatus. Due to the extensiveness of testing before sending it to space, AM technologies have been progressing faster for terrestrial applications.
- Current additive manufacturing systems deliver accurate and precise results in a 1 g, thermally controlled environment and are well understood. The same level of information is not available for ISM as there is much more testing for terrestrial AM due to less stringent certification methods.
- Current processes such as photolithography can create electric components at scales of 35 nanometers as compared to common AM resolution (>50 microns) which would produce components 1,000 times larger than the physical size of currently available parts. This disparity in performance discourages investment by organizations to conduct research in this area.
- Physics-based models of in-space additive manufacturing processes are needed to understand and predict material properties and help optimize material composition.
- The thermal effects of energy source and energy density in space has not yet been extensively researched.
- There is not enough investment in systems that produce open-system design, planning, simulation, and analysis tools for ISM.
- Design for and construction of objects in space will likely require much less mass, due to the reduced gravity, but it is difficult to predict the overall mass reduction and corresponding impact on construction time without knowing the resolution required and the impact of other environmental effects on the process.
- The impact of vacuum and thermal environments on the AM technology is not holistically understood due to a lack of data.
References:
https://www.nap.edu/read/18871/chapter/5#60
Technical Model
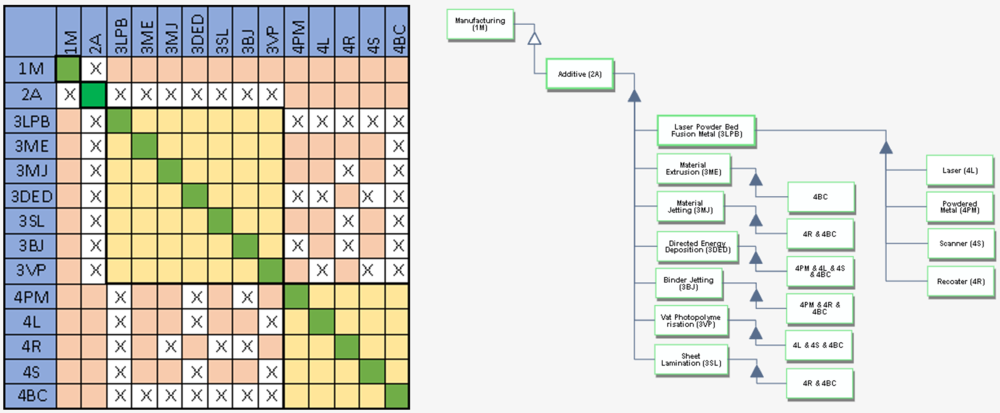
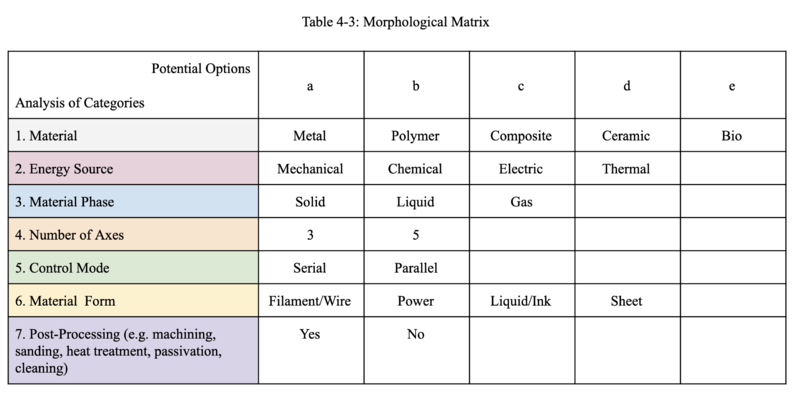
In order to assess the feasibility of technical (and financial) targets at the level of the 2ZGAM roadmap it is necessary to develop a technical model. The purpose of such a model is to explore the design tradespace and establish what are the active constraints in the system. The first step can be to establish a morphological matrix that shows the main technology selection alternatives that exist at the first level of decomposition, see the figure below.
Technical Model: Morphological Matrix and Tradespace
Mathematical Equations
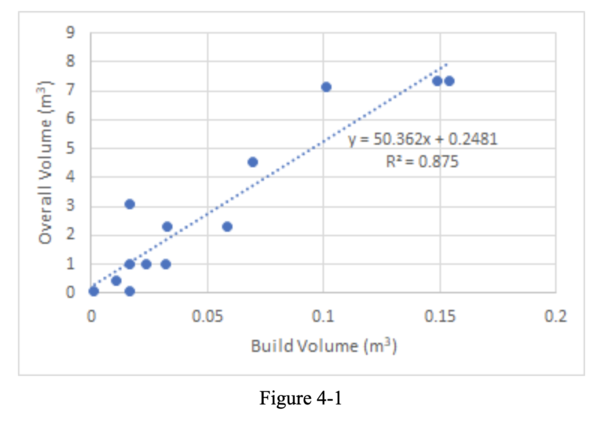
For this problem, we will focus on two figures of merit: (1) the ratio of build volume to overall manufacturing equipment volume, and (2) build rate [cm^3/hr]. Whereas the volume ratio will be determined using statistical regression techniques from available data about existing manufacturing equipment, the build rate will be computed from the fundamental physics of the manufacturing process (although it can also be validated with experimental results).
By looking at analogous Earth-based manufacturing equipment with plenty of available data on manufacturing equipment build volume and overall footprint, it is possible to derive a statistical relationship between build volume and overall volume of manufacturing equipment. The data plotted below represents the volumes for typical commercially available additive manufacturing equipment, particularly for FDM and SLS. With an initial y-intercept offset, we see that the ratio of build volume to overall volume is typically about 1.9% (or 1/50.362). The trendline can be used to predict the expected overall volume of manufacturing equipment to provide a desired build volume. However, it should be noted that for in-space manufacturing applications, where volume is at a much higher premium than for terrestrial manufacturing equipment, it is likely possible to improve the build volume to overall volume ratio through dedicated design and technology development efforts.
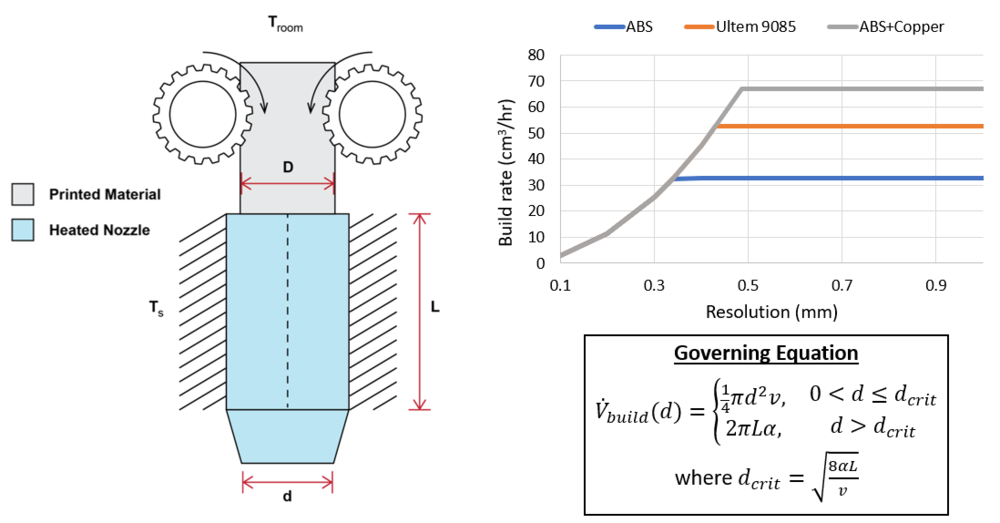
The achieved build rate for fused deposition modeling (FDM), as well as for the deposition phase in Bound Metal Deposition (BMD), can be computed analytically. The build rate is computed as the most limiting case of the following factors: heat transfer to/from the feedstock, maximum extrusion force, and traverse speed of manufacturing head and nozzle diameter. For these equations, consider the schematic shown below representing the process.
If we assume that the heating element is maintained at a temperature, <math>T_s</math>, that is equal to the glass transition temperature of the polymer being extruded, then the achieved rate of material extrusion, <math>\dot{V}_{thermal}</math>, can be computed as shown below, where <math>L</math> is the length of the heating element and <math>\alpha</math> is the thermal diffusivity of the material:
- <math>\dot{V}_{thermal} = 2 \pi L (k / \rho c) = 2 \pi L \alpha</math> (Eqn 4-1)
To ensure that the material is deposited smoothly and continuously, the deposition rate should also satisfy the relation shown below, where <math>d</math> is the nozzle exit diameter and <math>v</math> is the maximum traverse velocity of the manufacturing head:
- <math>\dot{V}_{traverse} = 0.25 \pi d^2 v</math> (Eqn 4-2)
Because the lesser of these build rate values will be the limiting factor, we know that heat transfer to the filament will be the limiter of build rate when <math>\dot{V}_{thermal} < \dot{V}_{traverse}</math>, and vice versa. It is also very convenient to compute the critical nozzle exit diameter, <math>d</math>, which also defines the print resolution, at which the build rate due to heat transfer is exactly equal to that due to traverse speed. At this resolution, both build rates are the active limiting constraint and give the same result. We thus find that <math>\dot{V}_{thermal} = \dot{V}_{traverse}</math> when <math>d_{crit} = \sqrt{8 \alpha L / v}</math>
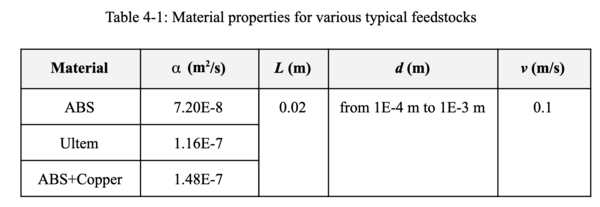
So, let us assume nominal values for the key parameters in the calculation of this build rate FOM:
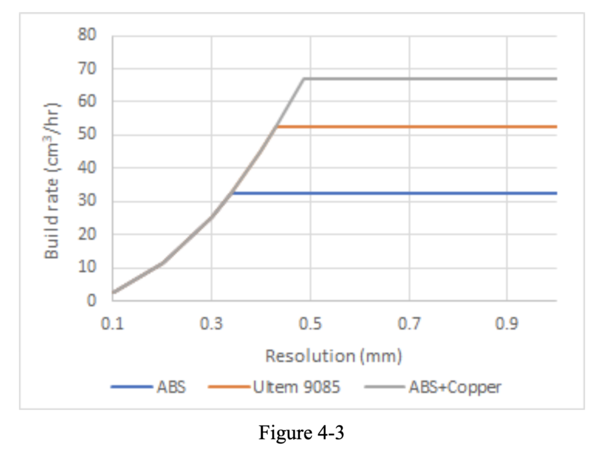
We can now plot the build rate vs. resolution for the parameter values shown in the table above. We see that the particular feedstock material affects the critical nozzle exit diameter (i.e. resolution) at which the active constraint on build rate switches from the traverse speed of the print head to be now limited by the heat transfer from the nozzle. The thermal diffusivity, , of the feedstock material also affects the maximum build rate achievable. However, when traverse speed is the limiting factor, the build rate is independent of material and only depends instead on the desired resolution.
In general, the equations above apply not only for FDM and BMD process, but more generally for any process that carries out serial deposition of a feedstock material made molten by thermal conduction from a heater element in the manufacturing head. Using the morphological matrix show later in this answer to describe different manufacturing processes, we know that each process that shares the same pairing of energy source and material phase will have the same fundamental equations describing the manufacturing process, but simply with different parameters. However, different combinations of energy source and material phase will have different fundamental equations. For example, using electrical energy to deposit molten material describes both wire-fed directed energy deposition processes such as laser DED and electron beam freeform fabrication (EBF3). The description of these processes will differ in the input parameters, but their model will be similar, albeit different from the model presented for FDM.
Sensitivity Analysis
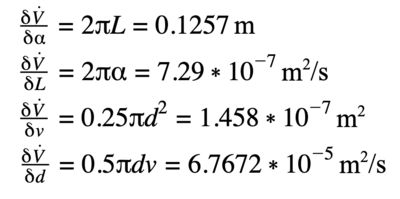
We can compute the sensitivity of build rate to the four key parameters identified: thermal diffusivity (<math>\alpha</math>), heated nozzle length (L), nozzle exit diameter (d), and print head traverse speed (v). These sensitivities are given by taking partial derivatives of Eqn 4-1 and Eqn 4-2. For convenience we will evaluate the sensitivities at the critical nozzle exit diameter (dcrit) where the build rate achieved due to traverse speed and due to heat transfer is identical. The values reported below are for Ultem 9085, a high-temperature aerospace grade polymer. This gives:
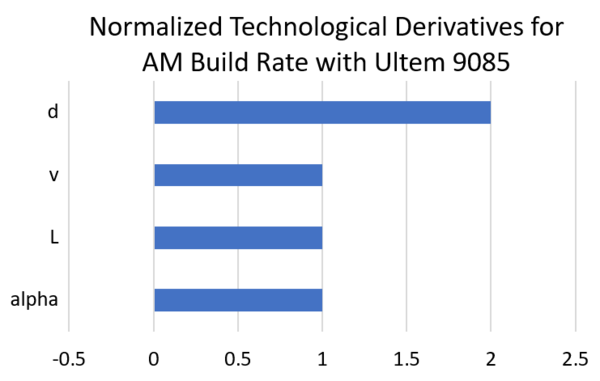
Normalized Tornado Chart
We now normalize the above sensitivities to represent the percent change in system performance, i.e. build rate, for a one percent change in the underlying parameter. In this way, we produce the normalized tornado chart shown below. The tornado chart indicates that changes nozzle exit diameter (d) results in twice an improvement of system performance as compared to print head traverse speed (v), heated nozzle length (L) and thermal diffusivity (<math>\alpha</math>).
Financial Model
Hypothesis and Assumption
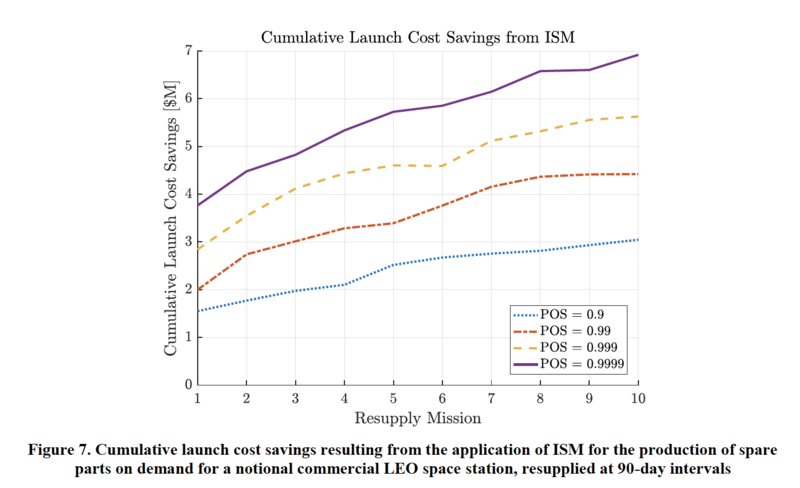
- The major reference of the data is Figure 7 (P13) - POS (purple color in the diagram) from the paper “Feasibility Analysis of Commercial In-Space Manufacturing Applications” by Alejandro E. Trujillo, Matthew T. Moraguez, Samuel I. Wald, Andrew C. Owens, and Olivier L. de Weck, 2017.
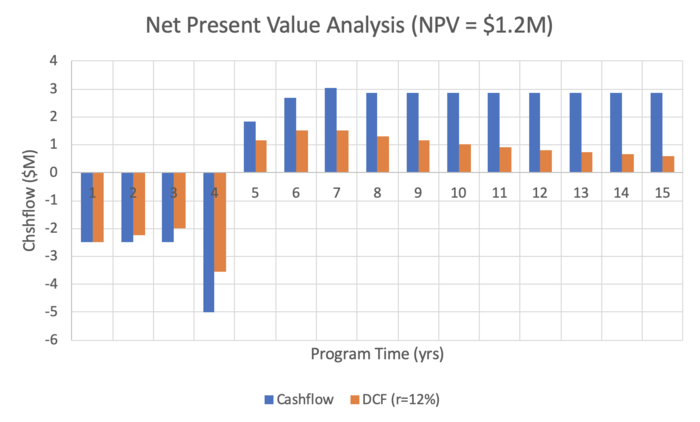
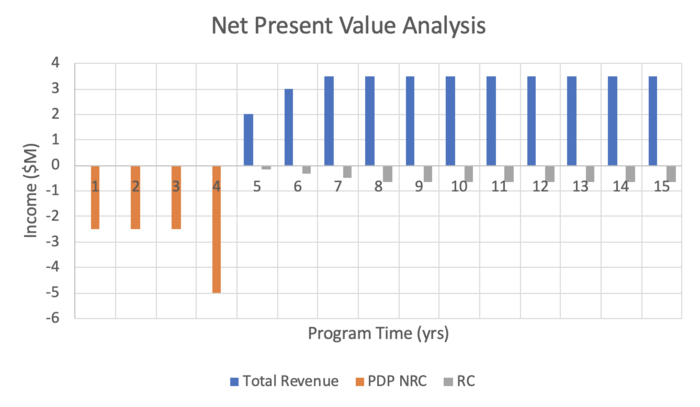
- Since we use POS=0.9999, the revenue of $2,838,000/yr is derived from $7 M launch cost savings over 900 days.
- In the context of the project, the team assumes the company can print 30% of ECLSS spares in space by additive manufacturing.
- In the context of the project, the team assumes the company will put the upfront investment e.g. money, people training, and other built/manufacturing material in the first four years as the main investment. Then a first manufacturing unit is built and launched (250 kg at $10,000/kg).
- In the context of the project, the team captures and documents the data of 15-year including cash flow, discounted cash flow, launch cost-saving (which translates into revenue), recurring costs, and non-recurring costs.
- In the context of the project, the team assumes we have the expense of staff of three FTEs during operational years, as well as the launch of feedstock resupply.
- In the context of the project, the net present value is $1.15M assuming a discount rate of 12%.
List of R&T Projects and Prototypes
The overall goal for technology development under this roadmap, as defined in Strategic Driver #1, is to enable in-space manufacturing of at least 30% of spare parts for long duration human exploration missions by 2035. Ensuring that the ISM equipment can fabricate the necessary spares requires that technology is developed for the manufacturing of the required materials with appropriate resolution, build volume, build rate, and system SWaP.
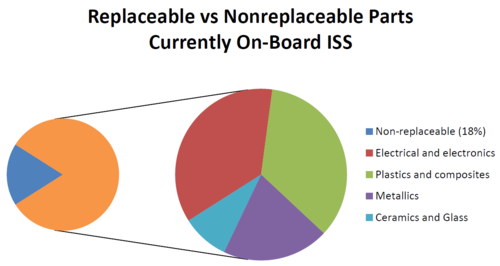
According to Johnston et al., of the components that require repair and replacement on the ISS, 28.6% are plastics or composites, and 18% are metallics. The remaining spares are either electronics or ceramics/glass. Thus, it becomes immediately clear that to achieve the target of 30% of spares manufacturable by ISM, the technology developed under this roadmap will need to be able to fabricate in both metal and polymers.
However, while it is necessary to fabricate in these multiple materials, simply incorporating the ability to fabricate new materials is insufficient to meet desired target performance. This is because there are other active constraints, such as the build volume, build rate, and resolution that limit which of the metallic and polymer components can actually be fabricated. Additionally, the new metal manufacturing capability, which has as yet not been demonstrated in orbit, will require SWaP reduction development activities to meet the required target.
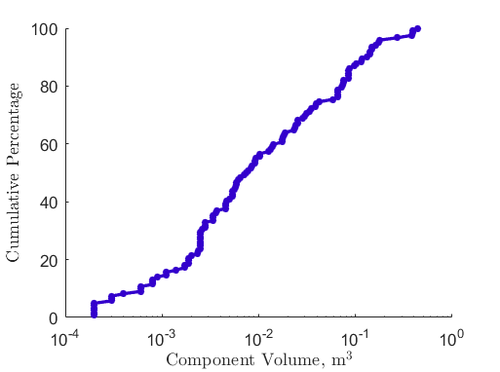
Realizing and demonstrating the ability to fabricate with a build volume large enough to accomodate over 30% of the spares is a second key technology development effort. Based on available data from NASA’s Baseline Values and Assumptions Document (BVAD), we see that a build volume of 8” x 8” x 8” is required in order to accomodate 50% of spares, as shown in the figure below. (Note: The 50% value is used here for margin, because some of those components which are considered manufacturable simply based on build volume, may not be manufacturable for other reasons, such as not being of the right material or having too tight of tolerances to be manufactured.)
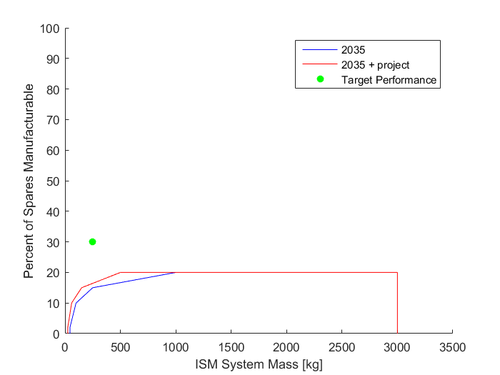
Because the overall size, weight, and power of our ISM system will be severely constrained, as is common in space systems engineering, a potential development project involves achieving improvements in the ratio of build volume to overall system volume. Terrestrial additive manufacturing equipment is not nearly as volume constrained as an in-space manufacturing unit would be. Thus, a concerted development effort would be necessary to achieve improvements in this packaging efficiency of the build volume within the unit. This could take the form of miniaturization of the ancillary manufacturing support equipment, or of re-design of the build tray and gantry system to more efficiently utilize available volume. A development project to simply reduce the mass of existing ISM capability is not enough to reach the desired target, as shown below.
Build rate is also identified as a key contributor to determining which spares will be deemed manufacturable (see Moraguez & de Weck 2019). The ISM system must be able to fabricate components quickly enough to produce the spare before the effects of the non-operational system lead to hazardous conditions for the spacecraft or crew. It has previously been shown in this roadmap that build rate is directly tied to resolution. However, while build rate can be traded for resolution, either through process modifications or a change of manufacturing process, it is not desireable to sacrifice resolution for build rate because that can reduce the number of spares that can be fabricated within the required tolerance. Recall that in-space manufacturing equipment typically has reduced build rate and resolution over its terrestrial counterparts due to the limitations on size, weight, and power. Thus, technology development efforts for improvement of build rate to approach terrestrial values without sacrificing resolution are desired.
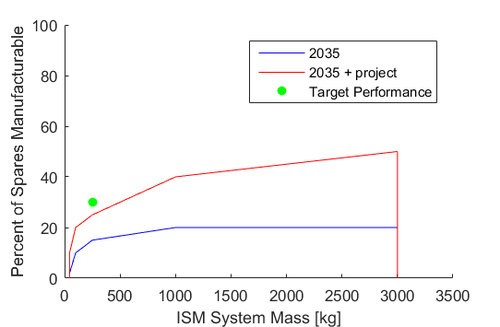
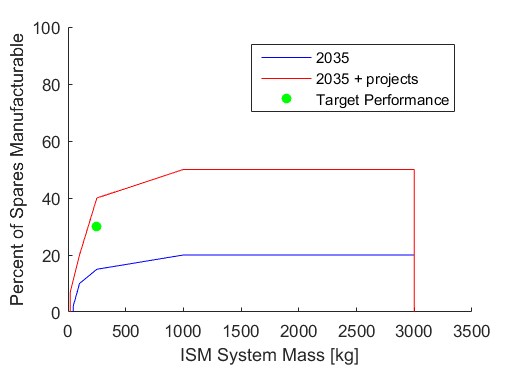
The figure below presents the performance frontier for ISM technology in 2035 both with and without the proposed development projects. Currently, ISM systems are limiting to additive manufacturing of thermoplastics (i.e. polymer FDM). While these systems have demonstrated the ability to fabricate components on the ISS, they are extremely limited in application for fabrication of actual spare parts. Business as usual will carry these systems to the point where they can begin to be adopted as either a supplemental or baseline approach for spares for some low-risk components. However, without a concerted technology development effort these systems will not develop beyond fabrication of polymers. This material constraint places an upper limit on the percent of spares that can be fabricated regardless of the mass allocation for the ISM system. Thus, one key technology development project is to extend ISM into fabrication of metals, such as aluminum 6061 T6 and titanium 6Al-4V. Based on the build rate and resolution targets set forth in this roadmap, bound metal deposition is likely to be the process of choice for this development effort. Significant effort will be placed in improved prediction of part shrinkage to enable the required tolerances to be achieved with this process. By demonstrating metals manufacturing through this development, the upper limit on the percent of spares that can be fabricated by ISM will be raised to about 50%, assuming sufficient mass is allocated to the ISM system. As this fraction of manufacturable spares increases, it becomes increasingly important to have a high enough build rate that the ISM system can keep up with component failures. Thus, technology development focused on improved build rate without sacrificing resolution is proposed. This involves improved heat transfer to the filament and/or additional energy sources (i.e. directed laser energy or heated build volume). The final key technology development focus is to reduce the overall ISM system volume and mass. The improved volume efficiency enables the required build volume for the increased spares fraction to be achieved within volume constraints. The reduction in mass leads to a leftward shift in the performance frontier, where a given percentage of spares can be fabricated with less ISM mass allocation. Thus, there is a reduction in the minimum mass allocation for a system that can at least fabricate a single spare. Nevertheless, there is still an upper limit on the maximum mass allocation for an ISM system, which is equal to the mass of carry-along spares that the ISM system seeks to replace. We also note that the performance frontier is initially characterized by a steep slope as the easiest to manufacture spares are able to be fabricated by minimally capable ISM systems. As additional capability is added, in terms of mass allocation for the ISM system, the fraction of manufacturable spares continues to increase, albeit more slowly due to those spares being more challenging to manufacture. This challenge of diminishing returns are largely what drove the target performance to be set as it is.
References:
Johnston, M. M., et al., “3D Printing in Zero-G ISS Technology Demonstration,” AIAA Space, San Diego, CA, Aug. 2014. Hanford, A.J., ed., “Advanced Life Support Baseline Values and Assumptions Document,” Houston, TX, NASA/CR-2004-208941, Aug. 2004. Moraguez, M., and de Weck, O., “In-Space Manufacturing Production Rate and Reliability Targets for On-Demand Fabrication of ECLSS Spares,” 49th International Conference on Environmental Systems, Boston, MA, Jul. 2019.
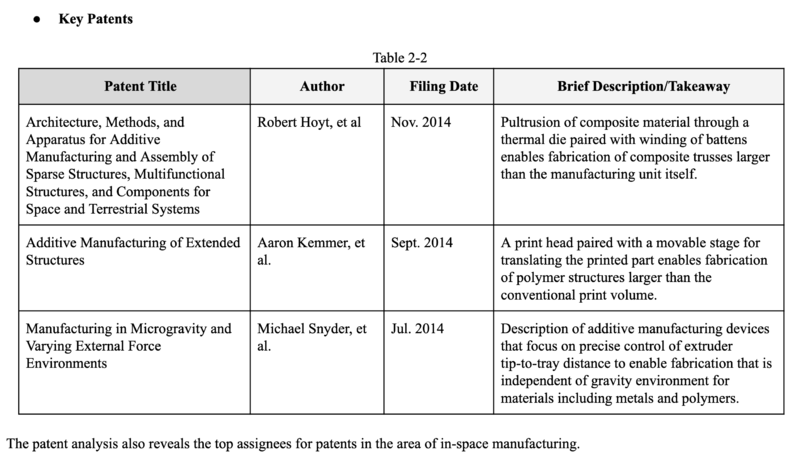
Key Publications, Presentations and Patents
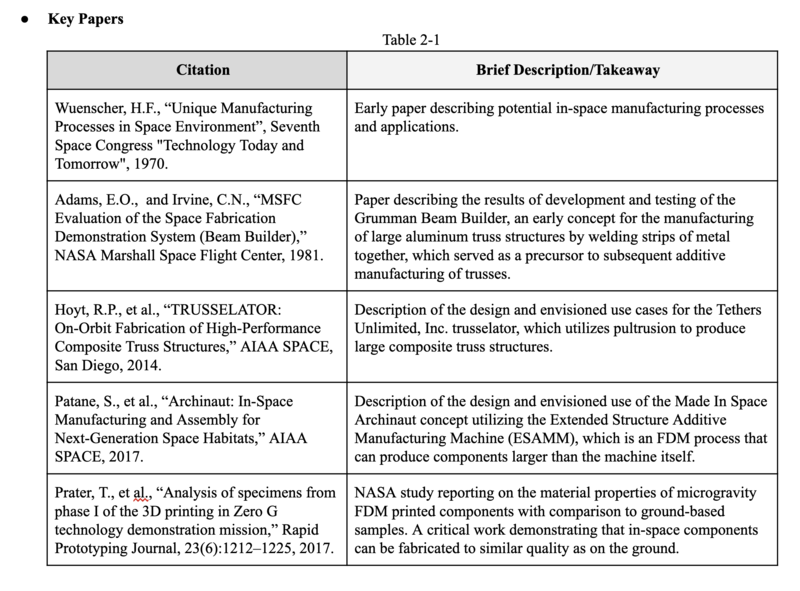
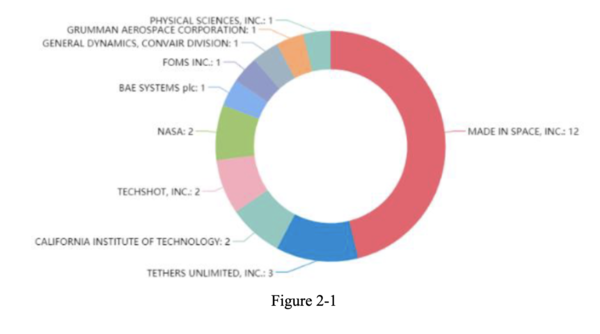
We will focus it on Additive Manufacture in the space as the main direction to search and do our paper and patent analysis
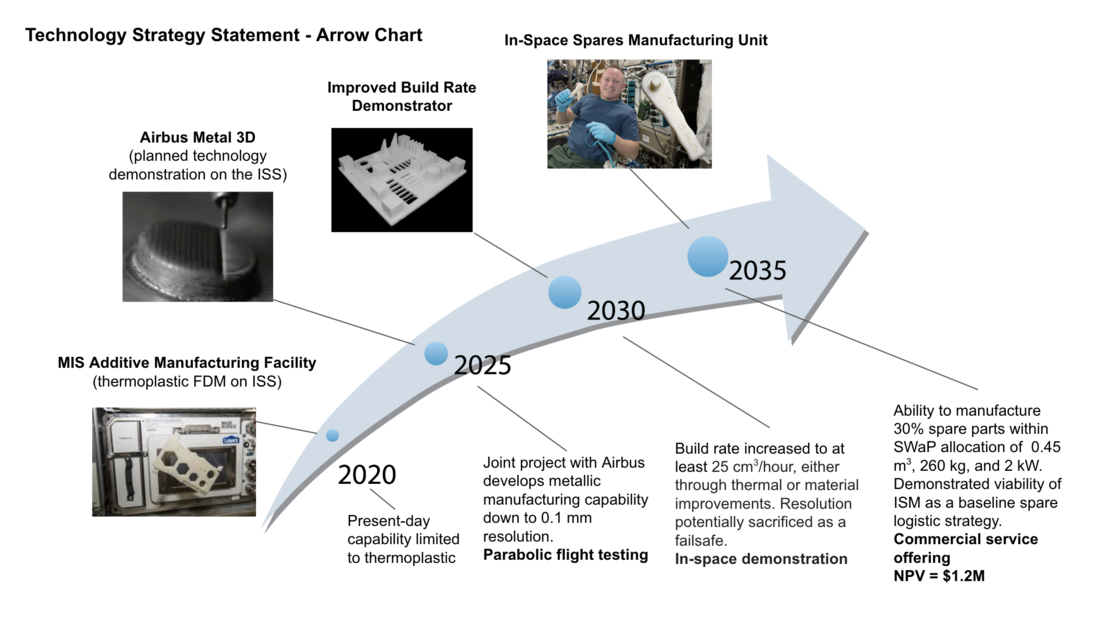
Technology Strategy Statement
Our target is to develop an in-space manufacturing facility that can fabricate 30% of spare parts (in the required geometries and with sufficient responsiveness) in both high-temperature thermoplastics and metals with resolution of 0.15 mm and build rates of at least 25 cm^3/hour. Additionally, we want to achieve the envisioned NASA FabLab allocations of 0.45 m^3, 260 kg, and 2 kW by the target year 2035. To enable this we will invest in two parallel R&D projects with immediate effect. The first project would be a joint project with Airbus to achieve the 0.1 mm resolution by Laser Metal Deposition achieved by Airbus Metal3D by the year 2025 for technology demonstration on the ISS. This demonstration would prove our capabilities with the fabrication of actual representative spares to pave the way for becoming a baseline sparing approach for future commercial space station customers in 2035. The second project would be to maximize build rates without compromising on resolution, such as by using a longer heating element, using multiple print heads, using improved materials or external sources of heating. By 2025, if we see that the expected build rate cannot be achieved without compromising on resolution, then we will trade-off resolution for increasing the build rate so that minimal machining can help us achieve the same resolution by 2030. A combination of improvements in both projects will help us reach our technical and business targets by 2035. In case time permits, we will invest in an additional project to minimize the volume and mass of the printer without compromising on the range of possible parts which can be generated.
