Difference between revisions of "Mobile Nuclear Fission Reactors"
| Line 338: | Line 338: | ||
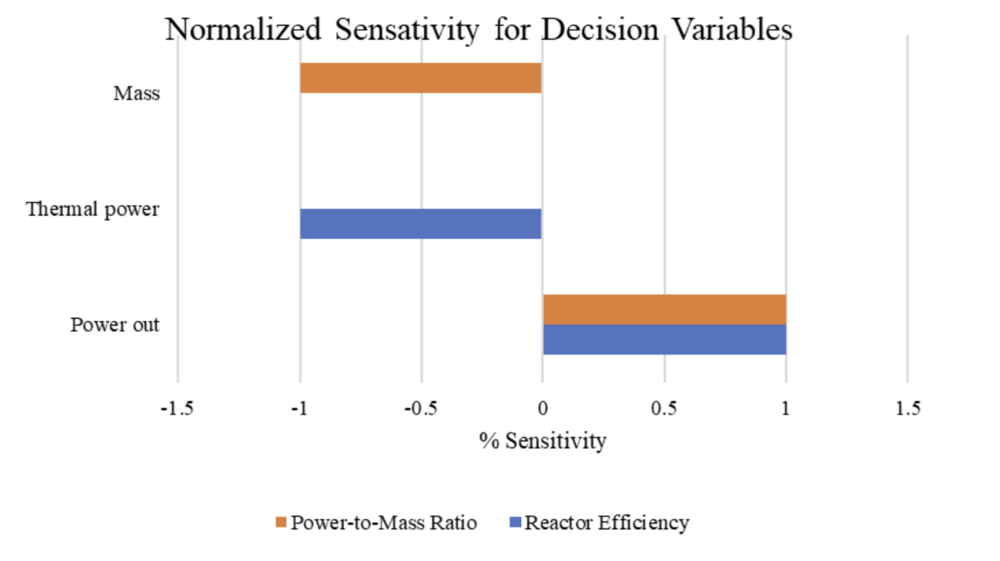
The normalized values reveal that increasing the mass of the MNFR by one unit reduces the power-to-mass ratio by 1%. Increasing the thermal output by one unit reduces the reactor efficiency by 1%. Increasing the output power by one unit increases the power-to-mass ratio and reactor efficiency by 1%. | |||
=Key Publications and Patents= | =Key Publications and Patents= | ||
Revision as of 18:44, 2 November 2023
Roadmap Overview
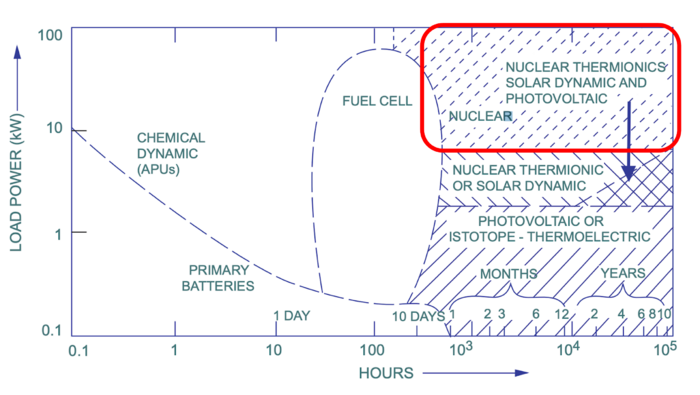
As humans venture further into space beyond low Earth orbit to establish settlements, there emerges a need for reliable power generation technologies for human settlements on other planets. While photovoltaics, fuel cells, batteries, and radioisotope thermoelectric generators (RTGs) are considered possible power sources, each have limitations within the scope of long duration missions that require higher loads and reliability to support human settlements. For example, solar arrays are highly dependent on the sun, meaning that it cannot generate power during night times. Batteries generally provide low power and have a short lifespan, making them unsuitable power sources for human settlements. As shown in the diagram below, the need for higher load powers and longer duration missions points to nuclear energy as a source of power for human settlements on other planets. The Mobile Nuclear Fission Reactor (MNFR) is a technology that can provide nuclear energy and will be the focus of this technology roadmap. It is important that we describe the nuclear fission reactor technology being roadmapped as being “Mobile” because it must be able to move freely and easily so that it can be transported from Earth to the planet via a launch vehicle.
Image taken from: https://ocw.mit.edu/courses/16-851-satellite-engineering-fall-2003/2c8a1a136db0e366ae8d1a1e2995a505_l3_scpowersys_dm_done2.pdf
At high-level, nuclear fission reactors generate power through the nuclear fission chain reaction of fuel that is stored within the reactor core. The fuel contains fissile isotopes of elements such as uranium-235 and plutonium-239. The reactor core generates heat as a result of the chain reaction, and the heat is converted into kinetic energy and ultimately electrical energy that is distributed and used. Using nuclear fission reactors in extraterrestrial environments imposes constraints on the system which are inherently different from Earth-based reactor systems. Some examples of these constraints include the reactor size/mass (due to launch costs), safety, decommissioning, and cost of operations. This roadmap will allow us to project future nuclear fission reactor capabilities that we may potentially harness to generate power for future human settlements in space.
Design Structure Matrix (DSM) Allocation
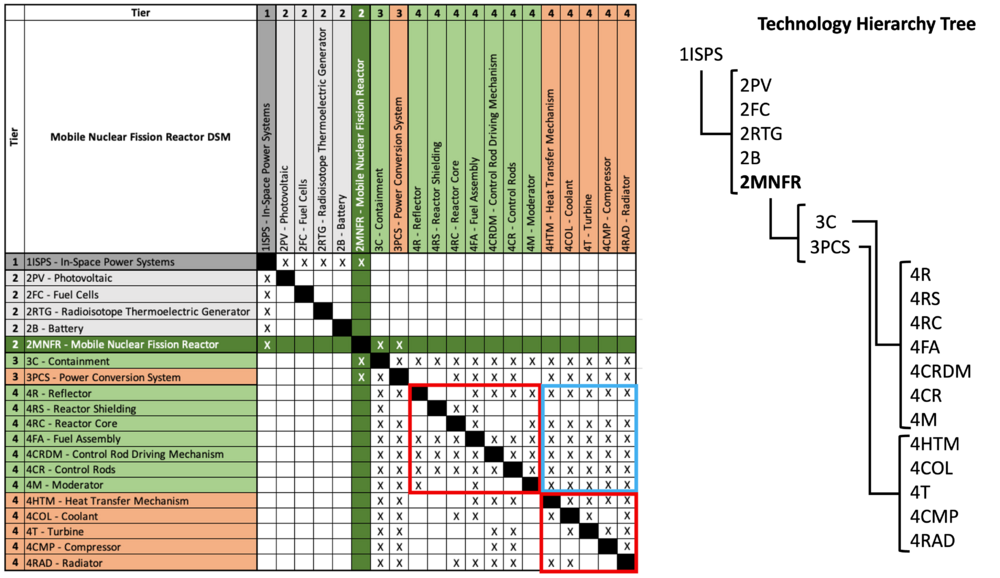
The Mobile Nuclear Fission Reactor is identified to be a tier two technology because it is part of a wider initiative to develop power technologies (such as fuel cells, photovoltaics etc.) that can support in-space power systems for human habitats on other planetary surfaces. The Mobile Nuclear Fission Reactor (2-MNFR) is highlighted in dark green in the DSM below on the left. The MNFR is then broken down into two tier three systems which includes the containment and power conversion system. The containment and power conversion systems are then further broken down into tier four subsystems as summarized in the technology hierarchy tree below on the right.
The DSM highlights key dependencies between systems that make up the MNFR. Two notable observations could be made:
1.There is high interdependency between components that comprise the containment system and components that comprise the power conversion system. This is highlighted by the red boxes shown in the DSM. This outcome is expected because the tier four components in a reactor are designed to have a coupled relationship for the reactor to function
2. There is a high level of cross-system dependency between the containment system and power conversion system where the power conversion system receives “inputs” from the containment system. This outcome is expected because in a reactor, the power conversion system is downstream of the containment system (i.e.: the containment system produces thermal energy, and the power conversion system turns that into electrical energy). This cross-system interdependency is highlighted by the blue box shown in the DSM.
Roadmap Model using OPM
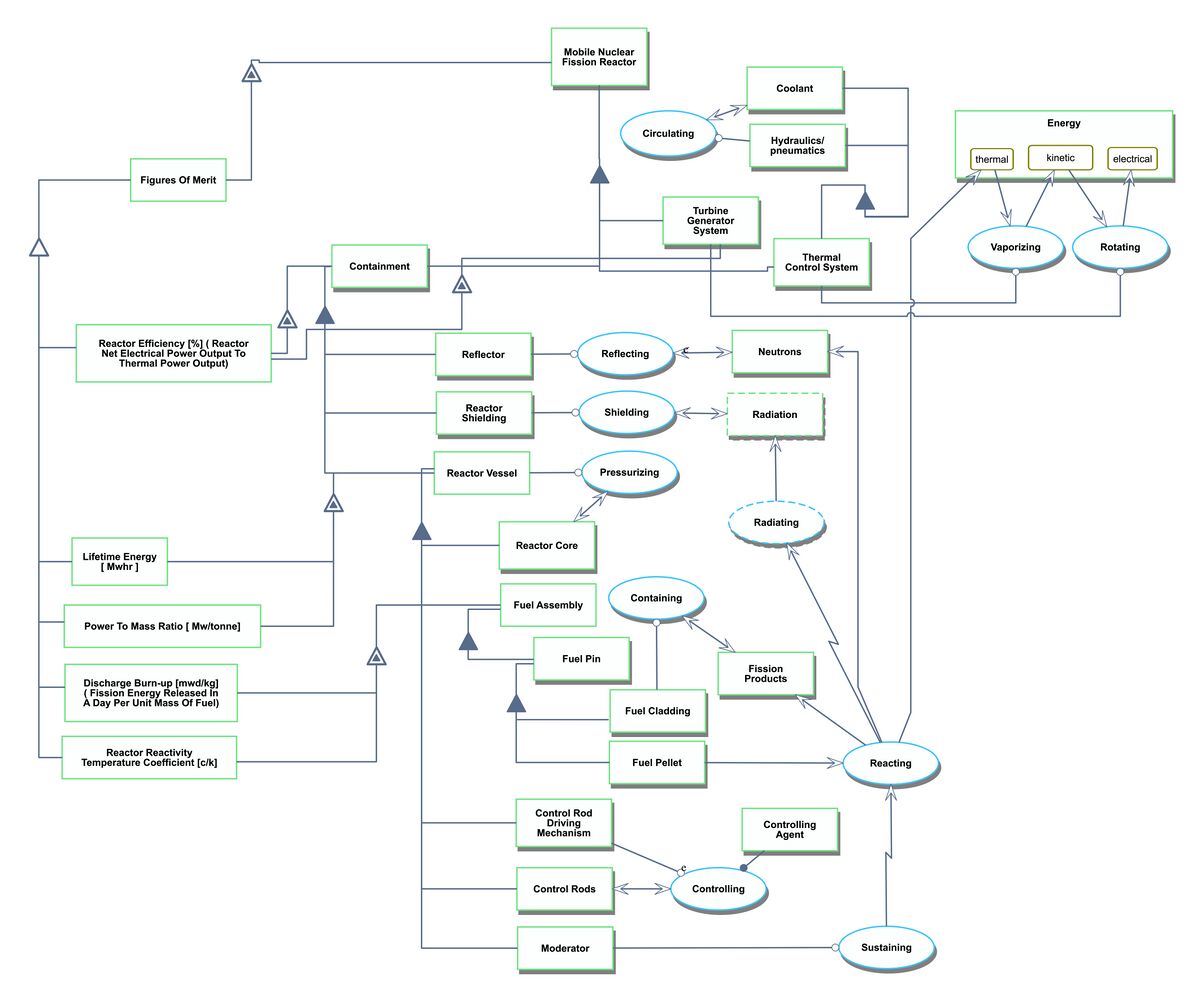
Shown below is an OPD of the Mobile Nuclear Fission Reactor system that was generated by OPCloud. The OPD captures the figures of merit, processes, and components involved with a MNFR. The key relationship to note from the OPD is that the containment system generates thermal energy and the power conversion system (which refers to the turbine generator system and thermal control system combined) converts the thermal energy to kinetic energy and then to electrical energy.
Figures of Merit (FOM)
The following FOMs were selected to track the technological progress of MNFRs over time.
| Figure of Merit | Units | Description |
|---|---|---|
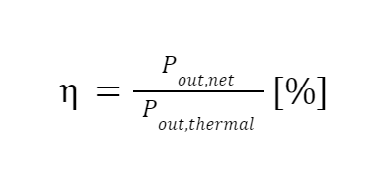
| Reactor Efficiency | [%] | Proportion of electrical power generated from thermal power generated |
| Discharge Burnup | [MWd/kg] | Fission energy released in a day per unit mass of the fuel |
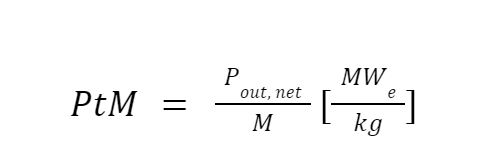
| Power to Mass Ratio | [MW/kg] | Electrical power generated per unit mass of the system |
| Reactor Reactivity Temperature Coefficient | [c/K] | Change in reactivity per degree Kelvin |
| Lifetime Energy | [MWhr] | Reactor net electrical power output multiplied by its lifetime in hours |
It is important that the figures of merit selected are traceable to high-level stakeholder objectives which are shown below for different phases of a mission involving MNFRs to provide power for human habitats on other planetary surfaces:
Launch
[A] The system should target to have as low of a mass it can for the amount of power it can generate because launch costs are dependent on mass.
Operation
[B] The system should target to provide power for long periods of time without maintenance/resupply because maintenance/resupply capabilities are more costly and complex the farther the farther away the proposed habitat is from Earth.
[C] The system should be operated safely
End of Life
[D] The system should aim to have low waste production since nuclear waste is hard to manage.
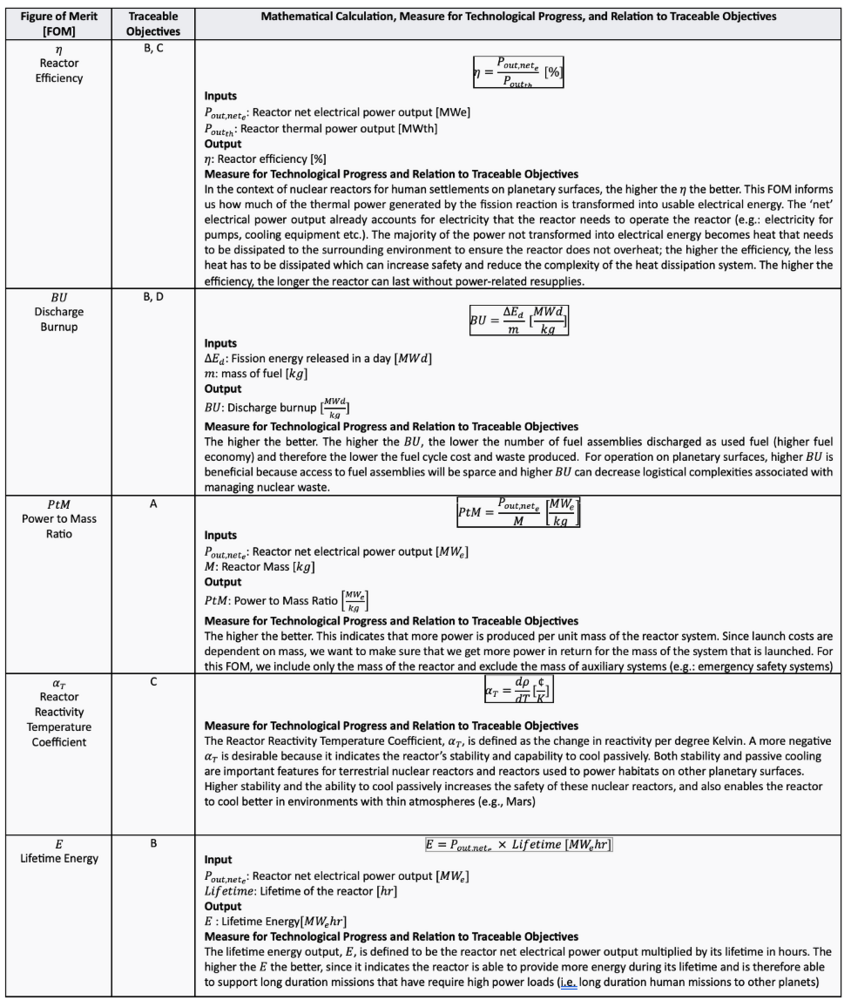
The table below describes each FOM mathematically and indicates which objective they are traceable to. It also discusses whether higher/lower values of each FOM indicate technological progress and how each FOM is related to the objective it traces.
Tracking FOMs over Time [dFOM/dt]
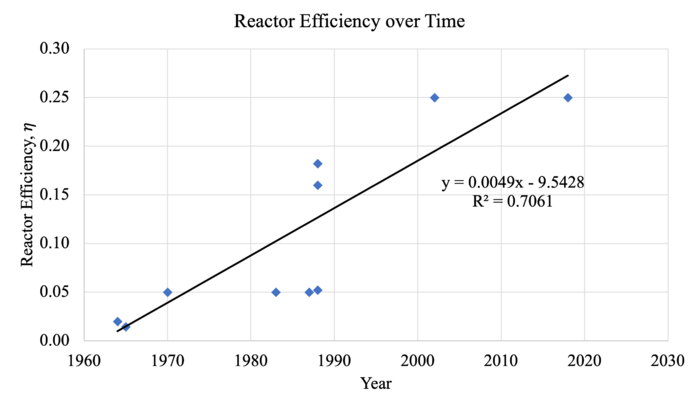
Background information and data was collected for the reactor efficiency FOM, which is described mathematically in the table above. Relevant data was collected for 11 space reactor power systems between the years 1964 to 2018 as shown below.
Figure 1. Plot showing the reactor efficiency over time for eleven space reactor power systems.
When a linear trend line is fitted to the data points, the equation yielded is:
y = 0.0049x - 9.5428 with an R^2 value of 0.7061
The gradient of the trendline (0.0049) indicates that the linear rate of improvement is 0.49% per year. The R2 value of 0.7061 generally indicates a good fit of the linear model to the data.
Theoretical limit
The theoretical limit for reactor efficiency is 0 < efficiency < 1. The lower bound limit of the scale where effiency = 0 suggests that none of the thermal power generated by the reactor is converted to electrical power. The upper bound limit of the scale where efficiency = 1 suggests that all the thermal power generated by the reactor is converted to electrical power. Due to the conservation of energy, it is theoretically not possible for effiency > 1 because this would indicate that energy is being produced in the process of converting a fixed amount of thermal energy to electrical energy. The efficiency also cannot be less than 0 because this indicates that energy is being consumed in the process of converting a fixed amount of thermal energy to electrical energy. We note that there is a limitation to the linear model shown in Figure 1 because it indicates that reactor efficiency can be greater than the theoretical upper bound of 1 in the far future. Thus, the linear model may only be valid to project reactor efficiency in the short term (e.g. 5-10 years ahead).
Estimation of the Location in Technology Lifecycle
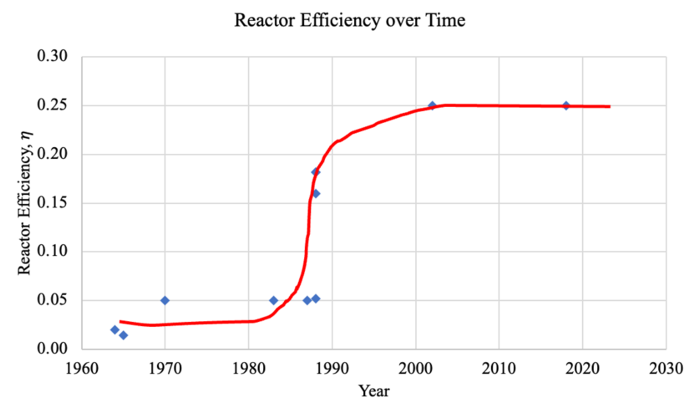
One might argue that there is a complete S-curve relationship (i.e.the technology has reached “stagnation”) between the reactor efficiency over time as shown in Figure 2.
Figure 2. Plot showing the reactor efficiency over time with a possible S-surve relationship
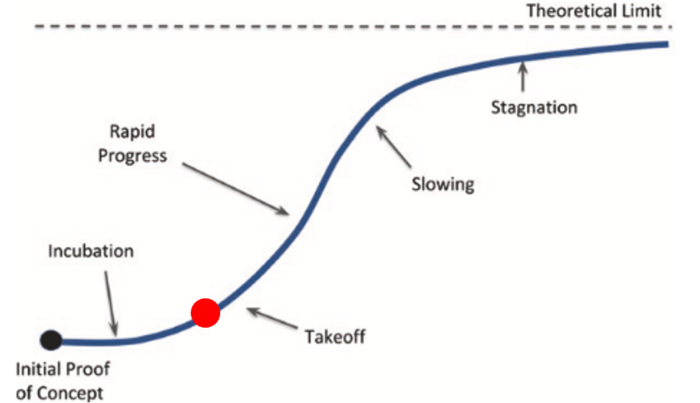
However, the upper asymptomatic limit that appears to occur at effiency = 0.25 is far below the theoretical upper bound of efficiency = 1. This could suggest that the improvements in reactor efficiency over time shown in Figure 2 are actually indicative of stepwise incremental progress in the FOM rather than an S-curve progression. In addition, the data collected is for only one FOM, meaning that it may not holistically track mobile nuclear reactor technology development over time. There is evidence that points to the mobile nuclear reactor technology being located in the “incubation” phase before reaching the “take–off” phase in the technology lifecycle (marked in red in Figure 3).
Figure 3. S-curve of a technology with a red mark indicating where the mobile nuclear fission technology is located. Note that the S-curve diagram was obtained from Pg 108, Fig 4.15 of the Technology Roadmapping and Development textbook by Prof. Olivier de Weck
Between 1964 to 2018, which spans over 5 decades, fewer than 15 mobile nuclear reactors for space power systems were developed. Of the 11 reactor systems that data was collected for in this problem for this assignment, some systems were experimental and ground tested while some were launched and operational (hence the mobile nuclear reactor technology is past the “Initial Proof of Concept” phase). The lack of funding/interest that cut some programs short (such as SAFE-400 and Topaz 2) and prevented them from progressing to flight tests, paired with data points that are too sparse to consistently show “rapid progress” indicates that the technology likely did not make it past the “take off” stage.
Alignment with Company Strategic Drivers : FOM Targets
Positioning of Company vs Competition: FOM Charts
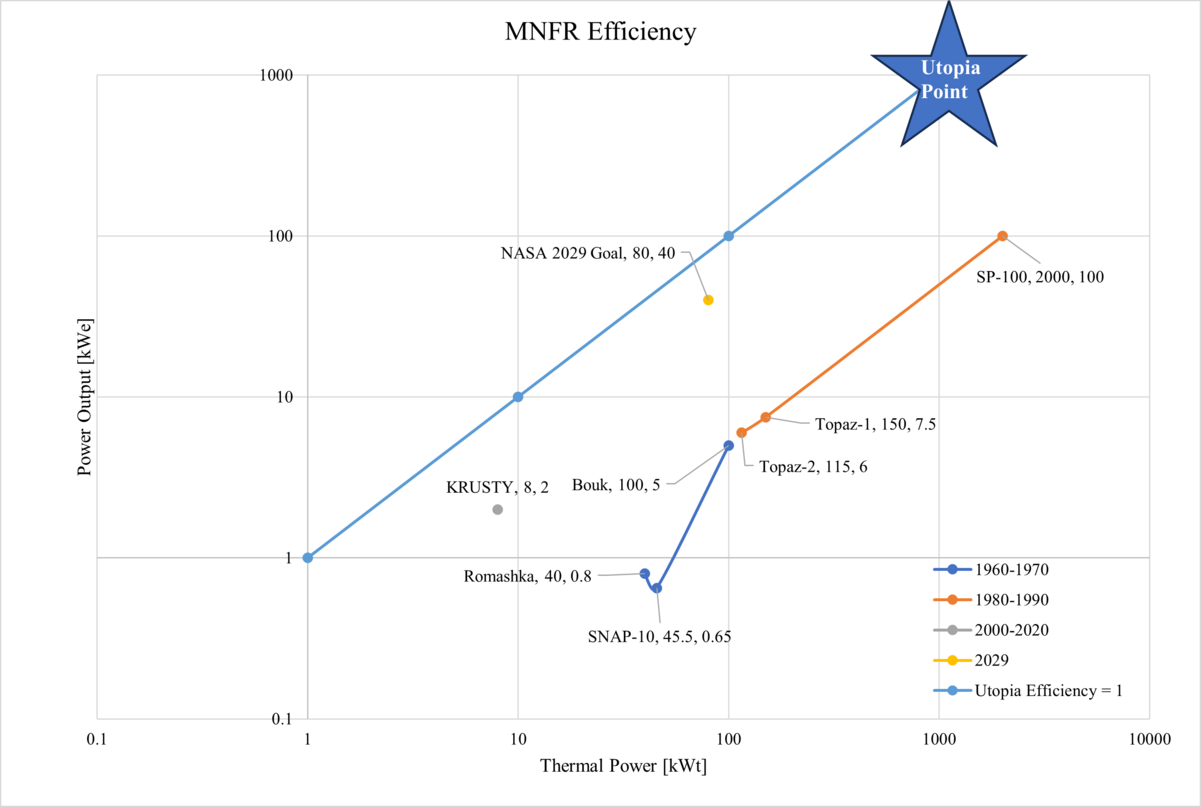
The UTOPIA point of lifetime energy is to have the highest power output for the longest duration. That of reactor efficiency, is a value of one, since this would mean 100% of the thermal energy released during the fission process is converted into electrical energy. Since the intention of current development of mobile nuclear fission reactors is to provide sufficient power for a crewed long duration space mission, the pareto front of lifetime energy as well as reactor efficiency is set by KRUSTY (Chapter 5, Figure 5-20). KRUSTY has the highest operational lifetime compared to previously developed MNFRs. Though the previously developed SP-100 has a high power output with an operational lifetime of 7 years, it was intended for short term military purposes, and as seen in the efficiency evaluation, is less efficient than KRUSTY. The earlier designs in the 1960s were also generally intended for military purposes, and though intended for longer operational lifetimes, when tested ran into various technical issues that ended up with system failure early on.
Technical Model: Morphological Matrix and Tradespace
Decision Variable Selection Based on Figures of Merit Governing Equations The most important Figure of Merit defining mobile nuclear fission reactors with respect to other electrical power generating technologies for space missions is lifetime energy. This is defined as,
in which the defining variables are the net electrical power produced by the technology in megawatts, and the operational lifetime of the technology in hours, i.e., the number of hours that the technology may generate electrical power.
This is often set as a mission requirement. For example, NASA approximates that a human operated Martian habitat would require 40 kW of electrical power [10]. This is based on the number of years the astronauts expect to reside and conduct nominal operations on the Martian surface, and how much power is required to maintain the Martian facilities.
This value directly translates to the capability of the MNFR design through the MNFR efficiency Figure of Merit,
The decision variables that directly affect the electrical power that may be generated from the nuclear fission is the percent of the uranium used in the fission process that is enriched, and the number of MNFR units that are then required based on this efficiency to generate the electrical power required by the mission.
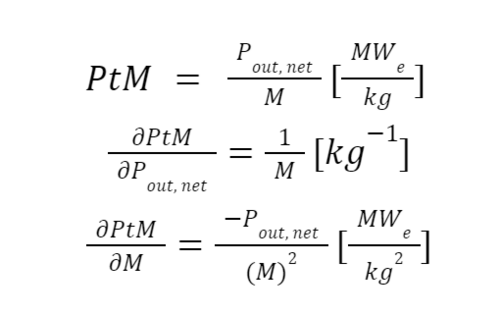
With respect to the number of required MNFR units to meet the power requirements, the mass of each unit becomes important when considering feasibility of the mission, i.e., the launch vehicle capability to bring over a number of the units given the amount of available payload mass. The percent enriched uranium also affects the fuel mass used which directly factors into the reactor mass. The mass and output electrical power directly factor into the power to mass ratio Figure of merit,
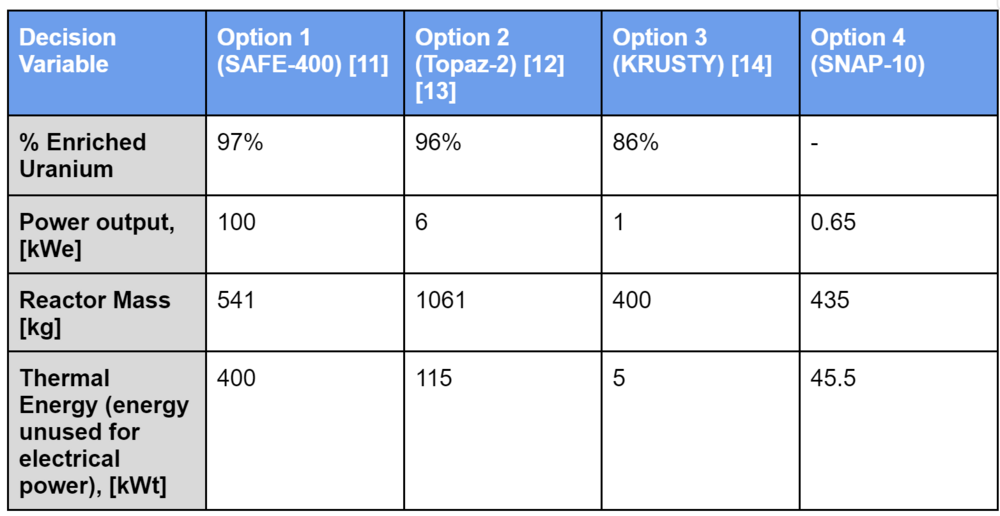
Using these equations, the following primary design decision variables have been selected. The option data is based on previous MNFR design data, all of which have been operated.
Sensitivity Analysis- Gradient Derivative Method and Tornado Chart
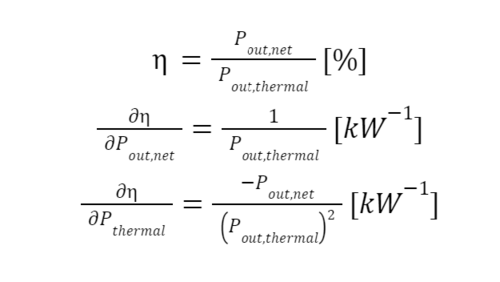
Based on the available data and the governing equations, a sensitivity analysis will be done for the reactor efficiency and power to mass ratio Figures of Merit. This will be done by analytically solving for the partial derivatives of the governing equations with respect to the decision variables and will then calculate the values using the design data for the KRUSTY MNFR as shown above. KRUSTY was selected since NASA tested the unit, and it is the most recent product undergoing development for the purpose of reaching NASA’s 2029 technical goal, which will enable long duration space travel. These values will then be normalized in order to observe the impact on the system performance in terms of percentage change that results from a one percent change in the design variable.
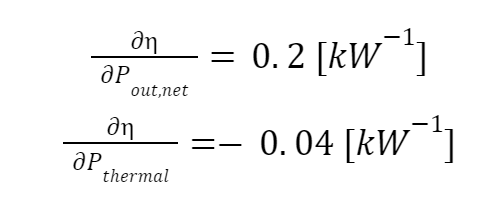
Figure of Merit: Reactor Efficiency Solving for the analytical partial derivatives yield,
Using the design data for KRUSTY yields,
Normalizing these values yields,
Figure of Merit: Power-to-Mass Ratio Solving for the analytical partial derivatives yield,
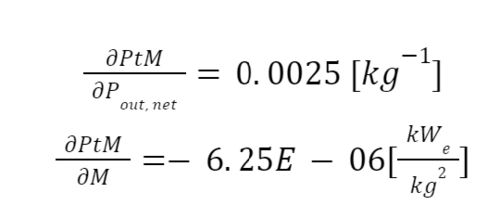
Using the design data for KRUSTY yields,
Normalizing these values yields,
The normalized values reveal that increasing the mass of the MNFR by one unit reduces the power-to-mass ratio by 1%. Increasing the thermal output by one unit reduces the reactor efficiency by 1%. Increasing the output power by one unit increases the power-to-mass ratio and reactor efficiency by 1%.
Key Publications and Patents
References
- https://en.wikipedia.org/wiki/Romashka_reactor
- https://beyondnerva.wordpress.com/tag/bes-5/#:~:text=The%20first%20BES%2D5%20to,launched%20on%2025%20December%201971).
- https://www.osti.gov/servlets/purl/10184691
- https://inis.iaea.org/search/search.aspx?orig_q=RN:20046219
- https://fti.neep.wisc.edu/fti.neep.wisc.edu/neep602/SPRING00/lecture35.pdf
- https://pubs.aip.org/aip/acp/article/608/1/578/568965/Design-and-analysis-of-the-SAFE-400-space-fission
- https://pubs.aip.org/aip/acp/article/608/1/578/568965/Design-and-analysis-of-the-SAFE-400-space-fission
- https://world-nuclear.org/information-library/non-power-nuclear-applications/transport/nuclear-reactors-for-space.aspx
- https://ntrs.nasa.gov/api/citations/20205009350/downloads/03-KRUSTY%20Reactor%20Design.pdf
- https://ntrs.nasa.gov/api/citations/20160014032/downloads/20160014032.pdf
- https://watermark.silverchair.com/578_1_online.pdf?token=AQECAHi208BE49Ooan9kkhW_Ercy7Dm3ZL_9Cf3qfKAc485ysgAABW0wggVpBgkqhkiG9w0BBwagggVaMIIFVgIBADCCBU8GCSqGSIb3DQEHATAeBglghkgBZQMEAS4wEQQMzkR8c5zIbsawQuJiAgEQgIIFIElva-KinjjKc4FbjWcndk5ag0ijNkLrO0aw4Mpi8UGlS9auSdB2dQ6G_-jCqDrazbj8Rs7HAcqYWJf7xbDGQDIGdYYGLHIvoUW5Jn99UOcTiQKHAyJLAm6hK9KCipx4OUCRGFPvPxdHkxG0fXwHvlJ10Wa8lT3e1WZFk2QZddBWiDkkJtRAUKpWO8nJBQrGLCGeKGmpYgcX0pXDYNPxTN8DlHwP0YpVzrjUQkq-I-dlI-ecgs9zfXoP26aUGxo2-vX1HCPw7WyPlyBUEPowyhcxRKXxxqoaCO1DX61aUUV3Lh7NV3UcnbF82EnQUZowPjcHDyt2ttzXo_5pzODg0-h0yg3UKVRJKKAhwOvbIUsFL6nfZ0b-hiwtDi2GtbkXdtXppgXgBhEJc-v8kqJwW5VI0_BKV94SXJ2HxVQN002I0W6RWR1v9FAJdjR8DJXW710swYH_b_0SvCs3mMO-ExrGSNTbRW7WGEI1Pk-3uGg1WOEEwjgfOsMS2UP9A9ANJpOIPD32dZjW2Ja1sseDOsNhhBbuYO6zBRKccnv-7x_muuXT3dVFxIPYunz1BqM_TA4I-E4KWNu2ud7MhKD5WBEGXV9V5D1mxLvN5YmBNkQp5DiBZ8vUY4pdhH8AbH_8oSoXHBJ087vo8HRxFJ8psUNKf5yZTONZP9ujYCXLgKqkcRCO9ay2ID5ujejJEMGww0wyRD91tFU_HY-45wrn57HG7KGCvzhFoew_-22FmBaEnsM_eusVHS_W22y6y4sNSQlC7c2M84zV3IpTJUcMpE4FT6F-NRbGTaO79emUx9GSAUIxlKfGl1dk04wAzF2yi4Z3u9_ivXchrTI9D4l2m46a6opwv7QpVvJ37jVTZv_toa6MffGT9B0zdhXGROpSSKYKxh0MoK8tGFXYalDI-9ighRhO1ej5J-9mYH5AdYkXKGaoWrBlgURm3UrjF5mNCJY8C7TiFvljWtZ0g59EIMma1OfqZRKDMXUm4iTQE9Xy1uvB6enV1ywFanbZ4ETR_Qr59lnHZX8HsL3DwoWeEpkEFtFiqxc_aF-ngVrjgp94161V_iWyRddniTuDTExWXBtZDAuhOLkaehV7UgNdrGQW2MYveSSGeGUpnueswpSoRed_wQnXWMKprABxu9z9HqWcuzy_pt8Ssfac36XVsvbVMlE48jg2PynBu13hEqEjOY0zJymkhFiEQCMaKgXutG-kwk7o0KL2CJDXee1uHw45_fjD5pSD5unNYj5RYfkb1mrmslKPT81pb6SsPsXw1FSELf8JTzEPgpojuHUljFk54q7NjLzFCi5cwtpEAZJWB0_cjbY-AjTVdwv8EVBgNbuKQEVVU7UCchJuhF0mmddRJCP6rMxOqt8hT-CSLxypdMsFDVMbiqtVYUkWvX7_ofAKMUS_OqPcv3QgUjesvY3tLoW2Ps3KL9KwGIZjuzRl8ORoqQc0RbLRs5Gql870bAjZi37XN8c0gt94ObXE9LRgp8ilOcUdiGu2t1LiDqzvy0RSpLb13LdPA_u9xKIiuRG0b1bHyfKOhq4OtNyIk9EVeAio4YZtDDvmc_3aPnc7RCW483L2E4rm0_RG9AaJ2kBpk5dwaCcIFHFrJO06pLBMerkDvzbPSsjcwsm4iUNH7JDru4mKsCFiZ6kBoychdyhtrI-91JNi_r_lFeAaoUaA-YEsLjJgd6_-2zFMVyy3VFBy58y_2Kn6wn5eyH0-4u5JY6qJ4qlbhTuKtcLJQM4
- https://inis.iaea.org/collection/NCLCollectionStore/_Public/25/040/25040534.pdf?r=1
- https://fti.neep.wisc.edu/fti.neep.wisc.edu/neep602/SPRING00/lecture35.pdf
- https://ntrs.nasa.gov/api/citations/20205009350/downloads/03-KRUSTY%20Reactor%20Design.pdf
