Difference between revisions of "Nuclear Fusion"
| Line 136: | Line 136: | ||
Fusion power P_fus: refers to the magnitude of thermal power generated within a fusion reactor (MW). The power released from a deuterium-tritium DT fusion reaction can be described by the following equation [6]: | Fusion power P_fus: refers to the magnitude of thermal power generated within a fusion reactor (MW). The power released from a deuterium-tritium DT fusion reaction can be described by the following equation [6]: | ||
[[File:team9_5_2.png]] | [[File:team9_5_2.png|500px]] | ||
Where n is the number density of the reactants, 〈σv〉_DT is the reactivity of the DT fuel, E_DT is the total energy released per fusion reaction, and V_P is the volume of the plasma. As shown in various sources, this equation can be modified to reflect an expression of key reactor design parameters: magnetic field strength (B), toroidal radius (R) and normalized pressure 〖(β〗_N): | Where n is the number density of the reactants, 〈σv〉_DT is the reactivity of the DT fuel, E_DT is the total energy released per fusion reaction, and V_P is the volume of the plasma. As shown in various sources, this equation can be modified to reflect an expression of key reactor design parameters: magnetic field strength (B), toroidal radius (R) and normalized pressure 〖(β〗_N): | ||
| Line 150: | Line 150: | ||
[[File:team9_5_5.png]] | [[File:team9_5_5.png|500px]] | ||
<br> | <br> | ||
Figure 1. Sensitivity analysis of fusion power to key design parameters. The “0” value represents a reference value of 500MW. | Figure 1. Sensitivity analysis of fusion power to key design parameters. The “0” value represents a reference value of 500MW. | ||
[[File:team9_5_6.png]] | [[File:team9_5_6.png|500px]] | ||
<br> | <br> | ||
Figure 2. Sensitivity analysis of the gain factor to key design parameters. The “0” value represents a gain of 10. <br> | Figure 2. Sensitivity analysis of the gain factor to key design parameters. The “0” value represents a gain of 10. <br> | ||
| Line 209: | Line 209: | ||
[[File:team9_5_7.png]] | [[File:team9_5_7.png|500px]] | ||
<span style="color: blue;">Blue</span>: tokamak, <span style="color: lightblue;">Light blue</span>: Stellarator, <span style="color: purple;">purple</span>: spherical tokamak, <span style="color: orange;">yellow</span>: reversed-field pinch, <span style="color: green;">green</span>: spheromak, <span style="color: red;">red</span>: field-reversed configuration [9] | <span style="color: blue;">Blue</span>: tokamak, <span style="color: lightblue;">Light blue</span>: Stellarator, <span style="color: purple;">purple</span>: spherical tokamak, <span style="color: orange;">yellow</span>: reversed-field pinch, <span style="color: green;">green</span>: spheromak, <span style="color: red;">red</span>: field-reversed configuration [9] | ||
Revision as of 04:43, 7 November 2023
Technology Roadmap Sections and Deliverables
- 1NCF - Nuclear Fusion
Roadmap Overview
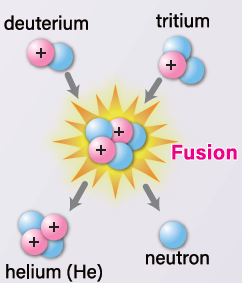
Fusion power refers to the generation from the energy released by merging, or fusing, two atomic nuclei to generate energy. The energy generated from this reaction comes from the difference in mass between the two individual nuclei and the resulting lighter nucleus; this difference in mass is converted to energy according to Einstein’s famous equation, E=mc^2. There are different atoms that can be combined to generate fusion energy, but the most common reaction explored for commercial purposes involves two isotopes of hydrogen, deuterium, and tritium, in a reaction referred to as DT fusion. These two isotopes are brought in close proximity in a fusion reactor at over 100 million Celsius and combine to produce helium, releasing high-energy neutrons that can be captured to generate heat and run a conventional turbine to generate electricity.
D+T -> He+n
where
- D: Deuterium
- T: Tritium
- He: Helium
- n: neutron
Fusion reactions occur when two or more nuclei come close enough to each other for a long enough time that the nuclear forces attracting the nuclei exceed the electrostatic forces pulling them apart, fusing them into a heavier nucleus. To realize nuclear fusion for energy generation, there are technical challenges, such as plasma control and energy supply, to create and maintain high temperatures and high pressure.
There are multiple reactor concepts being explored to enable a fusion reaction, which involve the use of a strong magnetic field (magnetic confinement), powerful lasers (inertial confinement), or a hybrid of inertial and magnetic confinement methods (e.g., magneto-inertial confinement). The main applicable markets for fusion power are the electricity market, industrial heat, and space propulsion.
Design Structure Matrix (DSM) Allocation
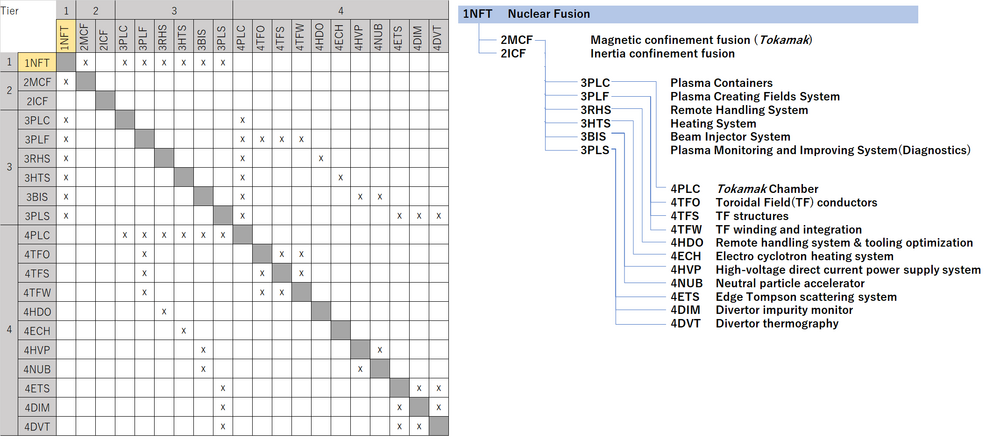
The picture above is 1NCF nuclear fusion tree. The 'Tokamak' represents one of the approaches within Magnetic Confinement Fusion. It is a device specifically designed for nuclear fusion that confines high-temperature plasma using an axisymmetric toroidal (doughnut-shaped) magnetic field. As a container for plasma, it is associated with the level 3 subsystems, as depicted in the DSM.
The DSM and tree both show that 1NCF(2MCF) requires the following technologies at the subsystem level 3:
- 3PLC Plasma Containers
- 3PLF Plasma Creating Fields System
- 3RHS Remote Handling System
- 3HTS Heating System
- 3BIS Beam Injector System
- 3PLS Plasma Monitoring and Improving System(Diagnostics)
Each level 3 subsystem also require enabling technologies shown as level 4 systems:
- 4PLC Tokamak Chamber
- 4TFO Toroidal Field(TF) conductors
- 4TFS TF structures
- 4TFW TF winding and integration
- 4HDO Remote handling system & tooling optimization
- 4ECH Electro cyclotron heating system
- 4HVP High-voltage direct current power supply system
- 4NUB Neutral particle accelerator
- 4ETS Edge Tompson scattering system
- 4DIM Divertor impurity monitor
- 4DVT Divertor thermography
Roadmap Model using OPM
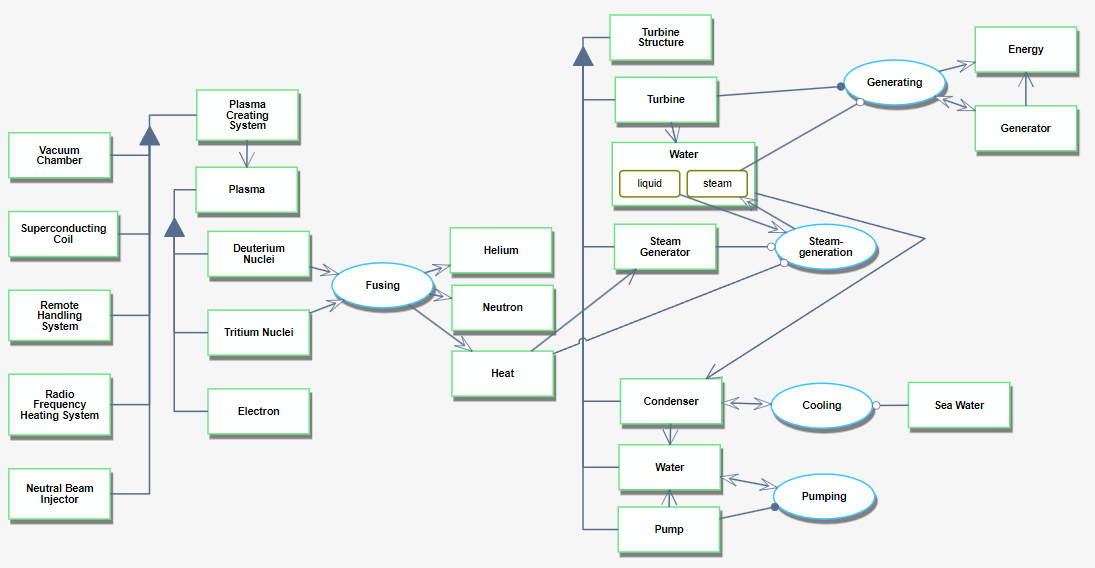
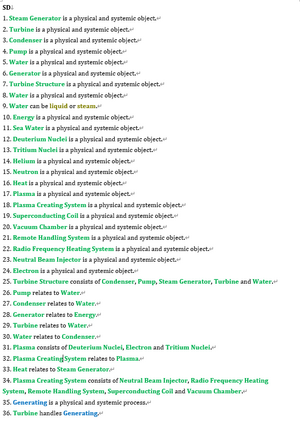
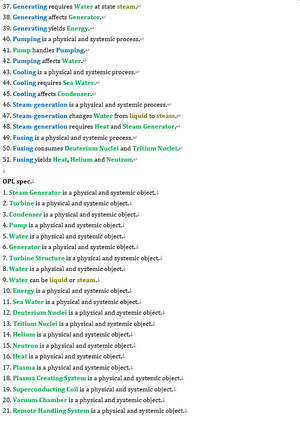
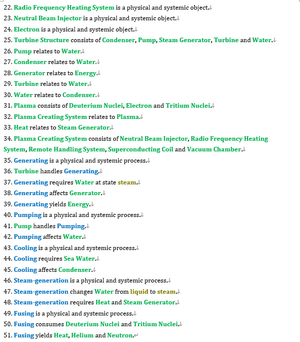
The OPM and OPL of one possible fusion technology system are depicted below. This technology assists in harnessing nuclear energy to generate power with lower risk than nuclear generation in a controlled environment and produces less radioactive waste.
Figures of Merit
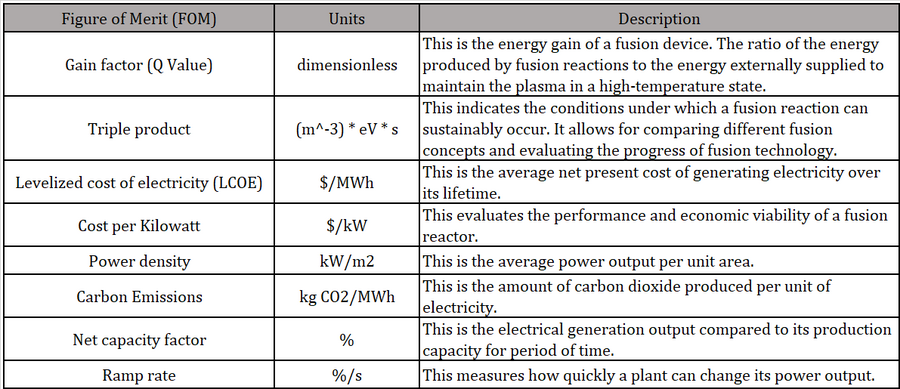
The table below shows a list of FOMs of nuclear fusion.
Cost per Kilowatt, Power density, Carbon Emissions, Net capacity factor, Ramp rate are figures of merit relevant to the electricity market. These metrics of fusion energy are vital indicators of its competitiveness compared to other energy sources such as solar, wind, and fossil fuels.
Gain factor(Q-Value)
The Q-value is a crucial metric for evaluating the performance and viability of a fusion device. A device with a high Q-value suggests a significant net energy gain, increasing its potential as a practical energy source.
Gain factor (Q-Value) = (Energy produced by fusion reactions) / (External energy input to the plasma)
The other is figures of merit relevant to the electricity market: Cost per Kilowatt, Levelized cost of electricity (LCOE), Power density, Carbon Emissions, Net capacity factor, and Ramp rate. These metrics of fusion energy are vital indicators of its competitiveness compared to other energy sources such as solar, wind, and fossil fuels.
Triple product
Triple product can be used to compare performance across various approaches to fusion, such as magnetic confinement schemes, inertial confinement schemes, and magneto-inertial schemes, being independent of the scheme used to create the fusion plasma. It is defined as the product of three factors: plasma density, temperature, and confinement time. Triple produc is expressed as:
Triple product ((m^-3) * eV * s) =density(1/m^3) × temperature(eV) × confinement time (s)
Where
- Density is the number of nuclei per unit volume
- Temperature is the kinetic energy of the particles in the plasma (the unit for temperature in fusion contexts is usually expressed in electron volts (eV))
- Confinement Time is the average time that a particle remains in the plasma before escaping.
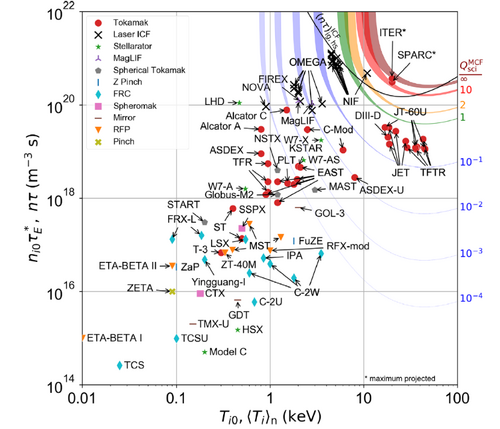
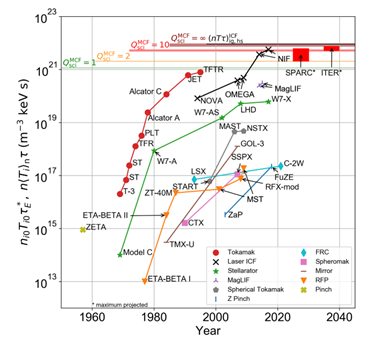
The triple product is the main figure of merit used to measure progress in fusion energy research. Even though cost-per-KW is more appropriate when comparing power generation technologies, fusion technology is at too early stages to come up with reliable estimates of cost and progress over time. Figure 1 below shows the record values for a given fusion confinement concept along with the theoretical limit [1]. This theoretical limit occurs due to operational limits in plasma density, and a parameter called beta, β, the ratio of plasma pressure to magnetic pressure [2].
Figure 1. Triple product achieved for various fusion confinement concepts [1]
The rate of improvement was estimated for Magnetic Confinement fusion (red line in Figure 1); this is shown in Figure 2. The rate of improvement was found to be uneven, with large values at the beginning ~200% and then slowing down to about 35%. This decreased rate of improvement is well documented in the literature and is attributed to the international research community focusing on the International Thermonuclear Experimental Reactor (ITER). This particular confinement method appears to be in the portion of the S curve with slower progress. In contrast, the Inertial confinement fusion (black line in Figure 2) appears to be in the rapid progress phase (the rate of improvement was not calculated)
Figure 2. Rate of improvement for the triple product of magnetic confinement fusion. Raw data obtained from ref. [1].
Levelized cost of electricity (LCOE)
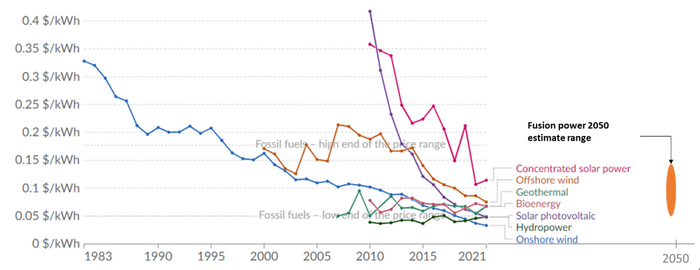
The most important FOM for power generation is the levelized cost of energy (LCOE). However, with the increased awareness of the negative impacts of carbon emissions and the policy trends on carbon caps and taxes, a FOM that is increasing in importance is the amount of emissions (particularly carbon dioxide) generated per unit of power. This is evident from the increased adoption of renewable energy sources. However, renewables fall short on at least two FOMs: power density (power per unit of area) and capacity factor (due to their intermittent nature). This represents an opportunity for fusion technologies to disrupt the electricity market, as it not only produces zero carbon emissions, but is also dispatchable (not intermittent in nature), and has significantly high energy density compared to other renewable sources. Even though the current projections for the LCOE of fusion power are highly uncertain and the conservative cost projections are not necessarily competitive with other power generation sources [3], they bring a unique combination of superior performance in other increasingly important FOMs such that when the LCOE projections become sufficiently low (assuming some of the technical challenges affecting economic viability are resoled), there will be a high likelihood of becoming a disruptive technology. Given the low maturity of the technology, it is not possible to plot FOM improvement over time for fusion in terms of FOMs that are relevant in electricity markets. Nevertheless, current projections for the main FOM (LCOE) compared to other technologies is shown in Figure 3.
Figure 3 Levelized cost of energy by technology [4]. LCOE projections for fusion power were taken from two recent estimates [3] [5]
Alignment with Company Strategic Drivers
This roadmap is for a hypothetical fusion startup aiming to develop a competitive magnetically confined fusion reactor concept. The key strategic FOM targets for the first experimental reactor for this company are the following:
| FOM | Target |
|---|---|
| Gain (Q) | 10 |
| Fusion Power | 100MW |
Positioning of Company vs. Competition
The positioning of the company with respect to the gain factor (Q) and triple product are shown below (purple star) (Taken from [6])
Technical Model
The two figures of merit (FOM) explored for sensitivity analysis of magnetic confinement fusion are
1) fusion power 〖(P〗_fus) and 2) scientific gain factor 〖(Q〗_sci). A description of these two FOMs, along with the key design parameters is provided below: Fusion power P_fus: refers to the magnitude of thermal power generated within a fusion reactor (MW). The power released from a deuterium-tritium DT fusion reaction can be described by the following equation [6]:
Where n is the number density of the reactants, 〈σv〉_DT is the reactivity of the DT fuel, E_DT is the total energy released per fusion reaction, and V_P is the volume of the plasma. As shown in various sources, this equation can be modified to reflect an expression of key reactor design parameters: magnetic field strength (B), toroidal radius (R) and normalized pressure 〖(β〗_N):
2) Scientific gain Q_sci: The ration of the power generated in the fusion reaction to the externally provided heating power (unitless). The derivation of the equation in terms of useful parameters is not straightforward and beyond the scope of this class, only its relationship to useful design parameters is shown below for a tokamak [7]:
The sensitivity for these two FOMs was evaluated for magnetic field strength (B), toroidal radius (R) and normalized pressure 〖(β〗_N). The reactor being built at the International Thermonuclear Experimental Reactor (ITER) was used as reference reactor, with a P_fus of 500MW and Q_sci of 10 for simplicity. To study the sensitivity of the two FOMs to these design parameters, the three design parameters (B, R, BN) were varied from low values (75% the reference value, or a factor of 0.75) to high values (125% the reference value). The results from the sensitivity analysis are shown in the figures below.
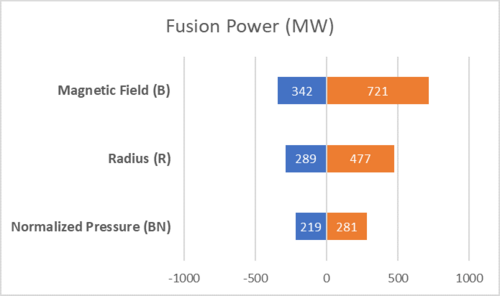
Figure 1. Sensitivity analysis of fusion power to key design parameters. The “0” value represents a reference value of 500MW.
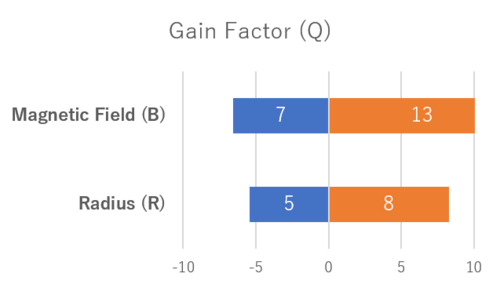
Figure 2. Sensitivity analysis of the gain factor to key design parameters. The “0” value represents a gain of 10.
As can be seen in the figures above, a strong dependence can be seen on the magnetic field strength (B). This explains the relatively recent push in the private fusion sector to implement high-temperature super conductive magnets that can result in higher reactor performance with high power densities, such as Commonwealth Fusion Systems in the US and Tokamak Energy in the UK. The effect of larger radius explains the push to larger reactor designs in the evolution of fusion research (before breakthroughs in higher magnetic field HTS magnets). Finally, the effect of beta pressure is reflected in the pursuit of various magnetic confinement reactor geometries and configurations such as Tokamak, spherical tokamaks, stellarators, spheromak, etc., all of which implement magnetic confinement but can achieve different normalized pressure (BN).
Morphological Matrix
Below is a morphological matrix showing the main design options for a magnetically confined fusion reactor.
| Option #1 | Option #2 | Option #3 | |
|---|---|---|---|
| Confinement duration | continuous | long pulse | N/A |
| Magnetic field topology | Open | Closed | N/A |
| Aspect ratio (major/minor radius) | High | Medium | Low |
| Poloidal field source | Electric current | Magnetic field | N/A |
| Toroidal field strength | None | Moderate | High |
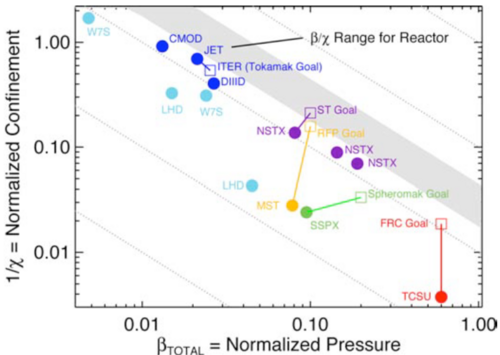
The various reactor concepts being explored both by research organizations and the private sector represent a combination of these options (tokamak, stellarator, spheromak, field-reversed configuration). These different options represent trade-offs in terms of plasma performance and design complexity (which relates to cost). Since a direct performance vs cost comparison is not possible given the early stages of reactor development and cost uncertainties, the approach taken by Shefield’s analysis [8] is used to form the basis of an initial trade space. In this approach, the ratio of normalized pressure〖 (β〗_N) to thermal diffusivity (χ) is calculated〖 (β〗_N/χ).
As shown above,〖 β〗_N is related to power density (quadratic relationship). Higher values of 〖 β〗_N are desired and can be achieved with increased magnetohydrodynamic stability inherent to the reactor design choices above [9].
Thermal diffusivity (χ) measures plasma energy transport and is inversely proportional to energy confinement time; confinement time is the time it takes for the plasma to lose its energy due to losses. Therefore, low values of thermal diffusivity are desired [9].
The figure below shows the normalized pressure versus thermal diffusivity for various magnetic confinement experimental reactor concepts and design goals. This figure was taken from [9] and and will be used as a starting point for a tradespace comparing alternate reactor concepts.
Blue: tokamak, Light blue: Stellarator, purple: spherical tokamak, yellow: reversed-field pinch, green: spheromak, red: field-reversed configuration [9]
Keys Publications and Patents
Bibliography
[1] S. E. Wurzel, "Progress toward fusion energy breakeven and gain as measured against the Lawson criterion," Physics of Plasmas, 2022
[2] A. Costley, "On the fusion triple product and fusion power gain," Nuclear Fusion, Volume 56, Number 6
[3] L. e. al., "Can fusion energy be cost-competitive and commercially viable? An analysis of magnetically confined reactors," Energy Policy, vol. 177, 2023.
[4] "Levelized cost of energy by technoloty, World," Our World in Data, [Online]. Available: https://ourworldindata.org/grapher/levelized-cost-of-energy.
[5] E. e. al., "Approximation of the economy of fusion energy," Energy, vol. 152, 2018.
[6] S. E. Wurzel, "Progress toward fusion energy breakeven and gain as measured against the Lawson criterion," Physics of Plasmas, 2022.
[7] D. Whyte, "Small, modular and economically attractive dusion enabled by high temperature superconductors," Phil. Trans. R. Soc. A 377, no. http://dx.doi.org/10.1098/rsta.2018.0354, 2019.
[8] J. Sheffield, "Physics requirements for an attractive magnetic fusion reactor," Nuclear Fusion, vol. 25, no. 12, p. 1733, 1985.
[9] "Report of the FESAC Toroidal Alternates Panel," 2008.
![Rate of improvement for the triple product of magnetic confinement fusion. Raw data obtained from ref[1]](/images/thumb/6/6b/Team9_11.png/500px-Team9_11.png)
