Difference between revisions of "User talk:SAF Brazil"
| Line 38: | Line 38: | ||
{| class="wikitable" | {| class="wikitable" | ||
|- | |- | ||
! Figure of Merit !! Units !! Description | ! Category !! Figure of Merit !! Units !! Description | ||
|- | |- | ||
| SAF unit cost || [USD/MJ] || Market cost of SAF per unit of volume or energy | | Competitiveness || SAF unit cost || [USD/MJ] || Market cost of SAF per unit of volume or energy | ||
|- | |- | ||
| Cost per reduced ton || [USD / tCO2e] || Incremental cost per ton of carbon equivalent reduced vs CAF | | Competitiveness || Cost per reduced ton || [USD / tCO2e] || Incremental cost per ton of carbon equivalent reduced vs CAF | ||
|- | |- | ||
| Investment potential || [USD / tCO2e] || Financing opportunity per potential unit output of technology | | Competitiveness || Investment potential || [USD / tCO2e] || Financing opportunity per potential unit output of technology | ||
|- | |- | ||
| Installation cost per unit || [USD / Vol] || Cost of deploying SAF production infrastructure relative to capability | | Competitiveness || Installation cost per unit || [USD / Vol] || Cost of deploying SAF production infrastructure relative to capability | ||
|- | |- | ||
| Energy efficiency || [%] || Energy input to produce SAF vs energy output in SAF | | Efficiency || Energy efficiency || [%] || Energy input to produce SAF vs energy output in SAF | ||
|- | |- | ||
| Feedstock crop yield || [Ton / ha] || Crop yield in volume produced per unit area | | Productivity || Feedstock crop yield || [Ton / ha] || Crop yield in volume produced per unit area | ||
|- | |- | ||
| Feedstock availability || [Ton / year] || Crop availability in volume produced per year | | Productivity || Feedstock availability || [Ton / year] || Crop availability in volume produced per year | ||
|- | |- | ||
| SAF conversion yield || [%] || SAF produced with relation to total refinery biofuel production | | Productivity || SAF conversion yield || [%] || SAF produced with relation to total refinery biofuel production | ||
|- | |- | ||
| Energy density || [MJ/Vol] || Energy content per unit volume of fuel | | Performance || Energy density || [MJ/Vol] || Energy content per unit volume of fuel | ||
|- | |- | ||
| Blend ratio of pathway/feedstock || [%] || Volume SAF relative to total volume of fuel after blend | | Performance || Blend ratio of pathway/feedstock || [%] || Volume SAF relative to total volume of fuel after blend | ||
|- | |- | ||
| Fuel consumption || [Vol/Time] || Fuel consumed per hour of flight to compare SAF vs CAF | | Performance || Fuel consumption || [Vol/Time] || Fuel consumed per hour of flight to compare SAF vs CAF | ||
|- | |- | ||
| Carbon savings potential || [tCO2e / MJ] || Potential reduction in emissions for use of SAF vs CAF as baseline | | Sustainability || Carbon savings potential || [tCO2e / MJ] || Potential reduction in emissions for use of SAF vs CAF as baseline | ||
|- | |- | ||
| Carbon emissions || [tCO2e / MJ] || Life-cycle carbon equivalent emissions to generate unit of fuel | | Sustainability || Carbon emissions || [tCO2e / MJ] || Life-cycle carbon equivalent emissions to generate unit of fuel | ||
|- | |- | ||
| Emission reduction factor || [%] || Percentage reduction per equivalent unit of use of SAF | | Sustainability || Emission reduction factor || [%] || Percentage reduction per equivalent unit of use of SAF | ||
|- | |- | ||
|} | |} | ||
Revision as of 02:15, 7 October 2024
Roadmap Creators: Gabriel Ruscalleda, Emilia Ospina Arango and Dawit Dagnaw
Time Stamp: XX December 2024
Technology Roadmap Sections and Deliverables
Our technology roadmap identifier is shown as:
- 3BSSAF - Brazil Solution - Sustainable Aviation Fuel
This indicates that we are dealing with a “level 3” roadmap at the product level, where “level 1” would indicate a market level roadmap, "level 2" would indicate our SAF Production and “level 3” or “level 4” would indicate an individual technology roadmap.
Roadmap Overview
(ADD OVERVIEW OF PROJECT)
Design Structure Matrix (DSM) Allocation
(DESCRIBE THE DSM)
Roadmap Model using OPM
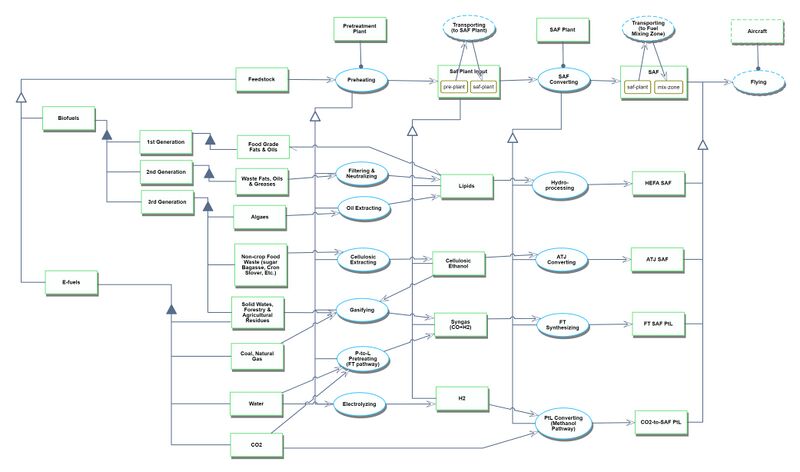
The Object-Process-Model (OPM) of the 2SAF - Sustainable Aviation Fuel roadmap is presented in the figure with the Object-Process-Language (OPL) below.
Figures of Merit
(ADD)
The table below shows a list of FOMs by which charging of electric vehicles can be quantified and compared
| Category | Figure of Merit | Units | Description |
|---|---|---|---|
| Competitiveness | SAF unit cost | [USD/MJ] | Market cost of SAF per unit of volume or energy |
| Competitiveness | Cost per reduced ton | [USD / tCO2e] | Incremental cost per ton of carbon equivalent reduced vs CAF |
| Competitiveness | Investment potential | [USD / tCO2e] | Financing opportunity per potential unit output of technology |
| Competitiveness | Installation cost per unit | [USD / Vol] | Cost of deploying SAF production infrastructure relative to capability |
| Efficiency | Energy efficiency | [%] | Energy input to produce SAF vs energy output in SAF |
| Productivity | Feedstock crop yield | [Ton / ha] | Crop yield in volume produced per unit area |
| Productivity | Feedstock availability | [Ton / year] | Crop availability in volume produced per year |
| Productivity | SAF conversion yield | [%] | SAF produced with relation to total refinery biofuel production |
| Performance | Energy density | [MJ/Vol] | Energy content per unit volume of fuel |
| Performance | Blend ratio of pathway/feedstock | [%] | Volume SAF relative to total volume of fuel after blend |
| Performance | Fuel consumption | [Vol/Time] | Fuel consumed per hour of flight to compare SAF vs CAF |
| Sustainability | Carbon savings potential | [tCO2e / MJ] | Potential reduction in emissions for use of SAF vs CAF as baseline |
| Sustainability | Carbon emissions | [tCO2e / MJ] | Life-cycle carbon equivalent emissions to generate unit of fuel |
| Sustainability | Emission reduction factor | [%] | Percentage reduction per equivalent unit of use of SAF |
Alignment with Company Strategic Drivers
Positioning of Company vs. Competition
Technical Model
CO2-eq emission model
Fuel consumption model
Feedstock availability model
Technical model integration
Financial Model
List of R&D Projects
Key Publications, Presentations and Patents
Technology Strategy Statement
References
[1] Reference 1 [2] Reference 2


