Difference between revisions of "1TIRE Tires"
| Line 45: | Line 45: | ||
==Comparison with Competitors and FOMs== | ==Comparison with Competitors and FOMs== | ||
[[File:ComparisonTires.png|700px]] | |||
The table above shows the values of different FOMs, for different companies and products. Data about rolling resistance was not easily accessible, as it is often kept a secret by companies, so we used as a proxy the mileage warranty. This parameter seems not to be strongly correlated with price (which was our initial assumption), but it might be due to marketing reasons. | |||
However, this provides useful insights for our company trying to enter the car tire market. A few takeaways that we can gather from this are that we should target a maximum price of $250, as we cannot afford to be more premium than the most premium brands in the market. But it shows that the market might benefit from a player with an even higher mileage warranty: this could be our niche. | |||
==Technical Model and Morphological Tradespace== | ==Technical Model and Morphological Tradespace== | ||
Revision as of 20:32, 31 October 2024
Roadmap creators: Roch Desrousseaux Ivan Goryachev Allie Stasior
Time stamp: October 9, 2024
Roadmap Overview
Although tires may seem like a simple form of technology, they are complex engineered products primarily composed of rubber (both natural and synthetic), carbon black, steel wire, fabric cord, and various chemical additives. The manufacturing process involves mixing these raw materials, extruding and calendaring the rubber compounds, building the tire structure layer by layer (including the inner liner, body plies, belt package, and tread), and finally curing the assembled tire in a mold under heat and pressure to vulcanize the rubber and create the final shape and tread pattern. This process results in a product that serves multiple crucial functions: providing traction for acceleration and braking, supporting the vehicle's weight, absorbing road shocks for improved comfort, and offering low rolling resistance for better fuel efficiency while ensuring durability and safety across various operating conditions.
The evolution of tire technology has progressed from solid rubber tires of the early 19th century to today's sophisticated pneumatic designs. Early automobiles used basic rubber tires, but the introduction of synthetic rubbers, radial construction (which replaced bias-ply designs), and advanced tread patterns has dramatically improved performance, longevity, and safety. Modern innovations focus on reducing rolling resistance for better fuel economy, developing run-flat capabilities for safety, and using sustainable materials to decrease environmental impact. Beyond automotive applications, tire technology impacts numerous markets, including aviation (where specialized tires must withstand extreme temperatures and pressures), agriculture (where tires must provide traction while minimizing soil compaction), construction equipment, bicycles, and even space exploration, with each application requiring unique design considerations and specialized materials.
Design Structure Matrix (DSM) Allocation
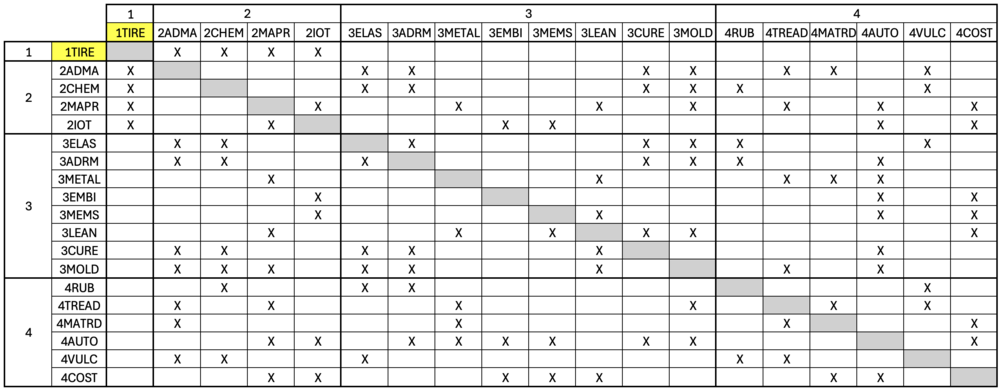
Our DSM Allocation for tires is based on a modern tire, with the different levels of technologies highlighted in different colors.
The following DSM shows the interdependencies between the different technologies that intervene in 1TIRE.
Roadmap Model using OPM
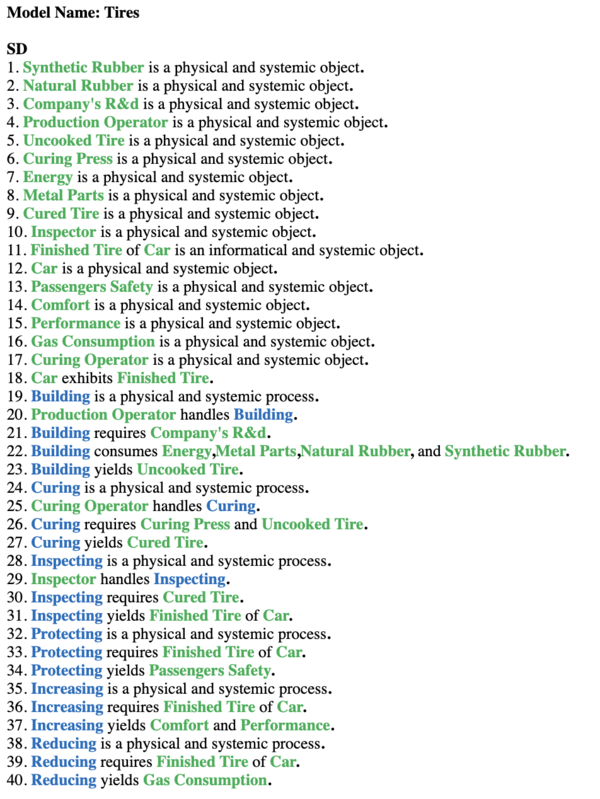
We have our Object Process Diagram (OPD) for the 1TIRE roadmap below. This strives to capture the various components of tires, and how they relate to relevant Figures of Merit (FOMs).

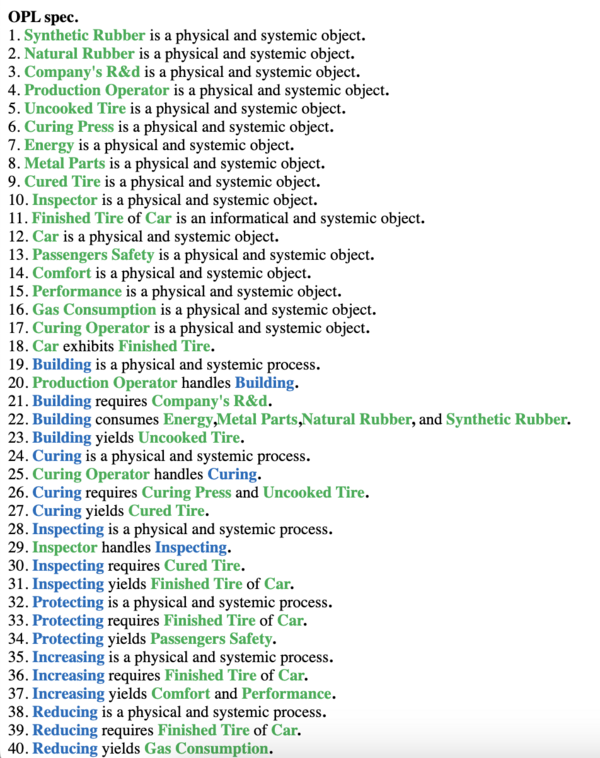
An Object Process Language (OPL) description for 1TIRE can be found below. This translates the OPD into a natural language.
Figures of Merit
Relevant figures of merit can be seen in the table below.
Strategic Drivers
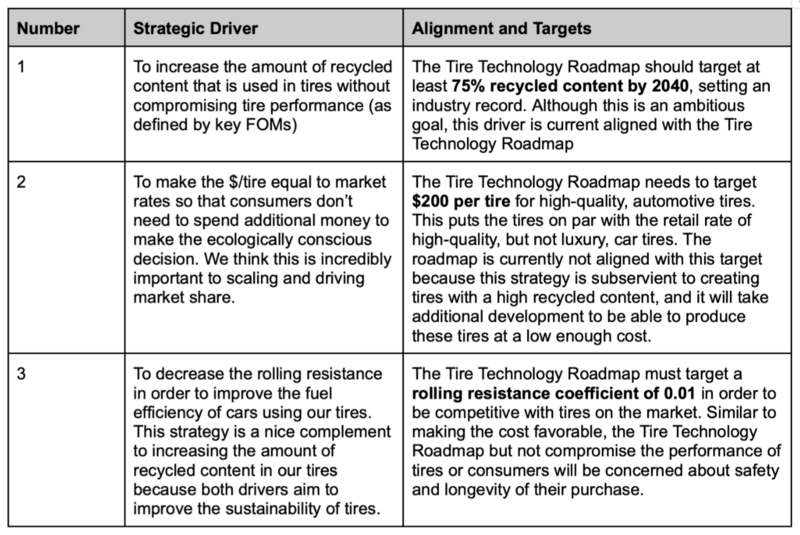
The drivers above capture the most critical strategic elements that the company must pursue in order to innovate in the tire industry. At a high level, the push towards more sustainable practices is what differentiates the company from others on the market. In order to stay competitive, the company must retain competitive pricing -- this will be quite challenging -- as well as a low rolling resistance coefficient and other key FOMs (speed capacity, load capacity, and allowed vehicle range.
Comparison with Competitors and FOMs
The table above shows the values of different FOMs, for different companies and products. Data about rolling resistance was not easily accessible, as it is often kept a secret by companies, so we used as a proxy the mileage warranty. This parameter seems not to be strongly correlated with price (which was our initial assumption), but it might be due to marketing reasons.
However, this provides useful insights for our company trying to enter the car tire market. A few takeaways that we can gather from this are that we should target a maximum price of $250, as we cannot afford to be more premium than the most premium brands in the market. But it shows that the market might benefit from a player with an even higher mileage warranty: this could be our niche.
Technical Model and Morphological Tradespace
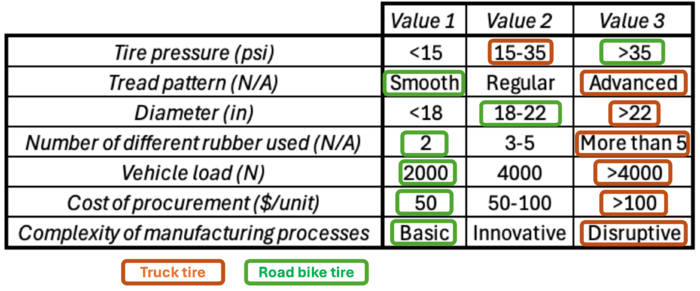
In order to assess the feasibility of technical (and financial) targets at the level of the 1TIRE roadmap it is necessary to develop a technical model. The purpose of such a model is to explore the design tradespace and establish what are the active constraints in the system. The first step can be to establish a morphological matrix that shows the main technology selection alternatives that exist at the first level of decomposition, see the figure below.
It is interesting to note that the architecture and technology selections for a bike tire or a truck tire are quite different. Truck tires use more advanced materials and processes, in order to reduce the rolling resistance of the tires. This comes at the expense of the price. Bike tires however focuses on simpler products to be able to reach a lower price. The rolling resistance is less important for a bike tire, as a rider very rarely rides their bike for more than a few miles.
The technical model centers on how the rolling resistance is impacted by the velocity of the vehicle, and the size of the wheel.
Key Publications and Patents
TBD
Financial Model
TBD
Future Projects and R&D
TBD
Technology Strategy Statement
TBD


