Difference between revisions of "Radio Frequency Counter UAS System"
| Line 50: | Line 50: | ||
[[File:State_2RFC.png|frameless|500px]] | [[File:State_2RFC.png|frameless|500px]] | ||
==Alignment with “Company” Strategic Drivers== | |||
===FOM Targets=== | |||
==Position of Company vs. Competition== | |||
===FOM charts=== | |||
| Line 98: | Line 106: | ||
[[File:Probability of detect tornado.png|frameless|500px]] | [[File:Probability of detect tornado.png|frameless|500px]] | ||
==Key Publications and Patents== | |||
Revision as of 03:49, 5 November 2024
Roadmap Creators:
Time Stamp: 10 October 2024
Radio Frequency Counter UAS System
Roadmap Overview
Counter-Unmanned Aircraft Systems (C-UAS) are technologies developed to detect, track, and neutralize unmanned aerial vehicles (UAVs) in situations where they pose security threats. With the proliferation of drones around the world, C-UAS is essential to the future airspace security landscape. C-UAS are modular and interoperable with numerous platforms. Demonstrated technologies include radar, electro-optical/infrared, acoustic, and radio frequency sensors for drone detection, as well as communication signals jamming, cyber takeover, and directed energy applications (laser and electromagnetic) for drone mitigation. Due to the variety of C-UAS configurations, our roadmap focuses on radar detection and radio frequency (RF) jamming.
DSM Allocation
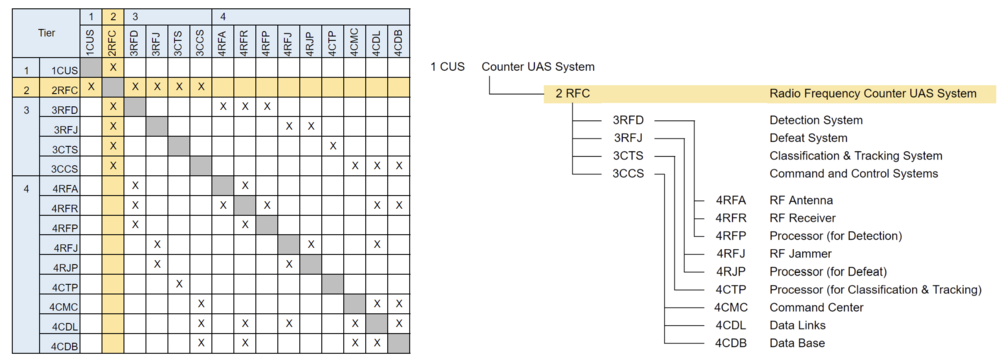
The above 2RFC tree shows the relationship between some systems related to the Counter UAS system that uses radio frequency as for detection and defeat. This tree says that the Counter UAS system consists of the detection system (3RFD), defeat system (3RFJ), classification & tracking system (3CTS), and command and control system (3CCS). In addition, these subsystems require several components such as an RF antenna (4RFA), RF jammer (4RFJ), a processor for classification and tracking (4CTP), command center (4CMC), and so on. As this DSM shows, The DSM indicates that each component is coupled to function as an RF counter UAS system.
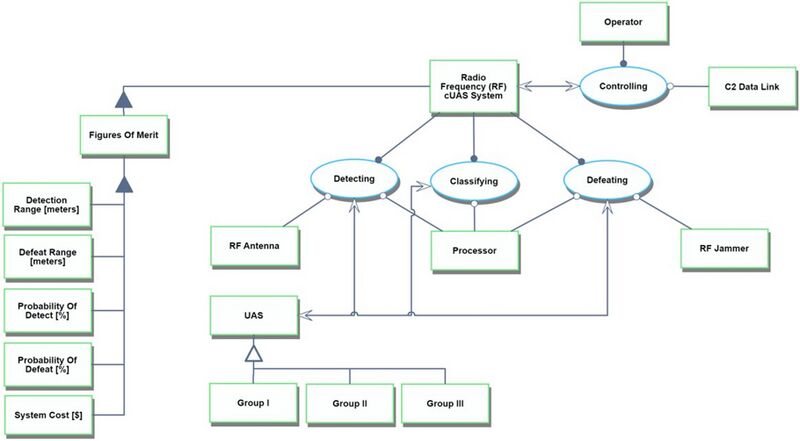
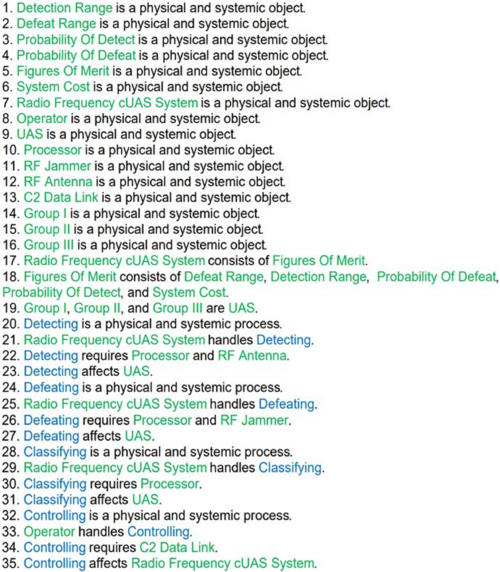
Roadmap Model using OPM
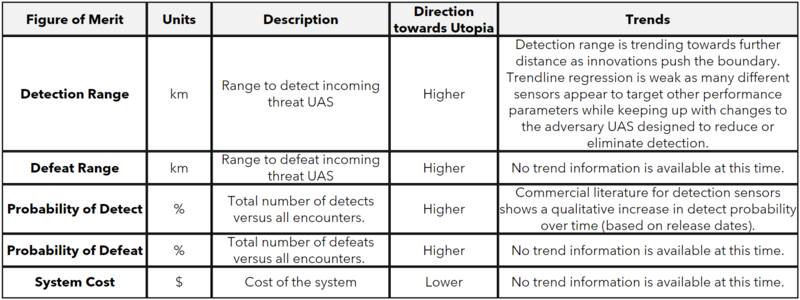
Figures of Merit (FOM)
The table above summarizes a number of different Figures of Merit (FOM) for the C-UAS System. The complete system that detects and defeats will have similar FOMs on either side of the chain, and we've selected to focus on Detect as the key FOM. Detect ranges are one of the more widely publicly available data metrics for such systems. However, each entity may not utilize the same metrics for comparison. This study makes the assumption that detection range metrics from different suppliers are one-to-one.
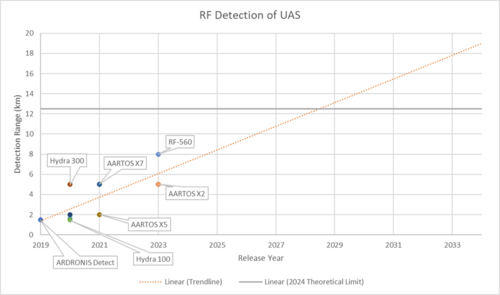
Charting a range of C-UAS RF Systems from worldwide suppliers shows an increasing detection range versus time with a wide data spread.
Alignment with “Company” Strategic Drivers
FOM Targets
Position of Company vs. Competition
FOM charts
Technical Model
Morphological Matrix and Tradespace
Numerous design vectors determine the system, and it is impossible to list them all. Therefore, three representative decision variables are presented here.
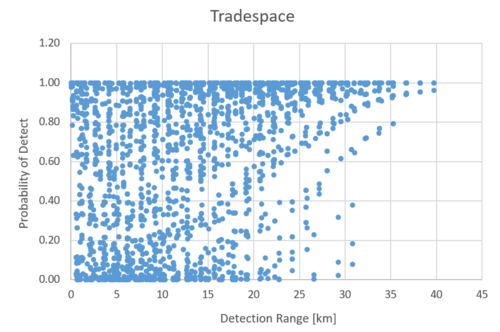
The Tradescope based on the combination of these decision variables is as follows. Typically, a performance versus cost comparison is typical, but considering that cost estimation is currently difficult, a Tradescope was created for the two indicators that will undergo sensitivity analysis later. As explained in the section on sensitivity analysis, the parameters of the UAS being detected are also taken into consideration here.
Many results show detection probabilities close to 1, and most of these are combinations with high antenna gain. However, it should be noted that high-gain antennas have high directivity, which narrows the detection range compared to omnidirectional antennas. Therefore, compensation, such as appropriately integrating multiple antennas to cover the same area, is necessary.
FOM Sensitivity
The FOM of the counter UAS system is shown above. Among them, we formulate the detection range and probability of detect and evaluate their sensitivity.
Detection Range
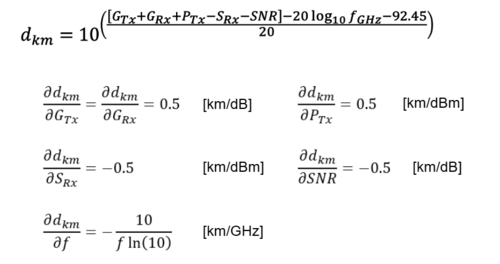
Here, GTx, PTx, and f are values determined by the UAS to be detected, but considering that the system's performance varies depending on the detection target, we will check the impact of these values.
When the partial derivatives of each variable are calculated, the partial derivatives for all variables except f are low values. Therefore, the influence of these variables on the detection distance, which is an important index in evaluating the performance of the system, is easy to interpret.
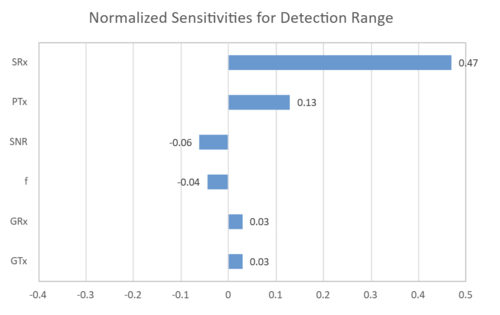
Next, we evaluate the sensitivity of the detection distance d to each variable. Here, the rate of change in the detection distance is shown for a 1% increase in each variable from the reference value.
The results show that improving the receiver's receiver sensitivity is strongly influenced by improving the detection distance. It is necessary to construct a system that can detect UAS even when the reception level is low.
Probability of Detect
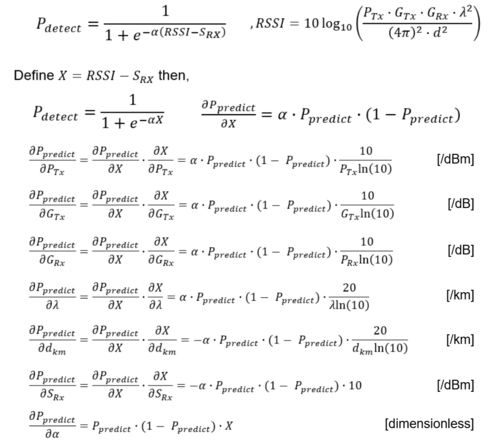
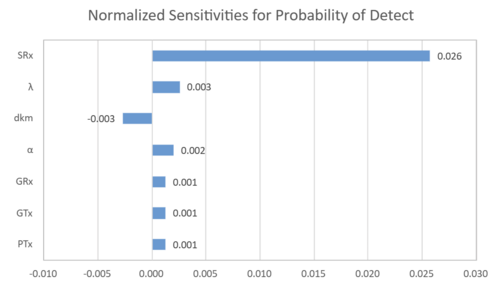
Here, since the detection probability follows a logistics function, the result of the partial differentiation of each variable shows a sigmoidal slope. Thus, a positively large value of the partial derivative implies a higher probability of detection. Next, we evaluate the sensitivity of the probability of detection to each variable. Here, the rate of change in the detection distance is shown for a 1% increase in each variable from the reference value.
The results show that improving the receiver's receiver sensitivity is strongly influenced by improving the probability of detection. Despite the different indicators and different derivation assumptions in the equations, the most contributing variables are consistent with the results for detection distance, and the results for each are considered plausible.
