Difference between revisions of "Ebikes"
| Line 102: | Line 102: | ||
We aim to occupy a unique position by delivering high customer value through innovative features and affordability while keeping production costs manageable. This strategy aims to attract a broad user base seeking cost-effective and efficient urban transportation solutions. | We aim to occupy a unique position by delivering high customer value through innovative features and affordability while keeping production costs manageable. This strategy aims to attract a broad user base seeking cost-effective and efficient urban transportation solutions. | ||
[[File:Customer value vs producer cost.png| | [[File:Customer value vs producer cost.png|700px|center]] | ||
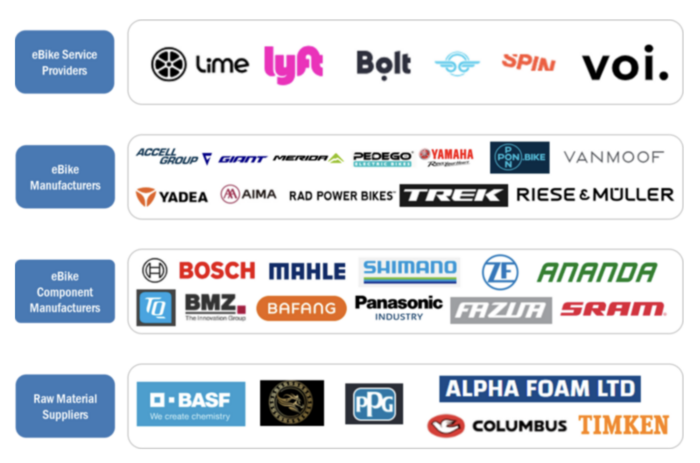
[[File:E-bike landscape.png| | [[File:E-bike landscape.png|700px|center]] | ||
==Technical Model: Morphological Matrix and Tradespace== | ==Technical Model: Morphological Matrix and Tradespace== | ||
Revision as of 14:37, 25 November 2024
The e-Bike (2EBK) roadmap is a level 2 roadmap with a focus on specific micromobility solutions (e.g., shared electric scooters, e-bikes). The Micromobility System (1MMS) market, a level 1 roadmap, represents a segment of the broader urban mobility market. Level 3 roadmaps target the subsystems within these solutions (e.g., powertrain, connectivity, structural), and level 4 roadmaps delve into individual components (e.g., battery cells, sensors, motors).
Technology Roadmap Overview
Micromobility refers to a range of small, lightweight vehicles operating at speeds typically below 25 km/h (15 mph) and driven by users personally. These include bicycles, e-bikes, electric scooters, electric skateboards, shared bicycles, and electric pedal-assisted bicycles. Micromobility represents a significant shift in urban transportation, offering flexible, sustainable solutions for short-distance travel that are ideal for city settings. Originating in the 19th century, micromobility has advanced into electric folding bikes and motorized vehicles. Today, micromobility solutions focus on shared, electric, and connected vehicles integrated into an urban network. Micromobility is interfacing with user data and contextual information more efficiently and seamlessly and is gaining traction in autonomous personal mobility. It is also venturing into other modes other than land mobility, such as air and water transportation. Micromobiliity is poised to play an increasingly important role in the future of urban mobility and smart cities. It is core to city planning, from historic city centers to today’s most transformative giga-projects.
Roadmap Model using OPM
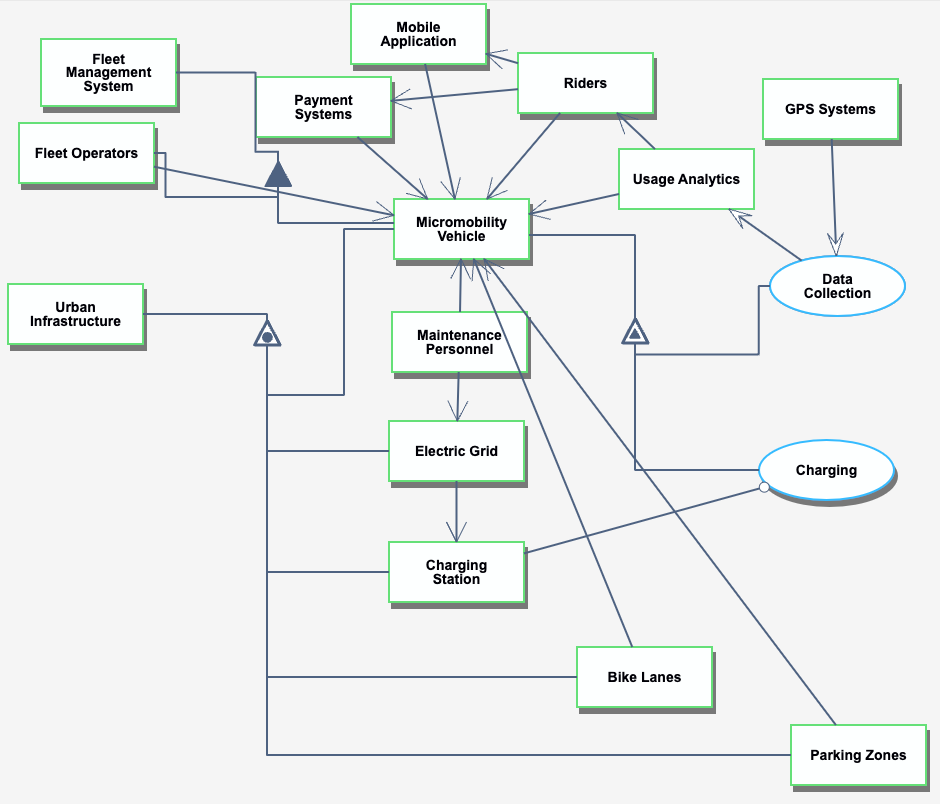
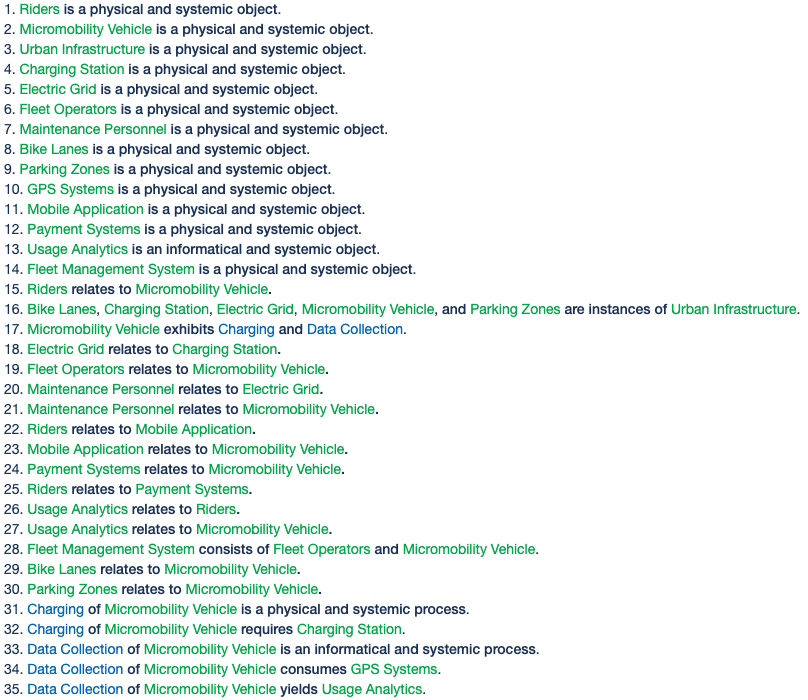
Below, we provide an object-process diagram (OPD) of the 1MMS roadmap. This diagram captures the main object of the roadmap, its decomposition into subsystems (powertrain, connectivity, structural...), its characterization by Figures of Merit (FOMs), as well as the main processes and actors involved.
Figures of Merit
This table outlines the key metrics for evaluating the performance and effectiveness of micromobility systems.
| Figure of Merit (FOM) | Unit | Description |
|---|---|---|
| Energy Efficiency | Wh/km | Measure the energy consumption per kilometer traveled by the micromobility vehicle. |
| Utilization Rate | rides/vehicle/day | Indicates how frequently a vehicle is used on average in a shared system. |
| Trip Duration | Minutes | Represents the average time taken for a typical trip by users. |
| Trip Distance | Kilometers | Measures the average distance covered during a single trip. |
| Battery Life | Hours or Kilometers traveled | Evaluates the battery’s operational time/distance before needing a recharge. |
| Per-Unit Operational Cost | $/ride | Calculates the cost associated with maintaining and operating the vehicle for each ride. |
| Downtime | Hours | Represents the amount of time a vehicle is unavailable for use, typically due to maintenance or charging. |
| Safety Incidents | incidents/1,000 rides | Tracks the frequency of safety-related issues or accidents to assess the system’s safety. |
| App/platform user engagements | sessions/user/day | Measures the average number of interactions a user has with the app per day. |
Alignment with Company Strategic Drivers: FOM targets
Overview
The table below provides the high-level strategic drivers and alignment for the 1MMS and 2EBK technology roadmap. There are additional detailed drivers that provide more context for the FOM targets with a multi-horizon lens.
| Number | Strategic Driver | Alignment |
|---|---|---|
| 1 | Urban Mobility and Smart City Integration: Increasing congestion and the need for flexible last-mile solutions highlight e-bikes as a compact, efficient option. | E-bikes allow users to bypass traffic, reduce parking needs, and improve the flow of urban transport, meeting the demand for quick, point-to-point solutions in crowded city centers. This creates a data-driven mobility solution that supports safer, sustainable urban living. |
| 2 | Advancements in Technology and Manufacturing: Support the battery, motor systems, and electronic controls for more optimal and efficient electric transportation systems | Advances in battery technology, motor efficiency, and lightweight materials enable extended range, improved speed, and reduced recharging times, making e-bikes a more attractive, competitive choice for daily commutes and recreational use. |
| 3 | Environmental Sustainability Impact: As cities strive to meet emissions targets and reduce pollution, e-bikes present an environmentally friendly alternative to short car trips. | Sustainable urban transit with electric-powered bicycles that significantly lower CO₂ emissions. |
By focusing on these strategic drivers and capability milestones, the e-bike industry can continue to innovate and expand its market presence over the next decade, addressing key challenges in urban mobility, sustainability, and technological integration.
Strategic Driver FOM Targets by Time Horizon
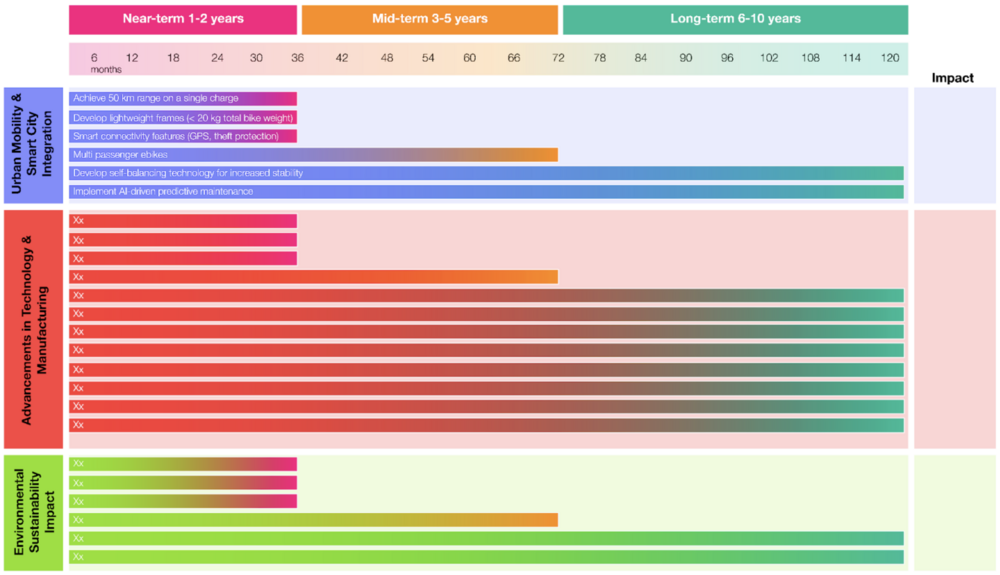
The following is a detailed list of FOM targets by time horizon relative to the broader technology roadmap that connects to the strategic drivers. The planned roadmap would take a phased horizon approach with separate swimlanes for various technical, system integration, and connectivity drivers.
| Time Horizon | FOM Targets |
|---|---|
| Near-term |
|
| Mid-term |
|
| Long-term |
|
The figure below is a representation of the roadmap that is currently being built:
Positioning of Company vs. Competition: FOM charts
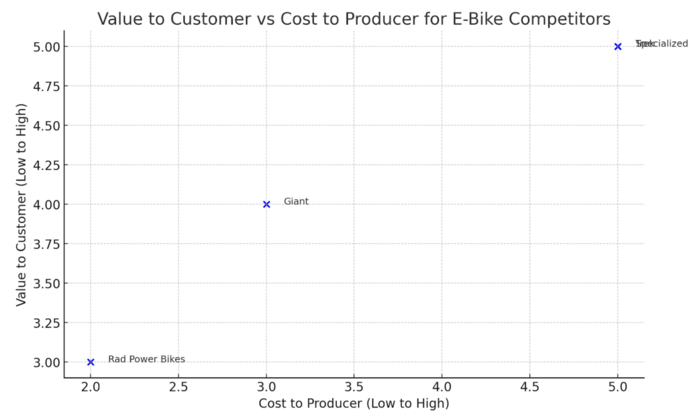
To effectively position our e-bike offering within the micromobility market, analyzing the value provided to customers against the cost incurred by producers is essential. Below is a conceptual representation of this relationship, highlighting our position relative to key competitors:
| Brand | “Company” | Rad Power | Trek | Specialized | Giant |
|---|---|---|---|---|---|
| Best Seller | “Model X” | RadRover 6 | Allant+ 9.9S | Turbo Vado 5.0 | FastRoad E+ EX Pro |
| Bike Weight (kg) | Targets TBD | 32.2 | 23.4 | 25.4 | 18.6 |
| Charge Time (hrs) | Targets TBD | 6 | 4.5 | 4 | 5 |
| Range (km) | Targets TBD | 72-88 | 120-180 | 145 | 120-180 |
| Battery Capacity (Wh) | Targets TBD | 672 | 625 | 710 | 500 |
| Price Range | Targets TBD | $1,000-2,000 | $2,500-12,000 | $3,000-$14,000 | $2,000-10,000 |
| Value to Customer | Targets TBD | Medium | High | High | Medium |
| Cost to Producer | Targets TBD | Low | High | High | Medium |
We aim to occupy a unique position by delivering high customer value through innovative features and affordability while keeping production costs manageable. This strategy aims to attract a broad user base seeking cost-effective and efficient urban transportation solutions.
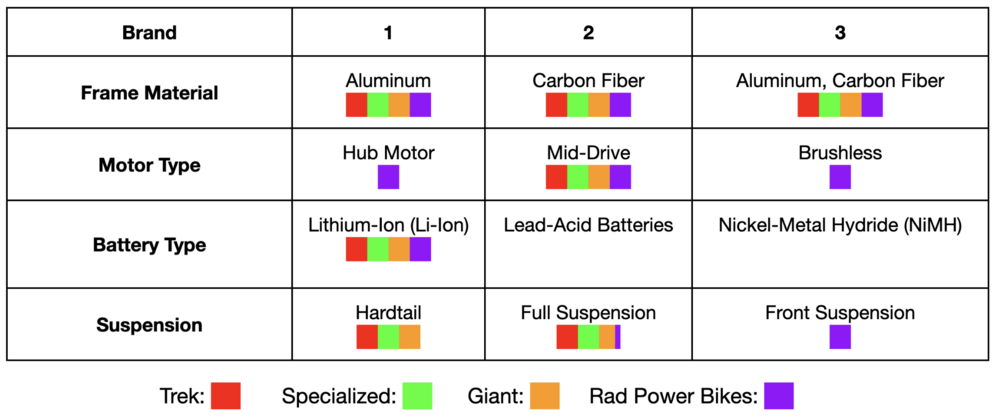
Technical Model: Morphological Matrix and Tradespace
Below is a morphological matrix for leading e-bike manufacturers: Trek, Specialized, Giant, and Rad Power Bikes. This matrix outlines the different design choices each company makes across various components. A myriad of different component decisions must be considered when designing an e-bike. We chose the top four of the most important decision areas in the matrix below. For each, we listed three possible solution types under each component.
Keys Publications and Patents
The search for relevant patents was initially conducted using keywords such as “ebike” and “electronic bicycle” using the US Patent and Trademark Office Patent Public Search tool, as well as Google Scholar and Google Patent. This revealed hundreds of records, many of which were related to the growth of technology and, more so on the growth of the space in recent years. To better focus on more relevant technologies, the search focused on more recent updates in the technology, especially targeting component updates, such as electronic integrations, connectivity, and battery. This revealed a smaller subset of patents with more direct ties to recent designs.
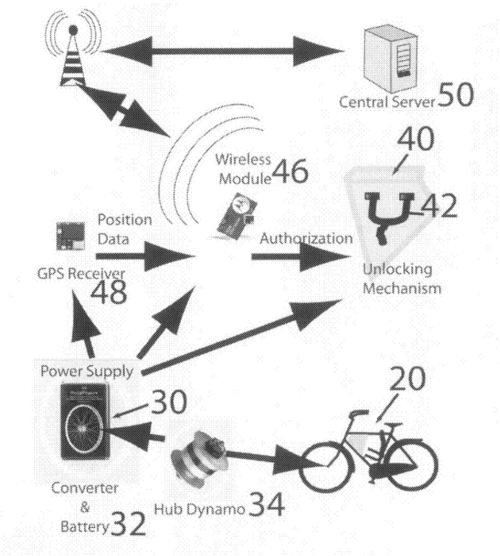
Bike Sharing Patent - Insights into the Full Urban Integration
This patent explored the current innovation in the shared transportation and ridesharing space, that is not reliant on e-dock/hub. Instead this introduced a bike share system with the flexibility to anchor the rental bike anywhere at the end of the trip, employing a remotely operable lockbox which incorporates a wireless communication card with a GPS receiver.
Additionally, some key market data came from Stastisa and Markets and Markets. These provided an overall view of the space and provided market sizing. The initial market size valuation for 2024 is valued at $48.7B and is expected to reach $71.5B by 2030, growing at a CAGR of 6.6%. This indicates that the global demand for e-bikes has increased rapidly, especially during COVID-19, as users saw them as a low-cost, eco-friendly solution for commuting. Government bodies worldwide have also supported initiatives for bicycle infrastructure, such as integrated lanes in urban environments.
For publications, it was valuable to dive deep into the core of micromobility and the drivers behind more short-term transport. For example, the trip distance metrics and feasibility analysis of computed distributions of trip distances for bike, taxi, and FHV car-sharing datasets should be reviewed. It was valuable to understand some key needs and areas of competition necessary for future improvements in the roadmap.
Financial Model
TBD
Future Projects and R&Ds
TBD
Technology Strategy Statement
TBD
