Difference between revisions of "Mixed Reality (Augmented & Virtual)"
| Line 116: | Line 116: | ||
By breaking the Mixed Reality products down into these characteristics, we are able to provide a solid basis for the technology roadmap and better understand potential use cases, performance benchmarking, and targets for future improvement. | By breaking the Mixed Reality products down into these characteristics, we are able to provide a solid basis for the technology roadmap and better understand potential use cases, performance benchmarking, and targets for future improvement. | ||
Now, we know that users will ultimately need to perceive images on the display smaller than the equivalent of 8-point font (reference case). As such, we can simulate the changes required to the HoloLens baseline characteristics to read words in 6-point font (equivalent to 55 pixels/degree for the purposes of this analysis). 55 pixels/degree is currently available on the market, so it is a realistic simulation to understand what Microsoft can do technically to achieve this performance improvement. | |||
In short, the following technical changes will result in a higher Angular Resolution (pixel density). This is based on the aforementioned governing equations for retinal displays. Note: the dep parameter (distance from the display to the outer eye surface) is a fixed parameter based on the anatomy of the human eye; for this analysis dep will always equal 3.05 mm. | |||
- Decrease width | |||
- Decrease height | |||
- Increase relief distance | |||
- Increase resolution | |||
Specifically, the following governing equations are used to conduct the analysis. | |||
[[File:Picture3.png|300px]] | [[File:Picture3.png|300px]] | ||
Revision as of 22:18, 4 November 2019
Roadmap Overview
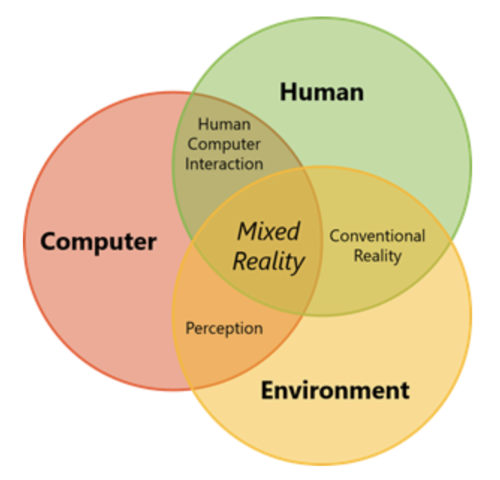
Augmented, virtual, and mixed realities reside on a continuum and blur the line between the actual world and the artificial world - both of which are currently perceived through human senses.
Figure 1 - Reality-Virtuality Continuum
Augmented reality devices enable digital elements to be added to a live representation of the real world. This could be as simple as adding virtual images onto the camera screen of a smartphone (as recently popularized by mobile applications Pokemon Go, Snapchat, et al). Virtual reality, which lies at the other end of the spectrum, seeks to create a completely virtual and immersive environment for the user. Whereas augmented reality incorporates digital elements onto a live model of the real world, virtual reality seeks to exclude the real world altogether and transport the user to a new realm through complete telepresence.
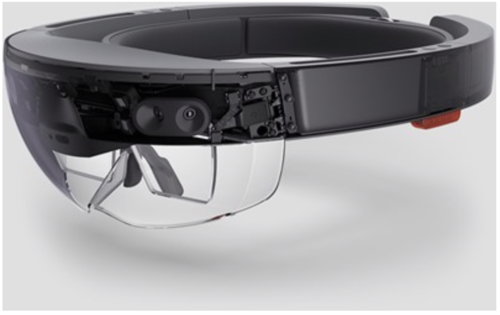
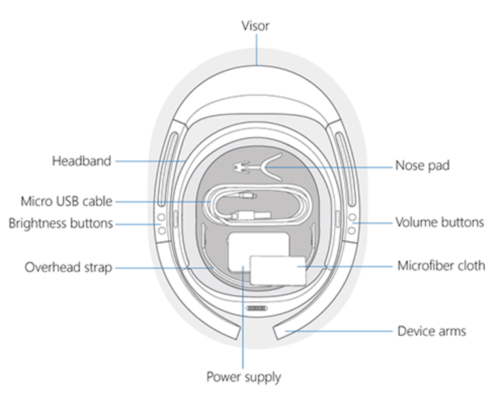
Mixed reality, on the other hand, incorporates both of these ideas to create a hybrid experience where the user can interact with both the real and virtual world. Mixed reality devices can take many forms. For the purposes of this technology roadmap we've elected to narrow our focus to wearable headgear (heads up) devices. These devices are typically fashioned with visual displays and tracking technology that allow six degrees of freedom (forward/backward, up/down, left/right, pitch, yaw, roll) and immersive experiences. The elements of form for an example mixed reality product, the Microsoft HoloLens (1st generation), are depicted in the figures below.
Figure 2 - Mixed Reality Example (Microsoft Hololens)
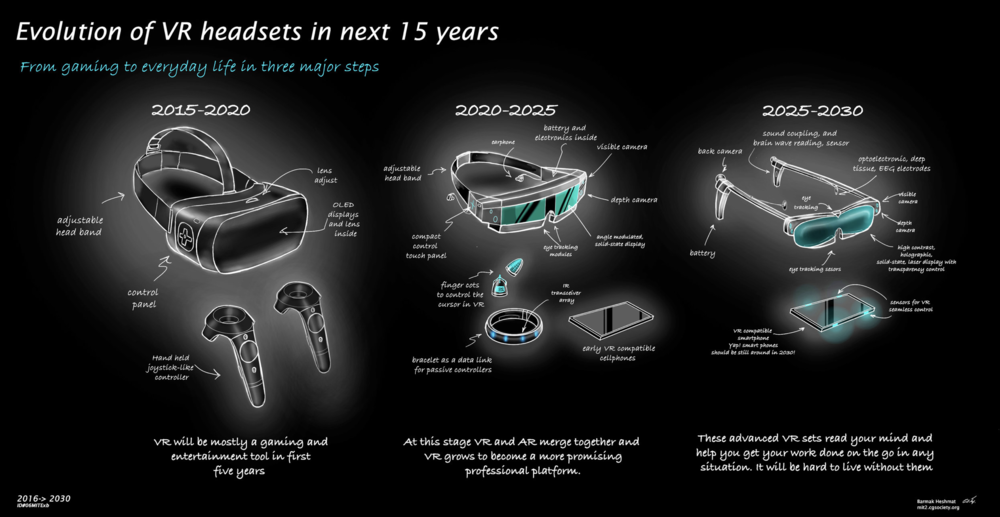
In terms of functional taxonomy, this technology is primarily intended to exchange information. The design of these devices today allow for information to be exchanged through two of the five human perceptual systems: (1) visual system & (2) auditory system. The combination of hardware, software, and informational/environmental inputs allow mixed reality users to interact and anchor virtual objects to the real world environment. One vision for the future is depicted below (courtesy of Barmak Heshmat, MIT Media Lab).
Figure 3 - Sample Mixed Reality Roadmap
Design Structure Matrix (DSM) Allocation
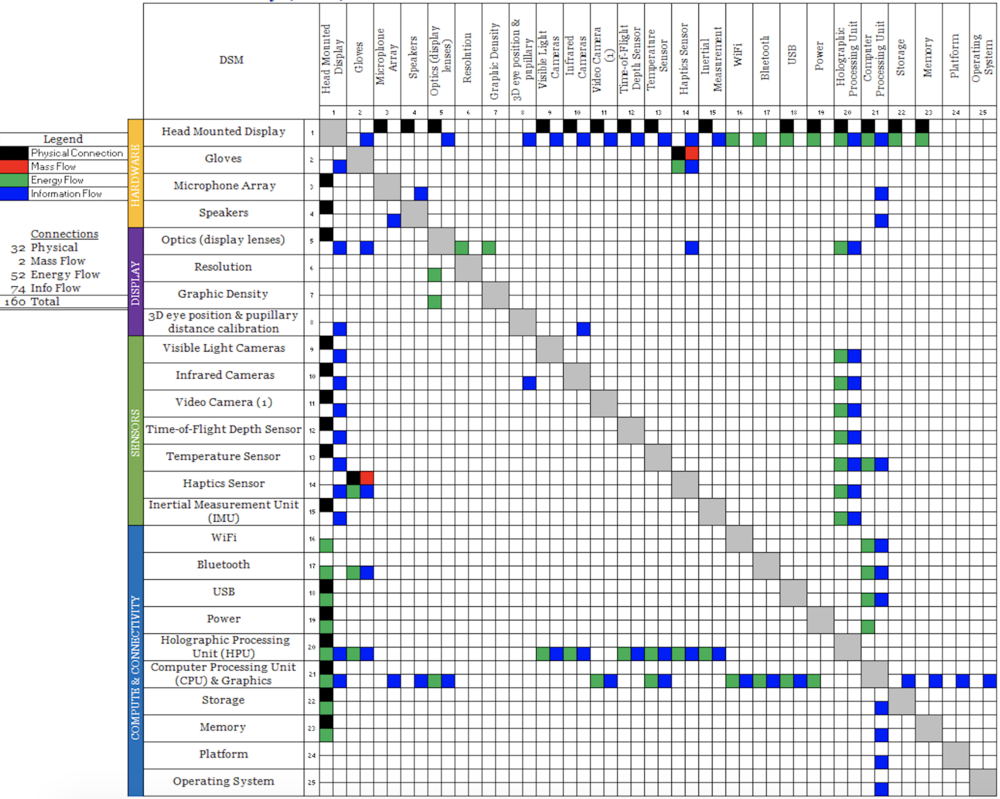
Figure 4 - Mixed Reality DSM
The DSM above shows us that mixed reality technology requires the following key enabling technologies at the subsystem level: Holographic Processing Units (HPU), Computer Processing Units (CPU) / advanced computing capabilities, sensors (e.g. this includes various optic sensors, haptic sensors, etc), and connectivity (e.g. WiFi, Bluetooth, etc).
Roadmap Model using Object-Process-Methodology (OPM)
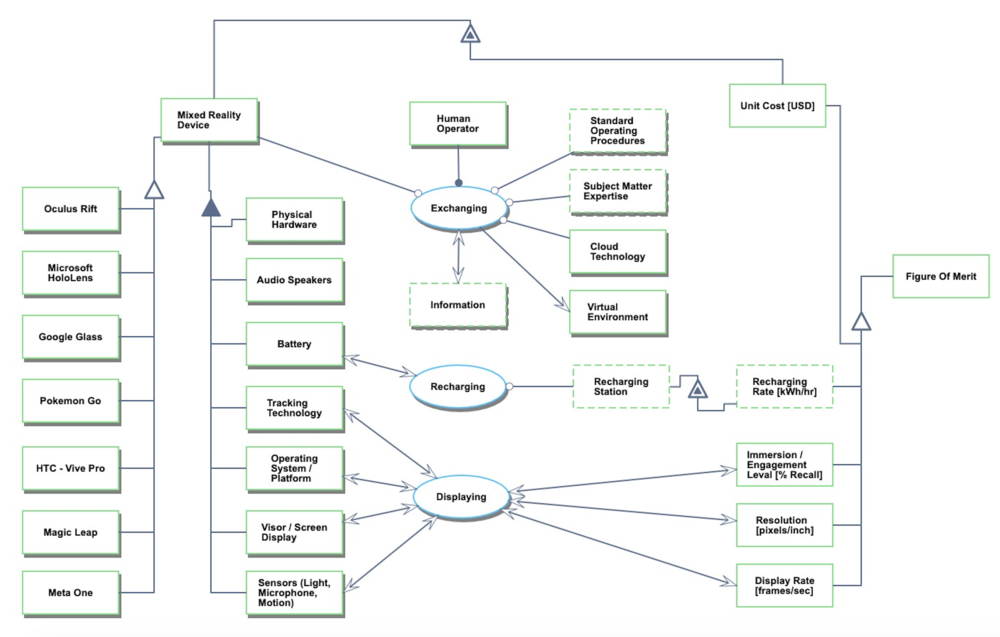
We provide an Object-Process-Diagram (OPD) of the augmented, virtual, and mixed reality roadmap in Figure 3 below. This diagram captures the main object of the roadmap, mixed reality device, its various instances including main competitors, its decomposition into subsystems (hardware, battery, operating system, etc), its characterization by Figures of Merit (FOMs) as well as the main processes (Exchanging, Recharging, and Displaying).
Figure 5 - Mixed Reality OPD
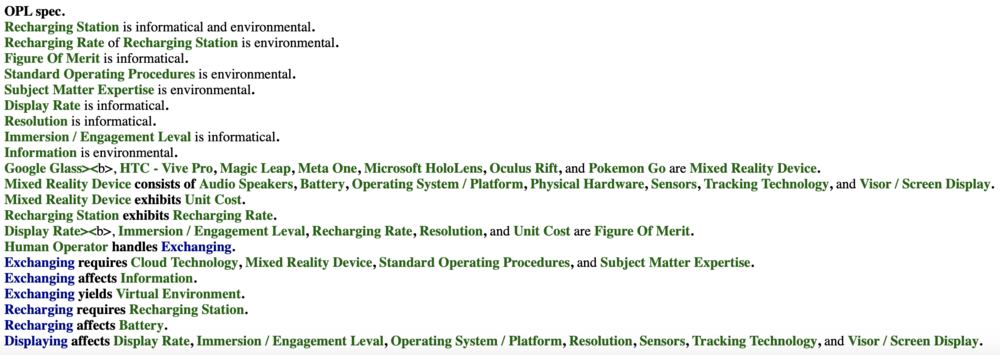
An Object-Process-Language (OPL) description of the roadmap scope is auto-generated and given below. It reflects the same content as the previous figure, but in a formal natural language.
Figure 6 - Mixed Reality OPL
Figures of Merit (FOM) Definition
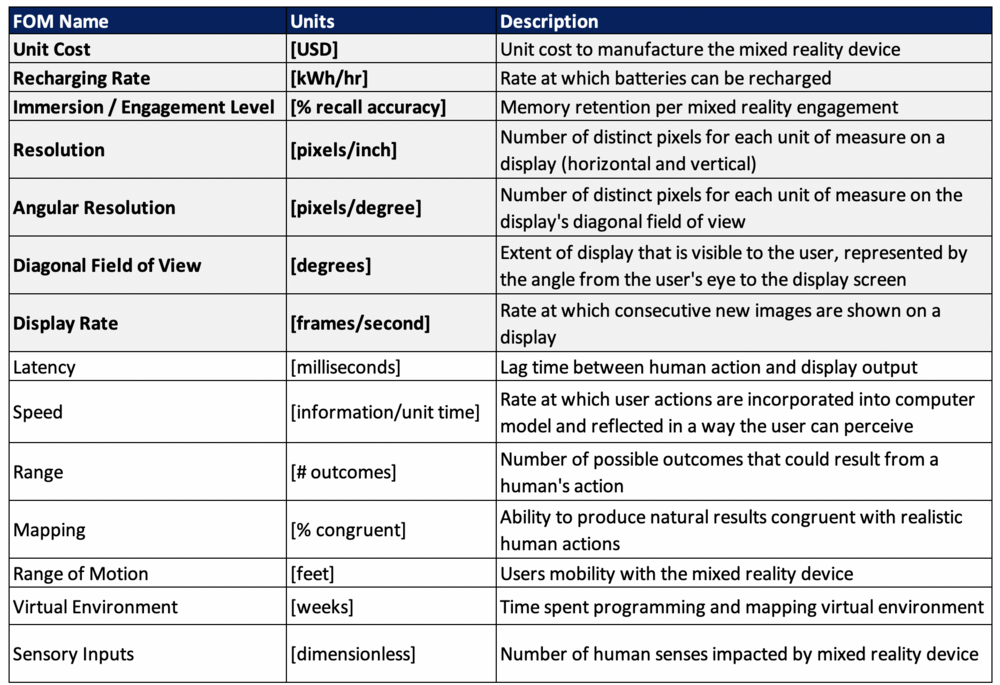
The table below shows a list of FOMs by which mixed reality devices can be assessed. The first four (shown in bold) were included on the OPD; the others will follow as this technology roadmap is developed. Several of these are similar to the FOMs that are used to compare traditional motion pictures, modern gaming consoles, and other technologies that aim to exchange information.
It's worth noting that several of the FOMs are requisites to the mixed reality Immersion / Engagement Level, one of the primary FOMs. In this way, these can be thought of as a FOM chain. Latency and Mapping, for example, contribute greatly to the overall memory retention per use of the mixed reality device. This is true for many of the FOMs listed below.
Figure 7 - Mixed Reality Figures of Merit
Besides defining what the FOMs are, this section of the roadmap also contains the FOM trends over time dFOM/dt as well as some of the key governing equations that underpin the technology. These governing equations can be derived from physics (or chemistry, biology, etc) or they can be empirically derived from a multivariate regression model. The specific governing equations for mixed reality technology will be updated as the roadmap progresses.
Display Rate Trajectory
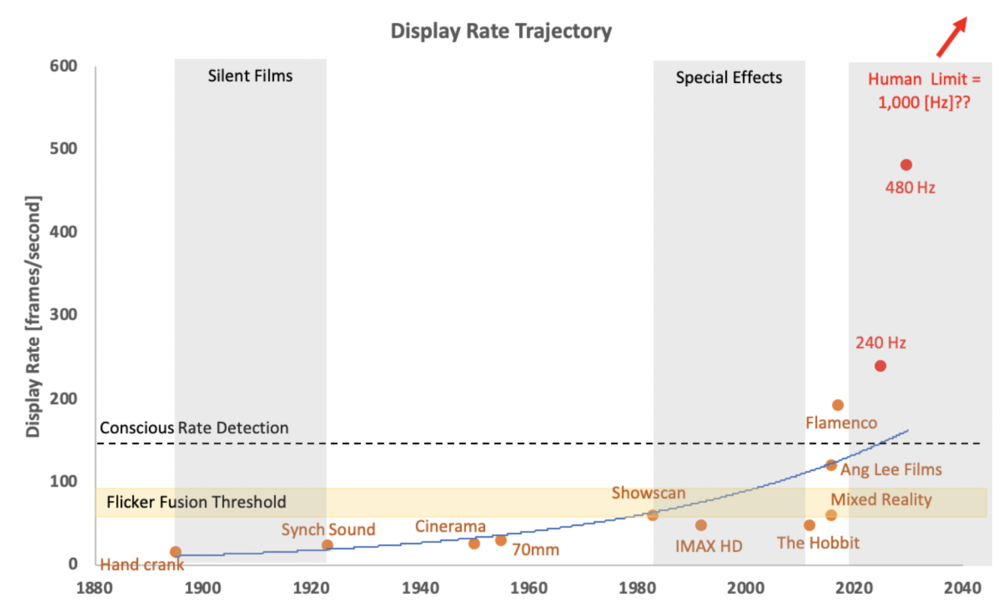
The human visual system can typically perceive images individually at a rate up to 10-12 images per second; anything beyond that is perceived as motion to the human eye. This is the starting point for humans to perceive motion pictures, and it began in earnest in 1891 with the invention of the kinetoscope, the predecessor to the modern picture projector. Although the primary comparison for this FOM resides in the film industry, it is not the only use. The gaming industry, theme parks, and now mixed reality technology all have a stake in optimizing this FOM for performance.
To create a convincing virtual experience, experts claim that 20-30 frames per second is required. That said, there is a long way to go for display rates to truly make the digital world indistinguishable from the real world. There will come a point when the display frame rate for mixed reality devices reaches the temporal and visual limit for human beings. In this case, humans will be unable to distinguish between the virtual environment and the real world. Some editorials refer to this as the “Holodeck Turing Test.”
The rate of improvement for this Figure of Merit is shown in the chart below. Given the trajectory, the technology appears to be in the “Takeoff” stage of maturity (as it relates to the S-Curve). This is further supported by the gulf between the current Figure of Merit value (~120-192 frames/second) and the theoretical limit as we understand it today (~1,000 frames per second). It is reasonable to expect “Rapid Progress” in the near future because the interdependent technologies that have historically limited growth (projection equipment, resolution technology, 3D motion pictures, etc.) are undergoing their own technology takeoff.
Figure 8 - Display Rate Trajectory
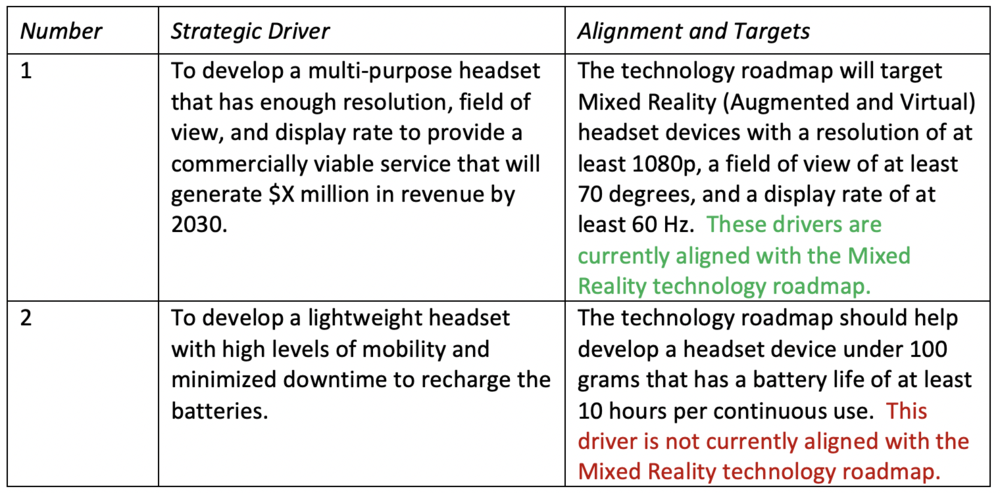
Alignment with Company Strategic Drivers
Figure 9 - Mixed Reality Strategic Drivers & Alignment
Positioning: Company versus Competition FOM Charts
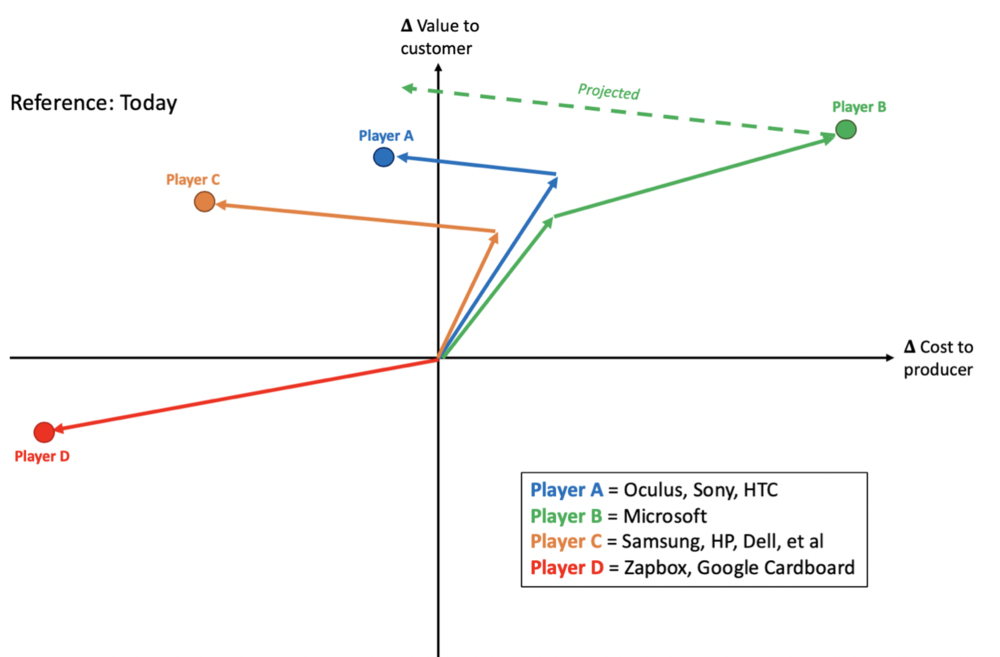
A summary of the overall AR, VR, and MR competitive positioning is depicted below in the Vector Chart. Player A represents the early VR players who got control of the market early and have not had to make salient strategic moves given the lack of competition in the early days of the marketplace. Player B is meant to represent Microsoft specifically and align with their recent strategies. Player C comprise the Low Cost Providers who have recently cropped up in an attempt to claim market share. Player C (like Player A) began as a fast follower but quickly shifted to focus on a low cost option. Finally, Player D presents the extremity of a Low Cost Provider. These companies truly sacrificed FOMs for the sake of low cost. Although their hardware is made largely from cardboard and their products lack the overall utility of other players, they have been able to provide the semblance of a virtual experience for as low as $30/unit.
Figure 10 - Mixed Reality (Augmented & Virtual) Vector Chart
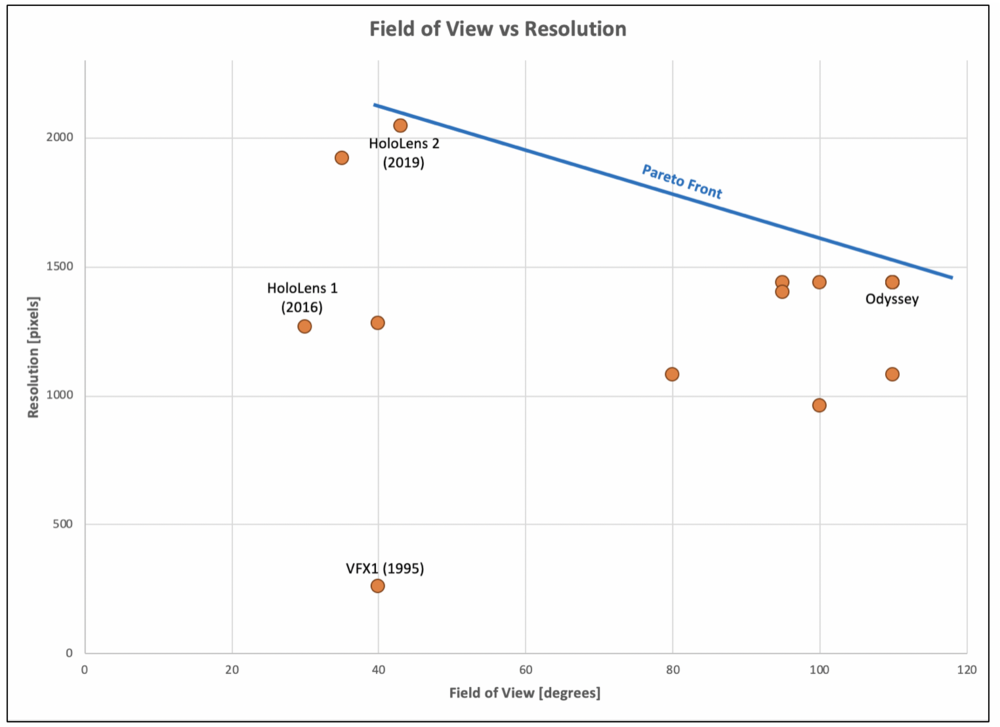
The key FOM trade space for AR, VR, and MR revolves around display resolution and field of view (FOV). The associated FOM chart is shown below in Figure 11. The governing principle behind this is simple. As the FOV is stretched by the width and height of the display, the density of pixels are reduced. In this example, the reference case for resolution (pixel density) is said to be the ability to read 8-point font on a website. The HoloLens 2 capabilities currently align with this reference case.
Figure 11 - Field of View vs Resolution FOM Chart
As Figure 11 illustrates, Microsoft are currently pushing the Pareto Front boundaries in terms of resolution and FOV. The 1995 VFX1 product is also included in this FOM chart to illustrate where the Pareto Frontier existed 25 years ago. The leap from HoloLens Gen 1 to HoloLens Gen 2 is quite impressive and clearly separates HoloLens as the top provider of display resolution.
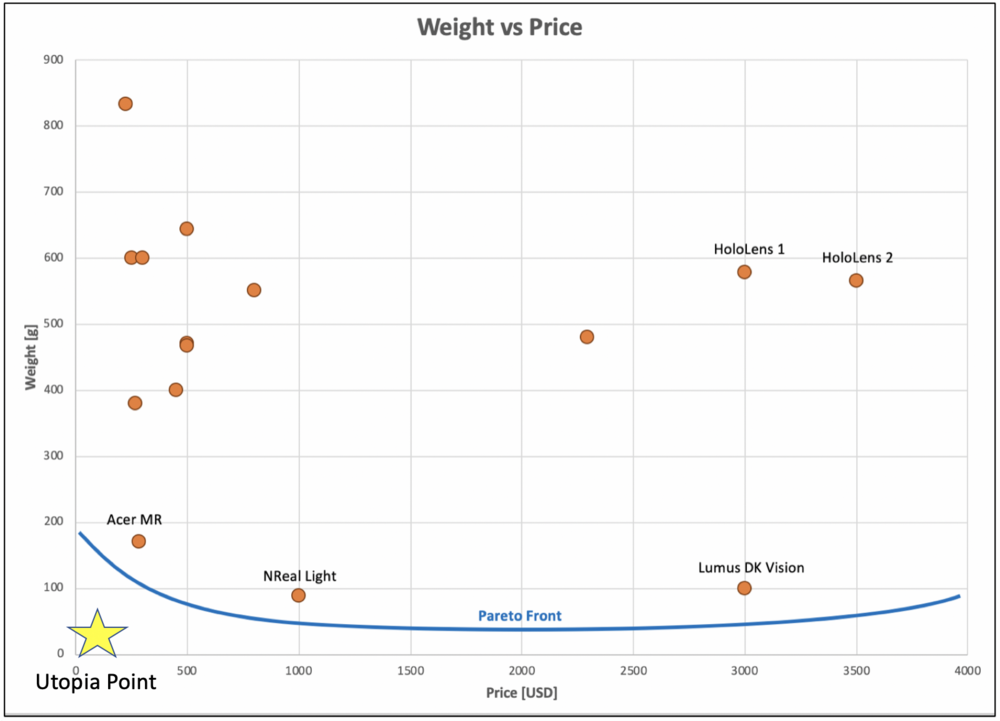
This particular trade space is critical because at higher resolution and pixel density devices also incur a draw on power and processing capability. Subsequently, a heavier unit may be required to accommodate these FOM tradeoffs, which may be detrimental to the overall user experience and customer satisfaction. The FOM chart for weight and price is shown below in Figure 12. In this case, Microsoft has immense incentive to develop technology breakthroughs that enable the HoloLens to retain its superior display FOMs while doing so in a more light-weight and compact package. Several of Microsoft’s competitors have already attacked this aspect of the user experience and seek to provide a light weight, low cost product.
Figure 12 - Weight vs Price FOM Chart
Technical Model: Morphological Matrix and Tradespace
To begin the technology analysis of AR, VR, and MR devices; we first define the key system aspects.
Mixed Reality (Augmented & Virtual) Analysis:
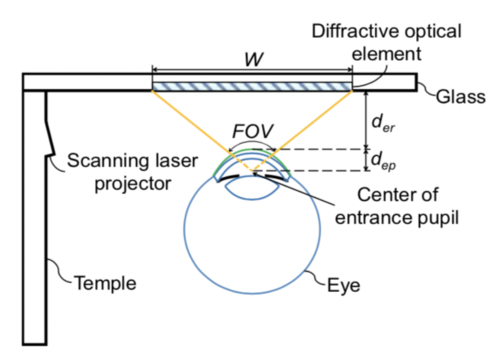
- Fixed Parameter: Anatomy of the eye (distance from pupil to the tear, dep)
- Design variables: Display width (W), display height (H), relief distance (der), resolution (Nh, Nv)
- FOMs: Field of view (FOV), angular resolution (AR)
An illustration of the human eye is shown below in Figure 13 to help clarify these parameters, variables, and FOMs.
Figure 13 - Illustration of the Eye
By breaking the Mixed Reality products down into these characteristics, we are able to provide a solid basis for the technology roadmap and better understand potential use cases, performance benchmarking, and targets for future improvement.
Now, we know that users will ultimately need to perceive images on the display smaller than the equivalent of 8-point font (reference case). As such, we can simulate the changes required to the HoloLens baseline characteristics to read words in 6-point font (equivalent to 55 pixels/degree for the purposes of this analysis). 55 pixels/degree is currently available on the market, so it is a realistic simulation to understand what Microsoft can do technically to achieve this performance improvement.
In short, the following technical changes will result in a higher Angular Resolution (pixel density). This is based on the aforementioned governing equations for retinal displays. Note: the dep parameter (distance from the display to the outer eye surface) is a fixed parameter based on the anatomy of the human eye; for this analysis dep will always equal 3.05 mm.
- Decrease width - Decrease height - Increase relief distance - Increase resolution
Specifically, the following governing equations are used to conduct the analysis.
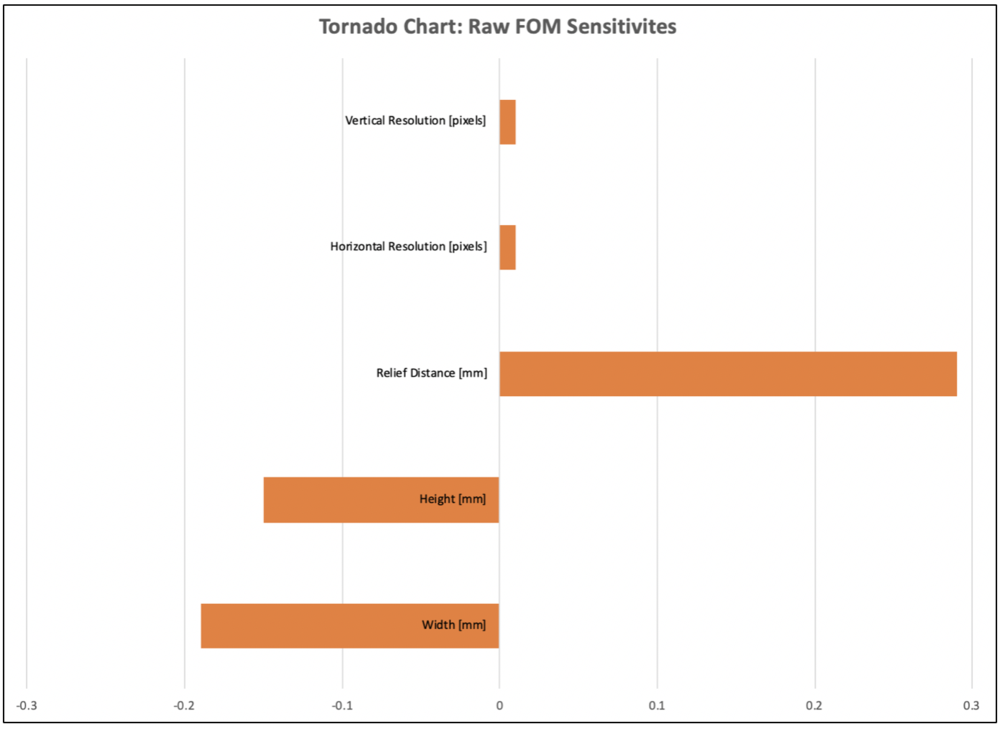
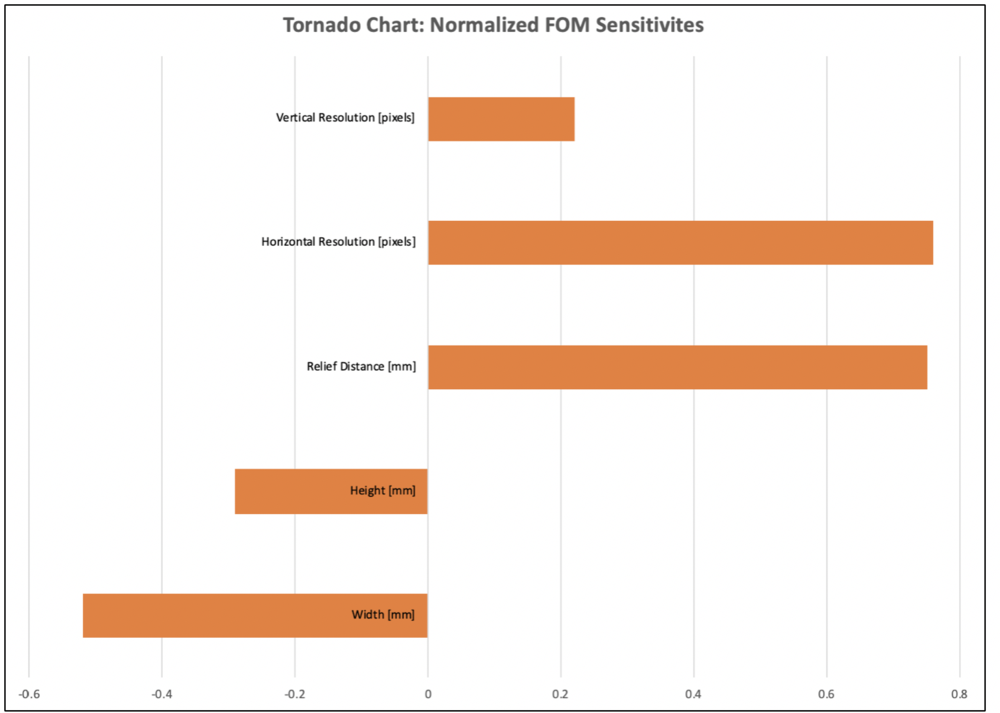
The next step of the technology analysis tests the sensitivities of our FOMs to changes in the design variables. This was done in two stages. First, the raw sensitivities were obtained. This illustrates how the AR FOM changes with an increase or decrease of one unit of the selected design variable. Next, the sensitivities were normalized so we are able to compare FOM impacts at a constant relative step size. The associated tornado charts are found below in Figures 14 and 15.
Figure 14 - FOM Sensitivities (Raw)
Figure 15 - FOM Sensitivities (Normalized)
Financial Model : Technology Value (𝛥NPV)
List of R&T/R&D Projects and Prototypes
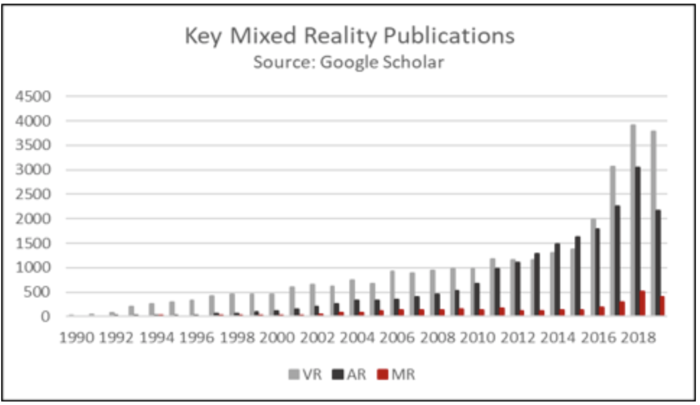
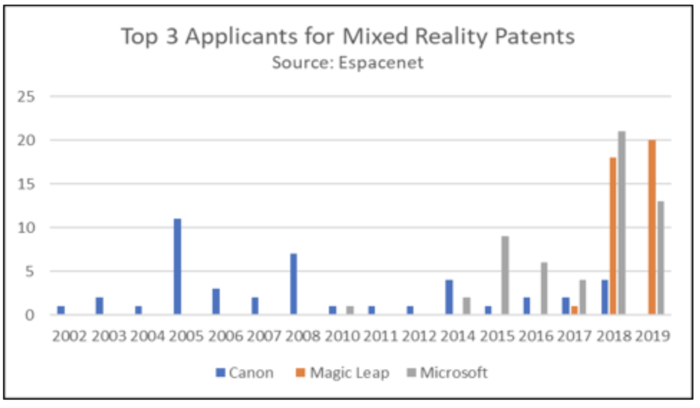
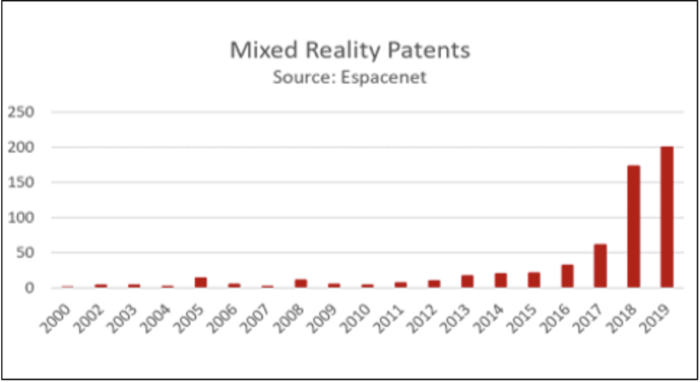
Keys Publications, Presentations and Patents
Figure XXX - YYY
Figure XXX - YYY
Figure XXX - YYY

