Difference between revisions of "Recommendation Systems"
| Line 33: | Line 33: | ||
* Training percent: by altering what percentage of response were used for training data and what percent for evaluating the model we could significantly impact the hit rate, interestingly moving the ratio away from 80\% in both directions resulted in a higher hit rate, implying we had found a particularly bad split for our baseline. | * Training percent: by altering what percentage of response were used for training data and what percent for evaluating the model we could significantly impact the hit rate, interestingly moving the ratio away from 80\% in both directions resulted in a higher hit rate, implying we had found a particularly bad split for our baseline. | ||
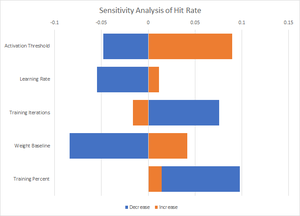
[[File:Tornado HR.png|thumb|Hit Rate Tornado Chart]] | [[File:Tornado HR.png|thumb|left|Hit Rate Tornado Chart]] | ||
The model itself can be found at https://github.mit.edu/ebatman/Recommender-System | The model itself can be found at https://github.mit.edu/ebatman/Recommender-System | ||
Revision as of 22:03, 30 October 2020
Roadmap Overview
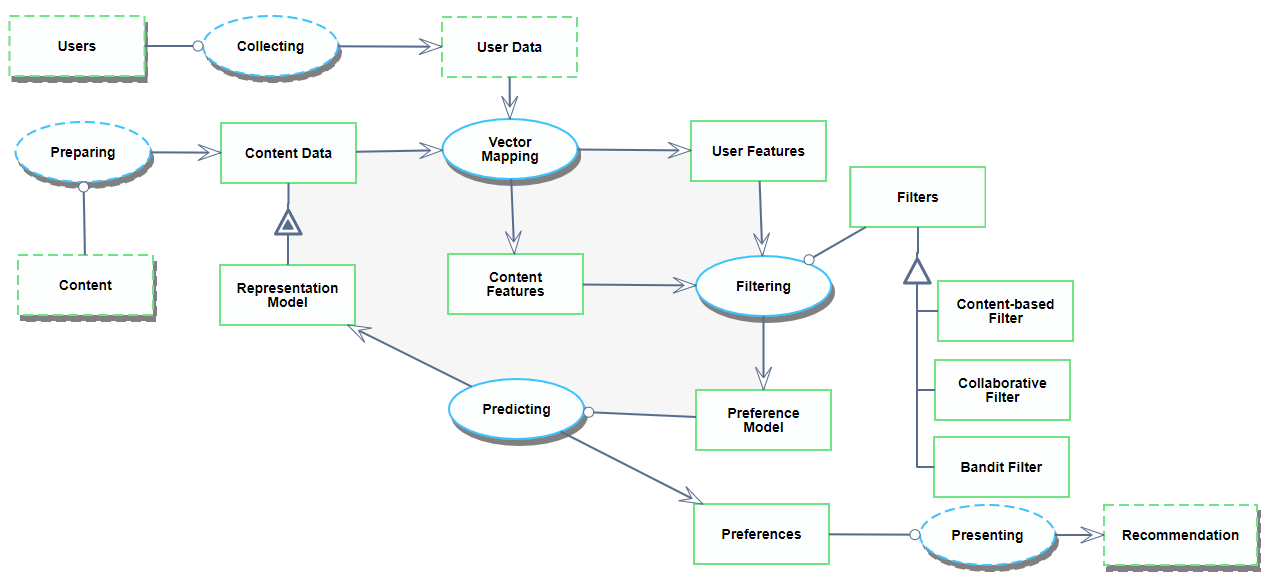
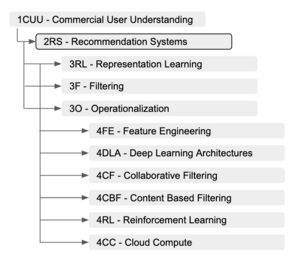
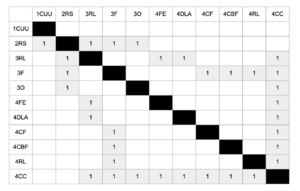
Recommendation systems have become a critical engine of the modern digital economy, allowing businesses to exploit user behaviors and similarities to develop specific notions of preference and relevance for their customers. Today, recommendation systems can be found “in the wild” in many different services ubiquitous to daily digital life, filtering the content we see (eg Spotify, Tik Tok, Netflix), products we are advertised (eg Instagram, Amazon), and humans we connect to (eg Tinder, LinkedIn). Against the backdrop of Level-1 commercial user understanding or personalization, we develop a Level-2 roadmap for Recommendation Systems (2RS) below.
OPM Model
DSM Allocation
Figures of Merit
| FOM | Definition | Units | Trends (dFOM/dt) |
|---|---|---|---|
| User Base Size | Number of users and datapoints used to generate a recommendation | [users] | The number of users and datapoints has increased over time as databases of users and their preferences has grown |
| Accuracy | Degree to which the recommendation is relevant to the user. This depends on the implementation of the recommender system, but one example could be match percentage (Netflix, OkCupid) | [%, relevant content recommended / total content recommended] | It is not clear that the quality of recommendations has increased over time. |
| Quantity | Number of recommendations generated by the system for each user | [recommendations] | The number of recommendations systems can generate has increased as the amount of content in the system has increased |
| Engagement | Number of users who display interest in the recommendation provided. This depends on the implementation of the recommender system. An example of this could be clicks or views. | [user clicks] | Unknown if this has changed over time |
Alignment with Company Strategic Drivers
Positioning of Company vs. Competition
Technical Model
We had difficulty finding the mathematical basis for a technical model so we decided to determine HR (Hit Rate) sensitivity experimentally. We built a neural network and used it to examine a space of 50 or so user submitted surveys ranking their favorite blockbusters over the past 5 years. We had an average HR of 66\% and could improve or worsen the hit rate by fiddling with various parameters as follows:
- Activation Threshold: changing the numerical threshold required for ``recommend vs ``don't recommend
- Learning Rate: changing how quickly the neural net adjusted weights based on incorrect predictions
- Training Iterations: changing how many times training data was repeated. This parameter has an interesting inverse relationship, less reuse resulted in greater accuracy of predictions
- Initial Weightings: By changing the initial weightings the model used we could affect the accuracy as well. The significant impact of this parameter is likely indicative of limited training data and/or an overly simplistic model
- Training percent: by altering what percentage of response were used for training data and what percent for evaluating the model we could significantly impact the hit rate, interestingly moving the ratio away from 80\% in both directions resulted in a higher hit rate, implying we had found a particularly bad split for our baseline.
The model itself can be found at https://github.mit.edu/ebatman/Recommender-System
Key Patents and Publications
Publications
Using Collaborative Filtering to Weave an Information Tapestry (Goldberg 1992) - One of the first publications describing a method of collaborative filtering in an application designed to manage huge volumes of electronic mail using human annotations of electronic documents.
Netflix Update: Try This at Home (Funk 2006) - Influential blog post proposing a matrix factorization algorithm to represent users and items in a lower dimensional space for the Netflix Prize challenge. By learning latent vectors for users $p_u$ and items $q_i$, matrix factorization estimates user-interaction as the inner product of $p_u^T q_i$.
A Survey of Accuracy Evaluation Metrics of Recommendation Tasks (Gunawardana and Shani, 2009) - Identifies 3 main tasks in the field of recommendation, Recommending Good Items, Optimizing Utility, and Predicting Ratings, and discusses different evaluation metrics suitable for each task. For recommending good items, metrics like precision, recall, and false positive are suitable. Interestingly, the authors note that summary metrics of the precision-recall curve such as F-measure or AUC are “useful for comparing algorithms independently of application, but when selecting an algorithm for use in a particular task, it is preferable to make the choice based on a measure that reflects the specific needs at hand.” For utility optimization, the authors suggest the half-life utility score of Breese et al, and for the prediction task, RMSE (and others in this family of metrics) are used.
The Netflix Recommender System: Algorithms, Business Value, and Innovation (Gomez-Uribe and Hunt, 2015) - A rare peek into the inner workings of an industry-grade recommender system. Describes the nuances of formulating the recommendation problem correctly for each user-facing feature. For example, the formulation for the Personalized Video Ranker must rank the entire catalog of videos for each genre or subcategory (eg Suspenseful Movies) for each user based on preference. Meanwhile, the Top-N Video Ranker is optimized only for the head of the catalog ranking (rather than the ranking for the entire catalog). Furthermore, recommendation formulations like video-video similarity to support the Because You Watched feature must optimize for content similarity.
SAR: Semantic Analysis for Recommendation (Xiao and Meng, 2017) - Presents an algorithm for personalized recommendations based on user transaction history. SAR is a generative model; it creates an item similarity matrix $S$ to estimate item-item relationships, an affinity matrix $A$ to estimate user-item relationships, and then computes recommendation scores by conducting matrix multiplication.
Neural Collaborative Filtering (He et al 2017) - NCF is a deep neural matrix factorization model, which ensembles Generalized Matrix Factorization (GMF) and Multi-Layer Perceptron (MLP) to unify the strengths of linearity of MF and non-linearity of MLP for modelling the user–item latent structures.


