Difference between revisions of "Random Forest in Data Analytics"
| Line 6: | Line 6: | ||
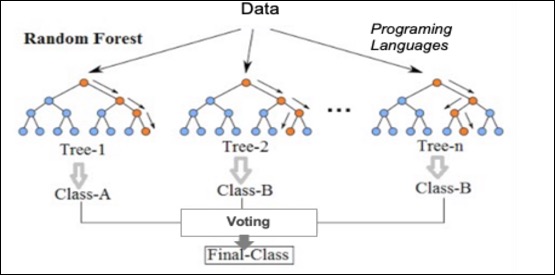
The high level workflow is depicted in the below. | The high level workflow is depicted in the below. | ||
[[File: | [[File:workflow.jpg]] | ||
Random forest is an ensemble Machine Learning technique to boost the accuracy of prediction of future, based on data from the past. | Random forest is an ensemble Machine Learning technique to boost the accuracy of prediction of future, based on data from the past. | ||
Revision as of 01:39, 8 October 2019
Technology Roadmap Sections and Deliverables
Unique identifier:
- 3RF-Random Forest
This is a “level 3” roadmap at the technology/capability level (see Fig. 8-5), where “level 1” would indicate a market level roadmap and “level 2” would indicate a product/service level technology roadmap.
Roadmap Overview
The high level workflow is depicted in the below.
Random forest is an ensemble Machine Learning technique to boost the accuracy of prediction of future, based on data from the past. “Wisdom of crowd” Building block is decision tree; a voting scheme is used to determine the final prediction Commonly used ensemble approaches are booting, bagging, and stacking
Design Structure Matrix (DSM) Allocation
The 3-RF tree that we can extract from the DSM above shows us that the Random Forest(3RF) is part of a larger data analysis service initiative on Machine Learning (ML), and Machine Learning is also part of a major marketing initiative (here we use online advertising as an example). Random Forest requires the following key enabling technologies at the subsystem level: Bagging (4BAG), Stacking (4STK), and Boosting (4BST). These three are the most common approaches in Random Forest, and are the technologies and resources at level 4.
Roadmap Model using OPM
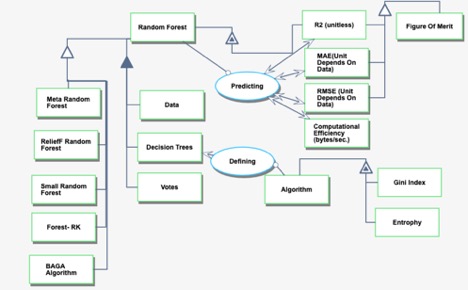
We provide an Object-Process-Diagram (OPD) of the 3RF roadmap in the figure below. This diagram captures the main object of the roadmap (Random Forest), its various instances with a variety of focus, its decomposition into subsystems (data, decision trees, votes), its characterization by Figures of Merit (FOMs) as well as the main processes (defining, predicting).
An Object-Process-Language (OPL) description of the roadmap scope is auto-generated and given below. It reflects the same content as the previous figure, but in a formal natural language.
Figures of Merit
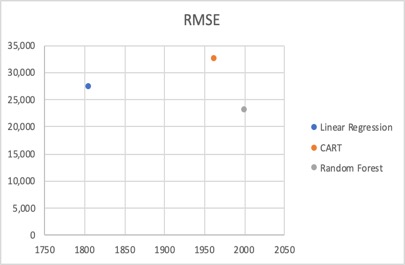
The table below show a list of FOMs by which the Random Forest models can be assessed. The first three are used to assess the accuracy of the model. Among all three, the Root Mean Squared Error (RMSE) is a FoM commonly used to measure the performance of predictive models.Since the errors are squared before they are averaged, the RMSE gives a relatively high weight to larger errors in comparison to other performance measures such as R2 and MAE. To measure prediction, the RMSE should be calculated with out-of-sample data that was not used for model training. From a mathematical standpoint, RMSE can vary between positive infinity and zero. A very high RMSE indicates that the model is very poor at out-of-sample predictions. While an RMSE of zero is theoretically possible, this would indicate perfect prediction and is extremely unlikely in real-world situations.
Due to the nature of this technology, it's been challenging to quantify the growth of FOM over time, because it's not only related to the technology itself (algorithm), but also the dataset, as well as parameters selected for modeling, such as number of trees, etc. We've tried to use the same dataset to run three models with optimized parameters, and the chart below shows the difference in RMSE vs. Year.
Random Forest is still being rapidly developed with tremendous efforts from many research groups around the world, to improve its performance. Meanwhile, there are also lots of efforts on the implementation and application space, such as finance, investment, service, high tech, and energy industry, etc.


