Difference between revisions of "Sustainable Aviation Fuel"
| Line 25: | Line 25: | ||
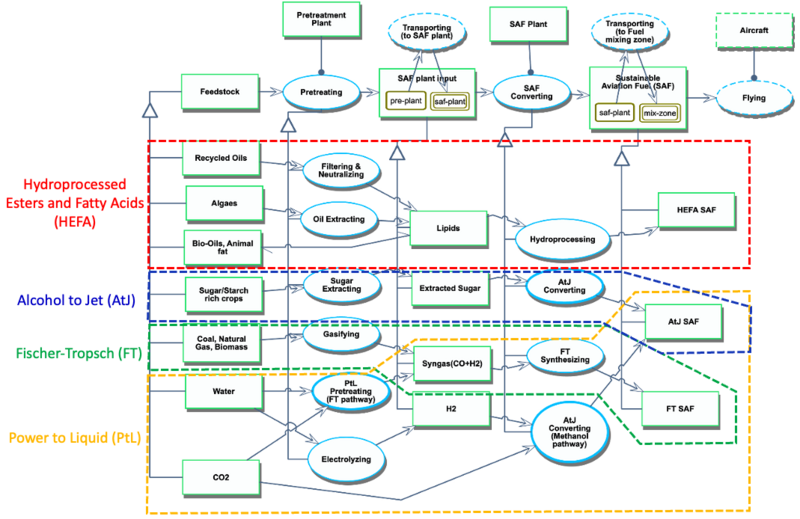
[[File:saf_overview_opd.png|800px|]] | [[File:saf_overview_opd.png|800px|]] | ||
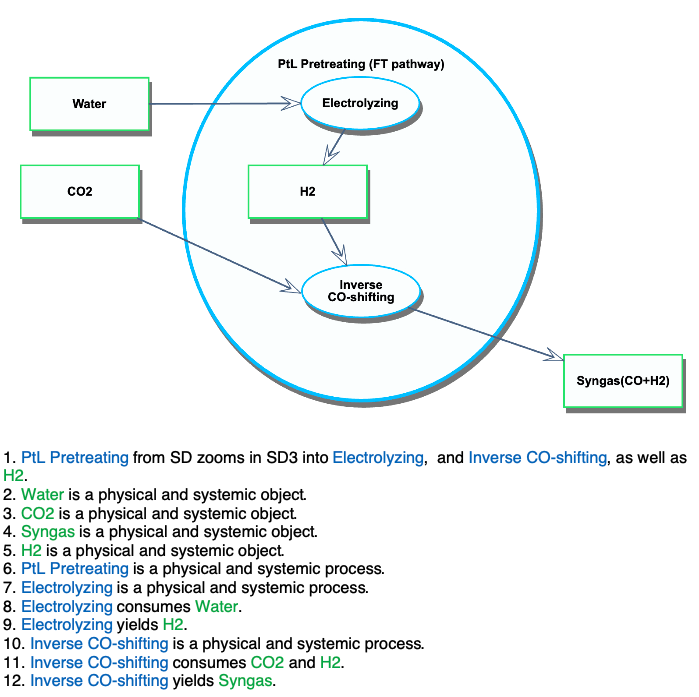
Three functional zoom-up views of the OPD are shown in the following figures. | |||
'''PtL Pretreating (FT pathway)''' | |||
[[File:saf_zoom_ptlpre_opd.png|800px|]] | |||
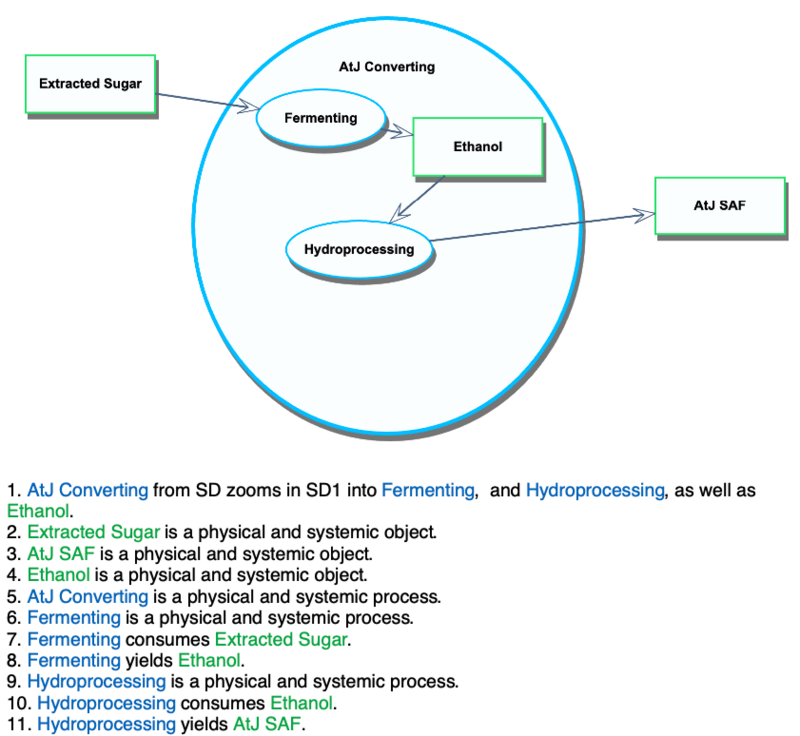
'''AtJ Converting''' | |||
[[File:saf_zoom_atj_opd.png|800px|]] | |||
'''AtJ Converting(Methanol pathway)''' | |||
[[File:saf_zoom_atj_mt_opd.png|800px|]] | |||
==Figures of Merit== | ==Figures of Merit== | ||
Revision as of 11:17, 12 October 2023
Technology Roadmap Sections and Deliverables
Our technology roadmap identifier is shown as:
- 2SAF - Sustainable Aviation Fuel
This indicates that we are dealing with a “level 2” roadmap at the product level, where “level 1” would indicate a market level roadmap and “level 3” or “level 4” would indicate an individual technology roadmap.
Roadmap Overview
Sustainable aviation fuel (SAF) is a strong candidate to deal with global warming in the context of aviation, using low carbon footprint resources such as biomass and waste oil. SAF has a good compatibility with the present aircraft. SAF has similar characteristics to the current jet fuel and can be mixed with it, so the architecture of aircraft does not need to change. On the other hand, another strong alternative for low carbon footprint fuel is hydrogen, which needs the rearchitecting of the aircraft because of its small density and temperature, affecting the vehicle size. The following figure coming from FAA shows SAF is the key toward the ambitious goal of "net zero CO2 emissions" in aviation.
File:Netzero aviation.jpeg Source: netzero
For producing SAF, there are several pathways depending on feedstock and the way of conversion from feedstock to SAF. However, each pathway has advantages and disadvantages such as cost, scalability, and technological readiness. This roadmap tries to identify the impactful technologies on the feasibility of SAF, and show their development plan.
Design Structure Matrix (DSM) Allocation

The above 1SAF tree shows the relationship between other technologies related to the SAF. Specifically, the enabling technologies to SAF, by either the introduction of new materials or a new process, are considered. The enabling of SAF with the novel use of existing materials are indicated with the connection of SAF to 2HEF, 2ATJ, 2FTC, 2PTF, 3BAF, 3CLS, 3CNB, and 3WCO. The enabling of SAF through the introduction of new processes are shown through SAF connections to 3ROI, 3NTF, 3HPS, 3SEX, 3FNT, 3GAS, 3FTS, 3ELS, 3ICS, and 3MES. In the DSM, the connections of SAF to Level 2 and 3 technologies are shown in the DSM. In the following section, the further details on the SAF production architecture is presented using Object-Process Methodology (OPM).
Roadmap Model using OPM
The Object-Process-Diagram (OPD) of the 2SAF - Sustainable Aviation Fuel roadmap is presented in the figure below. This diagram shows the processes (Pretreating, and SAF Converting) for producing SAF with the representative pathways with different types of feedstock. We include four different SAF producing categories: 1) Hydroprocessed Esters and Fatty Acids(HEFA) with recycled oils, bio-oils, and animal fat, 2) Alcohol-to-Jet(AtJ) with cellulose, 3) Fischer-Tropsch(FT) with coal, natural gas, and biomass, and 4) Power-to-Liquid(PtL) with water and CO2.
Three functional zoom-up views of the OPD are shown in the following figures.
AtJ Converting(Methanol pathway)

Figures of Merit
The table below shows a list of FOMs by which sustainable aviation fuel can be assessed. The first four (shown in bold) are identified as main FoMs for sustainable aviation fuel with the following reasons: 1)one of the biggest disadvantages of SAF is its cost. 2) Currently, SAF blend ratio to the current jet fuel is up to 50%, and this blend ratio needs to be improved for net zero emission. 3) CO2 emission when producing SAF also needs to be assessed to fairly evaluate the net CO2 emission. The other five FoMs are used for the analyzing the trade-off of the technology choice used for SAF production.
The figure below is an expected SAF blending ratio improvement, assuming the net zero CO2 emission by 2050.
As mentioned above, the cost is a key to assess SAF. We summarize the governing equations given in the literature in the following table.
The following figure is the example of the SAF cost with a HEFA and a FT. The utopia point is left-bottom in those figures.
