Difference between revisions of "AI Safety Aviation"
(Added OPM to roadmap) |
(Added detail of accidents per year FOM and updated FOM trends) |
||
| Line 24: | Line 24: | ||
| Incident Rate | | Incident Rate | ||
|| Rate of incidents and accidents normalized by flight time aircraft | || Rate of incidents and accidents normalized by flight time aircraft | ||
|| | || decreasing | ||
|| | || | ||
<html> | <html> | ||
| Line 36: | Line 36: | ||
|- | |- | ||
| System Maintainability | | System Maintainability | ||
|| How | || How much time is spend maintaining aircraft systems, measured by comparing maintenance time per flight time | ||
|| | || decreasing | ||
|| | || | ||
<html> | <html> | ||
| Line 43: | Line 43: | ||
<mfrac> | <mfrac> | ||
<mrow> <mtext>maintenance hours</mtext> </mrow> | <mrow> <mtext>maintenance hours</mtext> </mrow> | ||
<mtext>passenger mile</mtext> | <mtext>passenger mile</mtext> | ||
</mfrac> | </mfrac> | ||
| Line 63: | Line 50: | ||
| Response Time | | Response Time | ||
|| Time required to identify and mitigate safety issues | || Time required to identify and mitigate safety issues | ||
|| | || flat | ||
|| | || | ||
<html> | <html> | ||
| Line 73: | Line 60: | ||
| System Uptime | | System Uptime | ||
|| Amount of time aircraft is available to be dispatched on a mission as a percentage of wall time | || Amount of time aircraft is available to be dispatched on a mission as a percentage of wall time | ||
|| | || increasing | ||
|| | || | ||
<html> | <html> | ||
| Line 83: | Line 70: | ||
| Cognitive Load on Crew | | Cognitive Load on Crew | ||
|| As measured by industry standard NASA TLX score | || As measured by industry standard NASA TLX score | ||
|| | || flat | ||
|| | || | ||
<html> | <html> | ||
| Line 93: | Line 80: | ||
|} | |} | ||
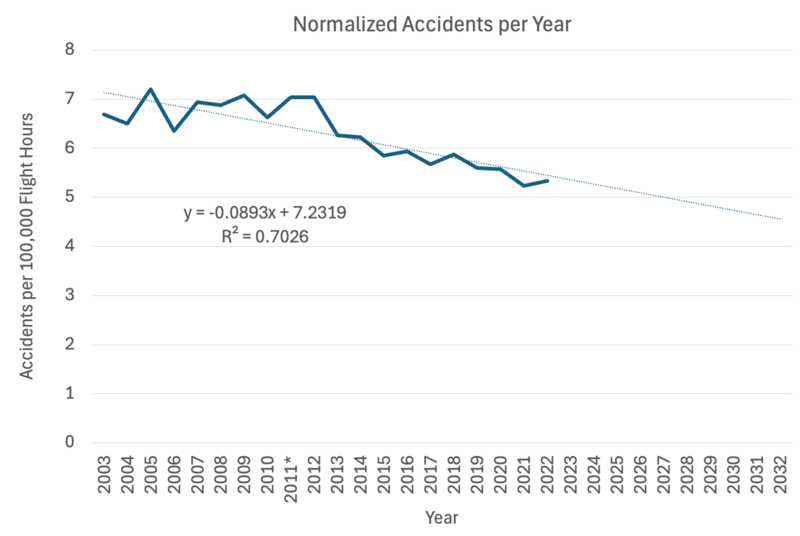
== Detail of Accidents per passenger hour == | |||
[[File:3AISC-accidents-per-flight-hour.png | 800px | Normalized Accidents per Year, United States General Aviation Fleet]] | |||
Revision as of 17:02, 10 October 2024
Roadmap Overview
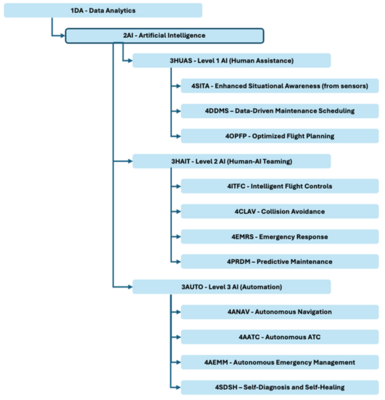
Focuses on the integration of artificial intelligence, particularly machine learning, into safety-critical aviation systems while maintaining the highest standards of safety and trustworthiness. It encompasses a phased approach, starting with human assistance/augmentation (Level 1 AI), progressing to human-AI teaming (Level 2 AI), and ultimately advancing to more automated solutions (Level 3 AI). Key aspects include developing AI assurance frameworks, addressing human factors in AI integration, implementing safety risk mitigation strategies, and ensuring compliance with evolving regulatory requirements. This technology aims to enhance aviation safety, efficiency, and performance across various domains including aircraft design and operation, air traffic management, and unmanned aircraft systems.
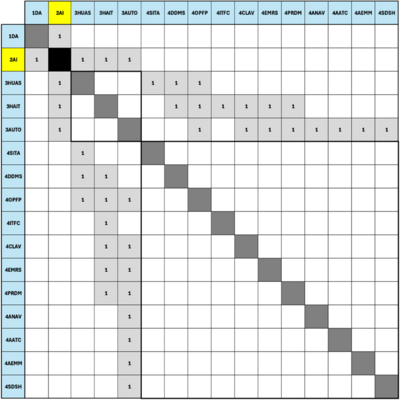
DSM Allocation
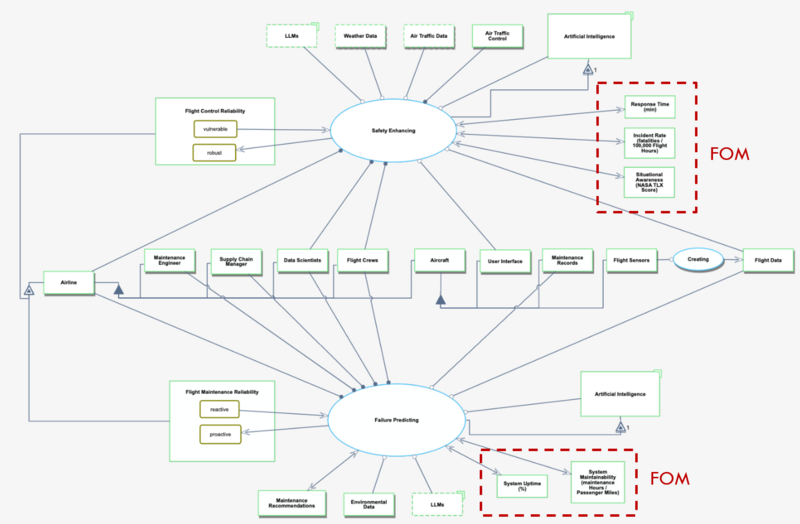
Roadmap Model
Figures of Merit
| Figure of Merit | Description | Trends | Units |
|---|---|---|---|
| Incident Rate | Rate of incidents and accidents normalized by flight time aircraft | decreasing |
|
| System Maintainability | How much time is spend maintaining aircraft systems, measured by comparing maintenance time per flight time | decreasing |
|
| Response Time | Time required to identify and mitigate safety issues | flat |
|
| System Uptime | Amount of time aircraft is available to be dispatched on a mission as a percentage of wall time | increasing |
|
| Cognitive Load on Crew | As measured by industry standard NASA TLX score | flat |
|


