Difference between revisions of "Floating Offshore Wind Turbine Generator"
| Line 72: | Line 72: | ||
[[File:Section 7_2.JPG]] | [[File:Section 7_2.JPG]] | ||
==Key Publications, Presentations and Patents== | |||
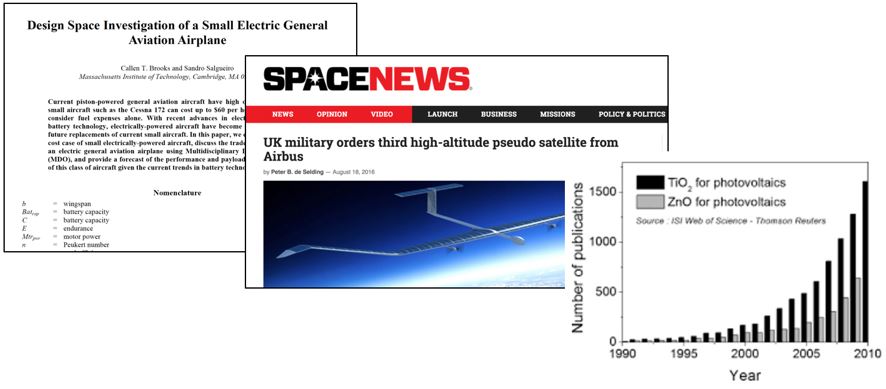
A good technology roadmap should contain a comprehensive list of publications, presentations and key patents as shown in Figure 8-19. This includes literature trends, papers published at key conferences and in the trade literature and trade press. | |||
[[File:Section 10 1.JPG]] | |||
Revision as of 18:51, 4 November 2024
Technology Roadmap Sections and Deliverables
Team 20 is to present a "level 3” roadmap of Floating Offshore Wind Turbine Generators. The following code is the identifier.
- 3FOWTG - Floating Offshore Wind Turbine Generator
Roadmap Overview
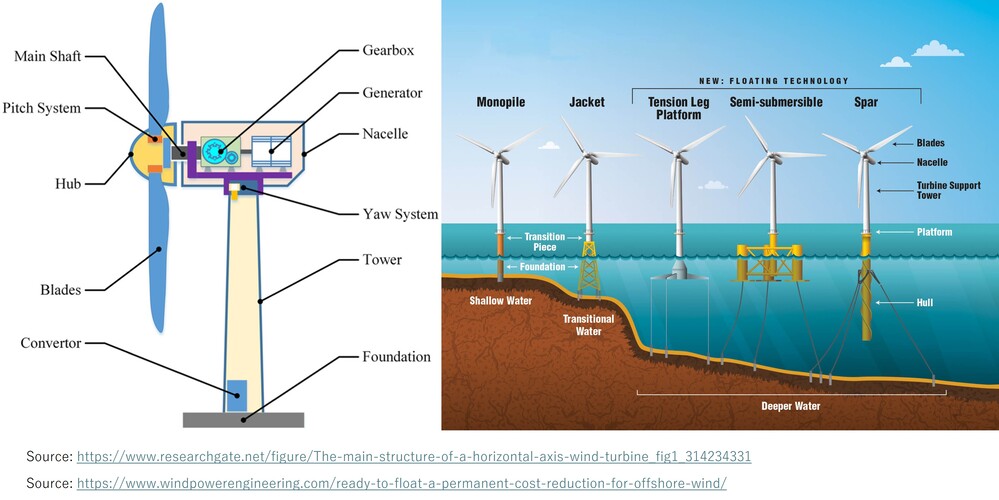
Floating Offshore Wind Turbine Generators are a technology that generates electricity by converting wind energy using turbines mounted on floating structures, which are moored to the seabed and remain stable at sea or on lakes. This technology is a form of offshore wind power, and compared to fixed systems, Floating Offshore Wind Turbine Generators can be installed in deeper waters or in coastal areas with limited space.
As the global shift toward renewable energy accelerates, wind power plays a central role. As of 2022, global wind power capacity has reached 906 GW, but the vast majority of this is onshore wind power, with offshore wind accounting for only 7.1%. Offshore wind power is divided into two types: "fixed" and "floating." This roadmap focuses on the latter, which is still in its early stages of development.
Fixed wind power involves anchoring the turbine to the seabed, usually in shallow waters up to 50 meters deep, and is a relatively mature technology. In contrast, Floating Offshore Wind Turbine Generators, which are suited for deep-water areas or countries with limited coastal space such as Japan, the U.S. West Coast, and Norway, face fewer restrictions on installation locations. However, challenges remain in terms of stability at sea, transporting electricity to land, and reducing costs. Currently, floating systems are approximately twice as expensive as fixed systems, and large-scale commercialization is expected to take time. Nevertheless, as technology advances, the adoption of Floating Offshore Wind Turbine Generators is anticipated to increase significantly in the future.
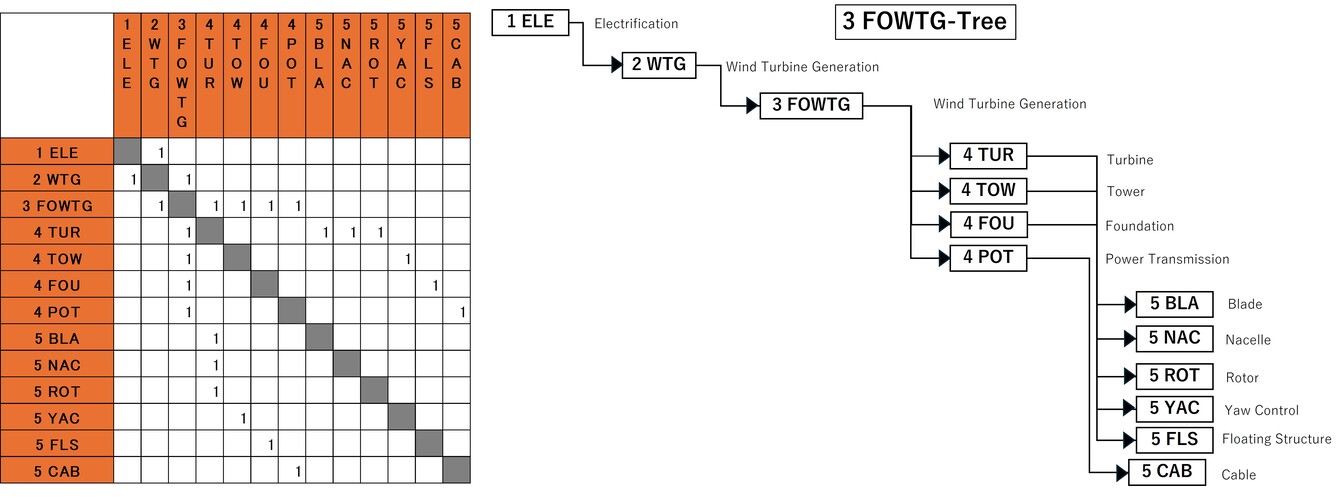
Design Structure Matrix (DSM) Allocation
The 3FOWTG tree that we can extract from the DSM above shows us that the Floating Offshore Wind Turbine Generator (3FOWTG) is part of a larger industry-wide initiative on "Wind Turbine Generation" (2WTG), included in a type of electrification, and that it requires the following key enabling technologies at the subsystem level: 4TUR Turbine, 4TOW Tower, 4FOU Foundation, and 4POT Power Transmission. In turn, these require enabling technologies at level 5: 5BLA Blade, 5NAC Nacelle, 5ROT Rotor, 5YAC Yaw Control, 5FLS Floating Structure (such as the structure of spar and semi-submersible), and 5CAB Cable.
Roadmap Model using OPM
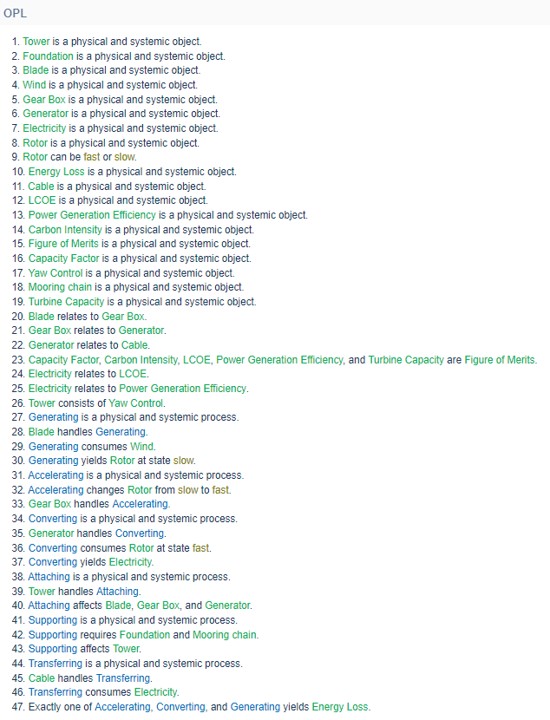
Team 20 hereby displays OPD of 3FOWTG – Floating Offshore Wind Turbine Generator (WTG) This consists of level 3 decomposed WTG, associated products and figure of merit (FOM). Associated OPL is displayed below. This represents the relationships among each object shown in the OPM above.
Figures of Merit
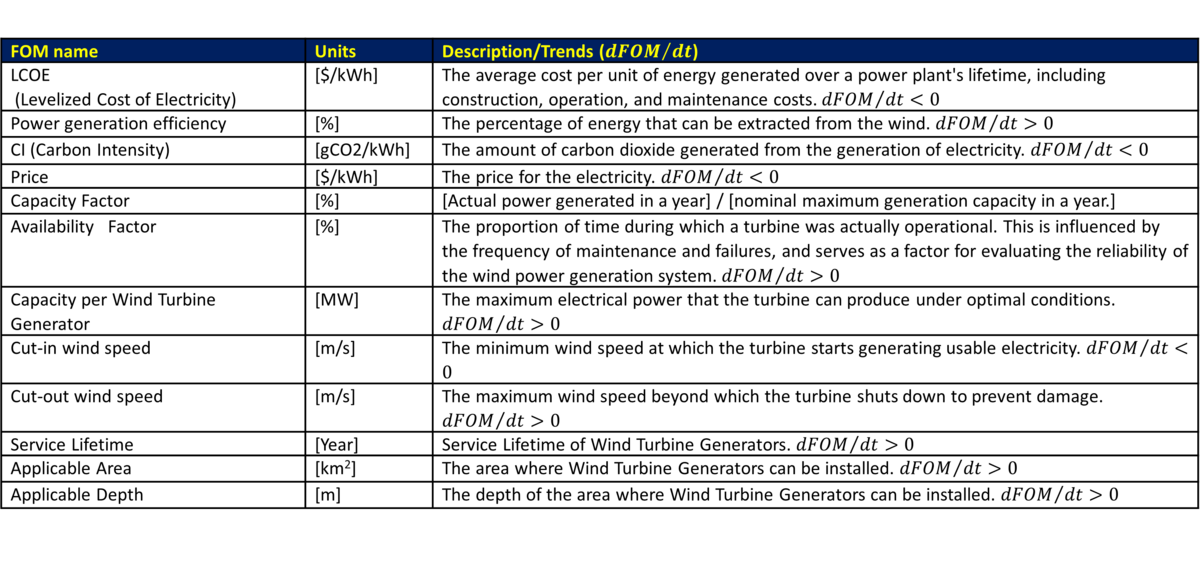
The table below is to show a list of FOMs of 3FOWTG.
Besides defining what the FOMs are, this section of the roadmap should also contain the FOM trends over time dFOM/dt as well as some of the key governing equations that underpin the technology. Each trend over time dFOM/dt is included in the table above.
The table below shows an example of a key governing equation governing wind turbine generators.
Alignment with Company Strategic Drivers
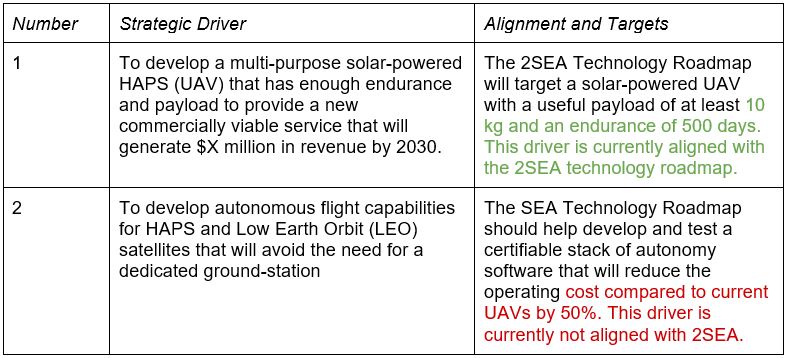
The table below shows an example of potential strategic drivers and alignment of the 2SEA technology roadmap with it.
The list of drivers shows that the company views HAPS as a potential new business and wants to develop it as a commercially viable (for profit) business (1). In order to do so, the technology roadmap performs some analysis - using the governing equations in the previous section - and formulates a set of FOM targets that state that such a UAV needs to achieve an endurance of 500 days (as opposed to the world record 26 days that was demonstrated in 2018) and should be able to carry a payload of 10 kg. The roadmap confirms that it is aligned with this driver. This means that the analysis, technology targets, and R&D projects contained in the roadmap (and hopefully funded by the R&D budget) support the strategic ambition stated by driver 1. The second driver, however, which is to use the HAPS program as a platform for developing an autonomy stack for both UAVs and satellites, is not currently aligned with the roadmap.
Positioning of Company vs. Competition
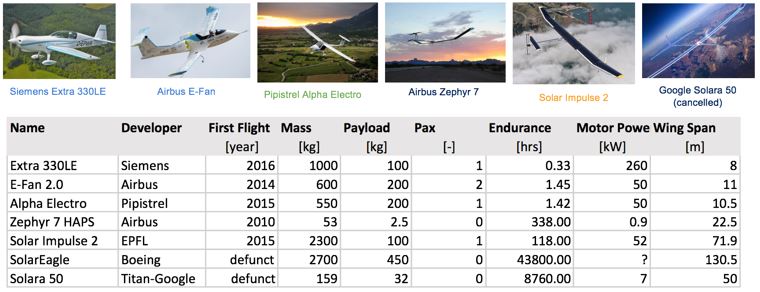
The figure below shows a summary of other electric and solar-electric aircraft from public data.
The aerobatic aircraft Extra 330LE by Siemens currently has the world record for the most powerful flight certified electric motor (260kW). The Pipistrel Alpha Electro is a small electric training aircraft which is not solar powered, but is in serial production. The Zephyr 7 is the previous version of Zephyr which established the prior endurance world record for solar-electric aircraft (14 days) in 2010. The Solar Impulse 2 was a single-piloted solar-powered aircraft that circumnavigated the globe in 2015-2016 in 17 stages, the longest being the one from Japan to Hawaii (118 hours).
SolarEagle and Solara 50 were both very ambitious projects that aimed to launch solar-electric aircraft with very aggressive targets (endurace up to 5 years) and payloads up to 450 kg. Both of these projects were canceled prematurely. Why is that?
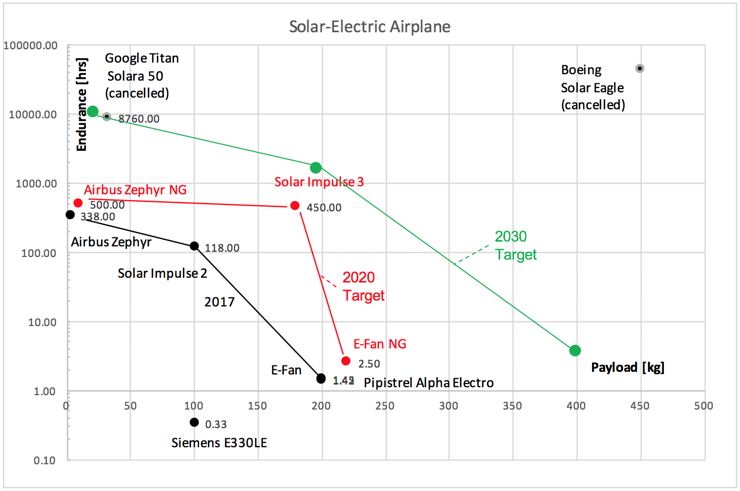
The Pareto Front (see Chapter 5, Figure 5-20 for a definition) shown in black in the lower left corner of the graph shows the best tradeoff between endurance and payload for actually achieved electric flights by 2017. The Airbus Zephyr, Solar Impulse 2 and Pipistrel Alpha Electro all have flight records that anchor their position on this FOM chart. It is interesting to note that Solar Impulse 2 overheated its battery pack during its longest leg in 2015-2016 and therefore pushed the limits of battery technology available at that time. We can now see that both Solar Eagle in the upper right and Solara 50 were chasing FOM targets that were unachievable with the technology available at that time. The progression of the Pareto front shown in red corresponds to what might be a realistic Pareto Front progression by 2020. Airbus Zephyr Next Generation (NG) has already shown with its world record (624 hours endurance) that the upper left target (low payload mass - about 5-10 kg and high endurance of 600+ hours) is feasible. There are currently no plans for a Solar Impulse 3, which could be a non-stop solar-electric circumnavigation with one pilot (and an autonomous co-pilot) which would require a non-stop flight of about 450 hours. A next generation E-Fan aircraft with an endurance of about 2.5 hours (all electric) also seems within reach for 2020. Then in green we set a potentially more ambitious target Pareto Front for 2030. This is the ambition of the 2SEA technology roadmap as expressed by strategic driver 1. We see that in the upper left the Solara 50 project which was started by Titan Aerospace, then acquired by Google, then cancelled, and which ran from about 2013-2017 had the right targets for about a 2030 Entry-into-Service (EIS), not for 2020 or sooner. The target set by Solar Eagle was even more utopian and may not be achievable before 2050 according to the 2SEA roadmap.
Technical Model
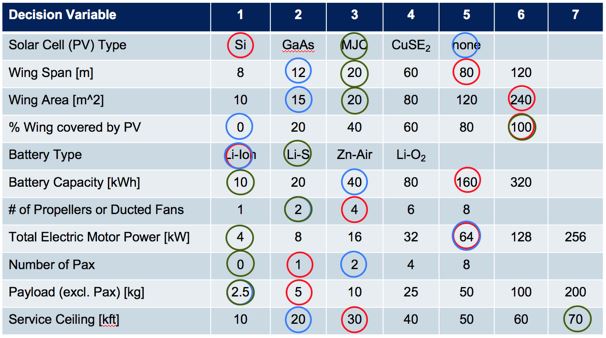
In order to assess the feasibility of technical (and financial) targets at the level of the 2SEA roadmap it is necessary to develop a technical model. The purpose of such a model is to explore the design tradespace and establish what are the active constraints in the system. The first step can be to establish a morphological matrix that shows the main technology selection alternatives that exist at the first level of decomposition, see the figure below.
It is interesting to note that the architecture and technology selections for the three aircraft (Zephyr, Solar Impulse 2 and E-Fan 2.0) are quite different. While Zephyr uses lithium-sulfur batteries, the other two use the more conventional lithium-ion batteries. Solar Impulse uses the less efficient (but more affordable) single cell silicon-based PV, while Zephyr uses specially manufactured thin film multi-junction cells and so forth.
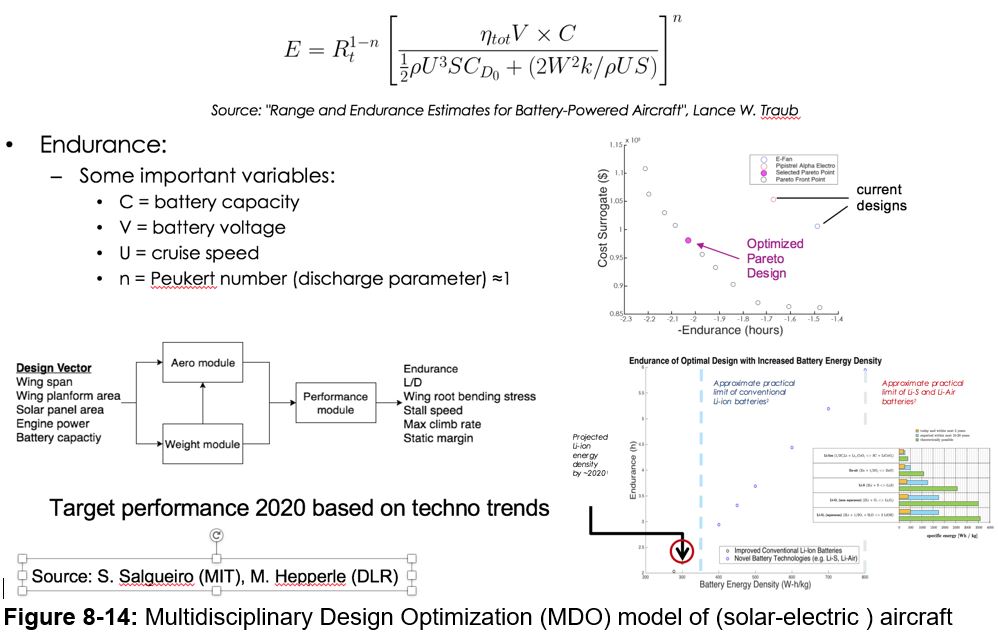
The technical model centers on the E-range and E-endurance equations and compares different aircraft sizing (e.g. wing span, engine power, battery capacity) taking into account aerodynamics, weights and balance, the performance of the aircraft and also its manufacturing cost. It is important to use Multidisciplinary Design Optimization (MDO) when selecting and sizing technologies in order to get the most out of them and compare them fairly (see below).
Key Publications, Presentations and Patents
A good technology roadmap should contain a comprehensive list of publications, presentations and key patents as shown in Figure 8-19. This includes literature trends, papers published at key conferences and in the trade literature and trade press.
