Difference between revisions of "FSOC"
| Line 73: | Line 73: | ||
[[File:BER_formula_FSOC.png|center|200px]] | [[File:BER_formula_FSOC.png|center|200px]] | ||
Where P is the received power at the detector, Ep is the energy per photon in Joules, and BW is the bandwidth of the system. The sensitivity analysis is carried out by taking the partial derivative of each FOM with respect to the parameter of interest. For channel capacity C, and bit error rate BER, the parameters differentiated over are P, and BW. For the BER partial derivatives, | Where P is the received power at the detector, Ep is the energy per photon in Joules, and BW is the bandwidth of the system. The sensitivity analysis is carried out by taking the partial derivative of each FOM with respect to the parameter of interest. For channel capacity C, and bit error rate BER, the parameters differentiated over are P, and BW. For the BER partial derivatives, | ||
[[File:calculations_1_FSOC.png|center| | [[File:calculations_1_FSOC.png|center|300px]] | ||
The normalized percent change is then calculated by multiplying the partial derivative by a small change in the parameter of interest, and dividing it by the FOM’s response. | The normalized percent change is then calculated by multiplying the partial derivative by a small change in the parameter of interest, and dividing it by the FOM’s response. | ||
[[File:percent_change_fsoc.png|center| | [[File:percent_change_fsoc.png|center|300px]] | ||
Calculating the percent change for a system with a BW of 10 MHz, a received power of 500e-9 Watts. | Calculating the percent change for a system with a BW of 10 MHz, a received power of 500e-9 Watts. | ||
Revision as of 16:50, 5 November 2024
Welcome to the Free-Space Optical Communications Technology Roadmap.
- Technology Roadmap Identified as FSOC - Free-Space Optical Communications
- This indicates a Level 2 Individual-Technology Level Roadmap. This page describes the functions, uses, history, present, and future development of Free Space Optical Communication.
Roadmap Overview
Free-space optical communication (FSOC) utilizes optical carriers in the visible and infrared (IR) spectrum to transmit information wirelessly. This combined spectrum is 2,000 times larger than that used in RF technologies. The narrow beam of the optical signal, along with FSOC's point-to-point architecture, enables energy-efficient and secure communication links. As 6G networks demand advancements in data rates, channel capacity, power efficiency, and low latency, FSOC emerges as a promising solution. This roadmap explores the implementation of coherent FSOC for next-generation wireless communications.
Design Structure Matrix (DSM) Allocation
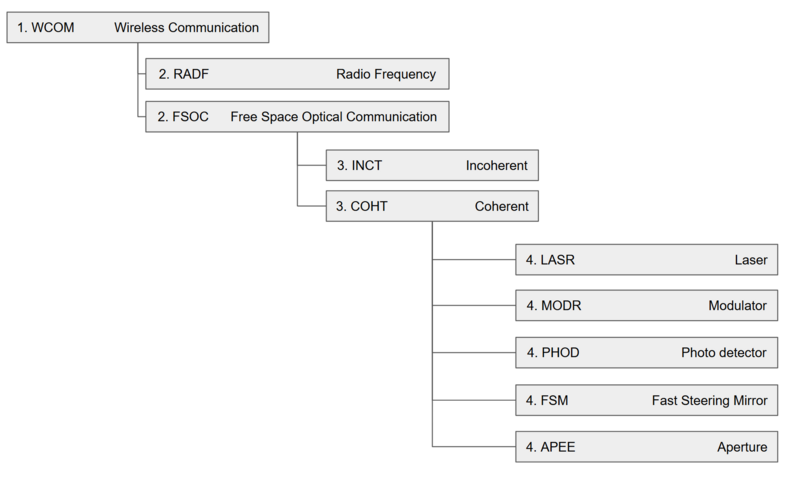
DSM Tree
This DSM tree was constructed for the FSOC technology in the context of larger wireless communication technologies.
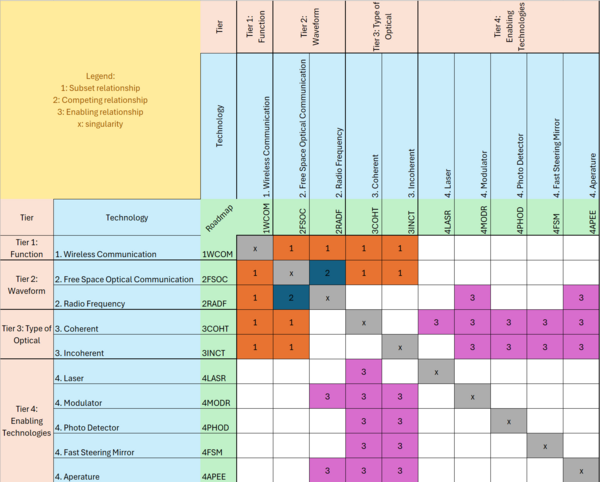
DSM Matrix
This DSM shows the relationships between FSOC and the most important technology roadmaps that are broader, competing, and enabling to FSOC.
Roadmap Model Using OPM
We use OPD to create a model of the FSOC technology, including its attributes, and the relevant processes that compose it.
Roadmap Figures of Merit
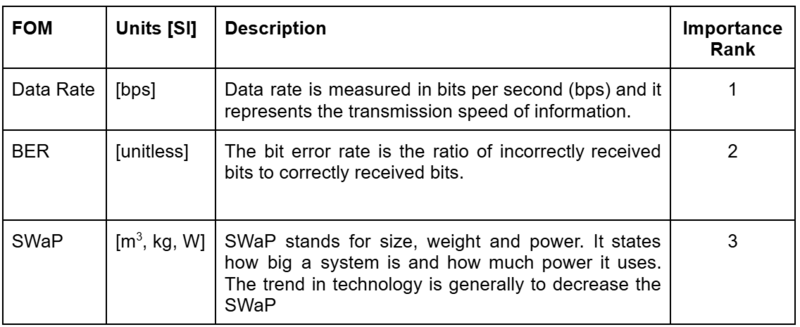
Key FOMs
This table shows the key figures of merit used to quantify the progress of this technology over time.
The following graph contains information on trends for the main figure of merit we can trace through most communication systems: Data Rate. Whereas this graph focuses on FSOC technology, the use and mention of data rate comes as a way to quantify communication technology progress over time from centuries ago.
Alignment with Company Strategic Drivers
Free Space Optical Communication is a technology characterized by a set of goals, which can be boiled down to providing more reliable communication technology with reduced power consumption at cheaper costs to all locations. The strategic drivers in this technology space are identified below, and the alignment of this roadmap is highlighted.
Positioning of Company vs. Competition
The following table created by NASA shows the current Laser Communication Terminals that exist in the market this roadmap is targeting.
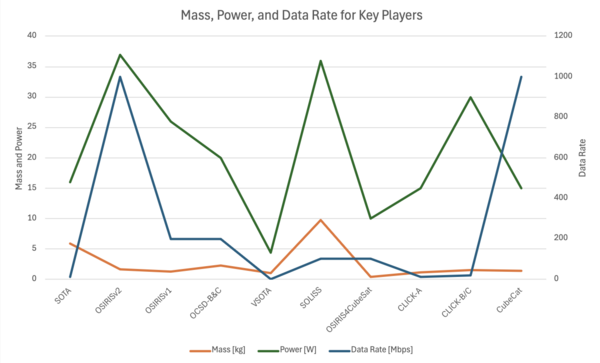
This table shows previously mentioned Figures of Merit such as Data Rate, Mass, and Power. These are shown in the context of mission developer, platform, and launch date. The table also includes wavelength. Whereas this roadmap focuses on data rate, bit error rate, and SWaP, the table above allows us to highlight the common use of a 1550nm Wavelength, which is in the near infrared regime, which allows a lot of the players to use previously existing components from older fiber technology to carry out their innovative projects. In terms of data rate, mass, and power, the consensus seems to be a push for higher data rates. The following chart shows each player's position with respect to each of these figures of merit.
Before delving deeper into discussion, we must note that the plot shown above excludes TBIRD, which accomplished a whopping 200 Gbits of data rate with a mass of 3kgs and a power consumption of 100W. Compared to all the other players, this terminal was an outlier and is thus excluded from the plot. It remains however an interesting business case exploration, as one can question the usability cases of such high data rates with current infrastructures and integration capabilities available to the population.
The chart shows that the field of players seems to be divided amongst those who achieve higher data rates by incurring a higher weight penalty (being heavier) or by incurring a higher power penalty (using more power to function). This chart shows that amongst the main players, CubeCAT seems to be accomplishing the highest data rate with the lowest mass and power penalties, as mentioned in the previous section of this roadmap.
Technical Model
Morphological Matrix
A morphological matrix is shown for the technology introduced in the previous section. This generally outlines where different technologies lay in the given specific categories, and can be used as a tool to compare them.
Tradespace
FoM Trades and Design Space
The following tradespace graphs chart the data from existing optical terminals, outlined in the Positioning of Company vs. Competition. They show Data Rate (our key figure of merit) plotted against each Power and Mass. The gold star in the top left indicates the utopia point. Bit error rate and size information for many of these terminals could not be determined. Tradspace graphs omit MIT Lincoln Labs terminal called TBIRD because it is an extreme outlier in terms of data rate (200,000 Mbps), making the rest of the graph unreadable.
The distribution of terminals does not create a typical pareto frontier. This indicates that either power and data rate are not a tradeoff. This is unlikely based on the analysis of the basic governing equations. Another explanation is that the lack of technical maturity in the optical terminal field means that terminals are not yet optimized for power consumption.
Similar to the Power vs Data Rate chart discussed above, there is not a strong pareto frontier in the Mass vs Data Rate tradespace. We expect that as optical terminals become more mature and commercially viable, a more typical tradeoff will emerge. Terminals capable of transmitting at higher data rates will likely require larger and heavier components.
Sensitivity Analyses
A sensitivity analysis will be carried out for channel capacity and BER (bit error rate). Channel capacity refers to the maximum Data Rate allowed in a given channel. The formula for channel capacity is as follows:
For the purpose of this model, and for ease of mathematical formulation, channel capacity will be used instead of data rate. The BER for a FSOC link can be described using the equation:
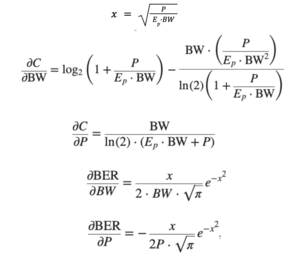
Where P is the received power at the detector, Ep is the energy per photon in Joules, and BW is the bandwidth of the system. The sensitivity analysis is carried out by taking the partial derivative of each FOM with respect to the parameter of interest. For channel capacity C, and bit error rate BER, the parameters differentiated over are P, and BW. For the BER partial derivatives,
The normalized percent change is then calculated by multiplying the partial derivative by a small change in the parameter of interest, and dividing it by the FOM’s response.
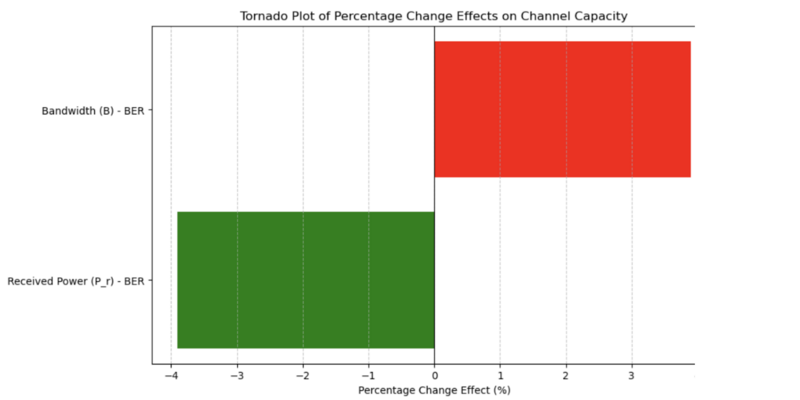
Calculating the percent change for a system with a BW of 10 MHz, a received power of 500e-9 Watts.
The Tornado charts are separated into two different tornado figures since BER and C vary at a different rate.
Key Publications, Presentations and Patents
Free-space optical communication (FSOC) terminals transmit data across a line of sight (LOS) path via light waves. The main components of the technology are the emitter laser and optics, the photodetector and receiver optics, and the steering mechanism to align both terminals relative to each other. FSOC is used for intersatellite crosslinks, downlinks to ground stations on earth, and also from earth to space. Optical communications have also been established for point to point on earth and underwater communications. The Consultative Committee for Sapce Data Systems published the “orange book” to standardize the practice of optical communications, from the coding and synchronization schemes applied at specific wavelengths, to various fine and coarse pointing acquisition and tracking techniques used to establish and maintain a link between satellites.
Patent Review
Citations
[1] NASA. State-of-the-Art of Small Spacecraft Technology: 9.0 communications. https://www.nasa.gov/smallsat-institute/sst-soa/soa-communications/
