Difference between revisions of "FemTech"
| Line 69: | Line 69: | ||
==Positioning of Company vs. Competition== | ==Positioning of Company vs. Competition== | ||
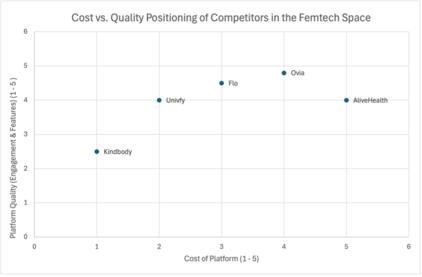
The figure below shows a comparative summary of digital health. In our analysis of our technology against competitors, we initially aimed to use specific FOMs such as Data Breach Rate (DBR) and Average Response Time (ART) to provide a direct comparison of performance metrics that are critical for users in the femtech space. However, after review, we found that DBR and ART metrics for our competitors are not readily available through public sources. Unlike cost and feature quality, which can be inferred from published data, user reviews, or pricing models, DBR and ART metrics are often proprietary, sensitive information that companies do not disclose openly. | The figure below shows a comparative summary of digital health market competitors. | ||
In our analysis of our technology against competitors, we initially aimed to use specific FOMs such as Data Breach Rate (DBR) and Average Response Time (ART) to provide a direct comparison of performance metrics that are critical for users in the femtech space. However, after review, we found that DBR and ART metrics for our competitors are not readily available through public sources. Unlike cost and feature quality, which can be inferred from published data, user reviews, or pricing models, DBR and ART metrics are often proprietary, sensitive information that companies do not disclose openly. | |||
Given these limitations, we are unable to reliably gather accurate data for these specific FOMs across our competitor landscape. Therefore, attempting to compare Babble to competitors using DBR and ART would involve too much speculation, potentially leading to misleading conclusions. | Given these limitations, we are unable to reliably gather accurate data for these specific FOMs across our competitor landscape. Therefore, attempting to compare Babble to competitors using DBR and ART would involve too much speculation, potentially leading to misleading conclusions. | ||
Revision as of 17:04, 5 November 2024
The FemTech (FT) market is a Level 1 roadmap, represents a rapidly expanding segment of the broader digital health market focused on Women's Health.Level 2 roadmaps focus on specific FemTech solutions, such as fertility tracking apps (Bable), menstrual cycle management platforms, pregnancy care, and menopause support technologies. Level 3 roadmaps delve into the subsystems within these solutions, including personalized health tracking algorithms, telehealth integration, and wearable device synchronization. Level 4 roadmaps focus on individual components such as data security measures, hormone monitoring sensors, and AI-driven health insights.
Technology Roadmap Overview
FemTech refers to a category of technology designed to address health issues for woman ranging from reproductive health and pregnancy to general wellness and chronic conditions. These technologies connect females with healthcare providers through digital platforms that track health data, offer personalized recommendations, and facilitate access to medical care. Starting with basic fertility and period tracking tools, FemTech has evolved into a sophisticated ecosystem, offering comprehensive solutions for female health at every life stage.
Today, FemTech solutions are focused on empowering females through data-driven insights, providing personalized healthcare experiences that are accessible inclusive, and responsive to individual needs. By integrating advanced technologies such as Artificial Intelligence, telemedicine, and wearable health devices, FemTech platforms are revolutionizing the way females manage their health.
DSM Allocation
OPM Model
Below, we provide an object-process diagram (OPD) of the IVF Digital Platform roadmap. This diagram captures the main object of the roadmap, its decomposition into subsystems, its characterization by Figures of Merit (FOMs), as well as the main processes and actors involved.
Figures of Merit
This table outlines the key metrics for evaluating the performance and effectiveness of IVF Digital Platforms.
| Figure of Merit (FOM) | Unit | Description |
|---|---|---|
| Net Promoter Score | 0-10 scale | Measure the average NPS from patients and healthcare providers using the fertility AI platform. |
| Authentication Success Rate | % | Percentage of successful logins without errors. |
| Appointment Scheduling | Minutes | Time saved by patients when booking appointments. |
| Patient Follow Up | Minutes | Time saved due to automated reminders and check-ins. |
| Time Writing Clinical Notes | Minutes | Average reductio in documentation time. |
| Data Integration | Hours | Reduction in time to ingest third party diagnostic/lab data. |
| System Downtime | Seconds | Time the system is down, impacting patient access. |
| A/B Testing of Success Rate | % | Success rate improvement over a 3-year period after implementation. |
Alignment with Company Strategic Drivers
Our software platform enhances patient support through fertility treatments by focusing on three key strategic drivers:
| # | Strategic Driver | Alignment and Targets |
|---|---|---|
| 1 | To create value for users by increasing productivity | - Net Promoter Score (NPS): Target an average NPS of 8 or higher from patients and healthcare providers, indicating strong satisfaction and perceived value of productivity enhancements.
- Authentication Success Rate: Achieve a 99% authentication success rate to ensure efficient, reliable user access, which supports productivity. - Appointment Scheduling: Reduce appointment scheduling time by 50%, streamlining productivity and easing patient experiences. - Patient Follow-Up: Target a 30% reduction in time spent on patient follow-ups through automated reminders and check-ins, helping users focus on essential tasks. |
| 2 | To ensure the quality and accuracy of the generated outputs that users can trust | - A/B Testing Success Rate: Improve success rate by 10% over 3 years through continuous A/B testing, refining algorithm accuracy and trustworthiness.
- Data Integration: Target 2 hours per week saved in data ingestion, making third-party lab and diagnostic data integration faster and more reliable. - System Downtime: Limit system downtime to 30 seconds per month, maintaining continuous, dependable access that supports reliability and trust. |
| 3 | To deliver a seamless user experience with robust compatibility for business clients, ensuring smooth integration with other systems. | - Appointment Scheduling: Achieve 95% compatibility with third-party scheduling systems, enhancing integration and ease of use.
- Data Integration: Reduce time spent on data integration tasks by 50% through improved interoperability with other systems. - System Downtime: Target 99.9% system uptime, allowing a stable experience for users interacting across platforms. |
Positioning of Company vs. Competition
The figure below shows a comparative summary of digital health market competitors.
In our analysis of our technology against competitors, we initially aimed to use specific FOMs such as Data Breach Rate (DBR) and Average Response Time (ART) to provide a direct comparison of performance metrics that are critical for users in the femtech space. However, after review, we found that DBR and ART metrics for our competitors are not readily available through public sources. Unlike cost and feature quality, which can be inferred from published data, user reviews, or pricing models, DBR and ART metrics are often proprietary, sensitive information that companies do not disclose openly.
Given these limitations, we are unable to reliably gather accurate data for these specific FOMs across our competitor landscape. Therefore, attempting to compare Babble to competitors using DBR and ART would involve too much speculation, potentially leading to misleading conclusions. Instead, we will focus on readily available and inferable metrics such as Cost vs. Quality. This comparison allows us to provide a meaningful and transparent analysis of how Bable stands against competitors in terms of the value proposition—the balance between the cost of the platform and the quality of features and engagement it offers. By focusing on Cost vs. Quality, we can use data that is more publicly accessible, consistent, and reliable, ultimately providing a clearer picture of our positioning in the femtech space
Technical Model
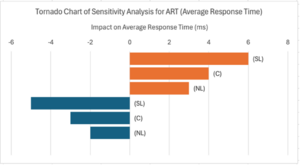
The tornado chart for ART highlights which variables have the most impact on the platform’s responsiveness. Based on our sensitivity analysis, the primary parameters influencing ART are System Load (SL), Server Capacity (C), and Network Latency (NL).The results show that:
- System Load (SL) has the highest impact on ART, indicating that as the number of concurrent users increases, response time can be significantly affected. This implies that managing server load efficiently, especially during peak usage times, will be crucial for maintaining optimal performance.
- Server Capacity (C) also plays a substantial role in reducing ART, suggesting that increasing server capacity or optimizing server allocation can enhance response efficiency.
- Network Latency (NL), while lower in impact compared to SL and C, still contributes to overall response delays. Minimizing latency by using faster network protocols or optimizing data routes can contribute to better user experience.
The primary takeaway is that managing system load is critical for maintaining fast response times, with server capacity also being a key leverage point. Investment in load balancing technologies and server scaling would therefore be prioritized for improving user satisfaction.
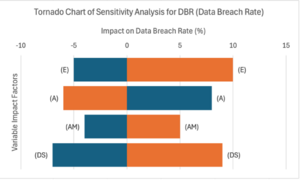
The tornado chart for DBR presents the sensitivity of data security concerning different variables, including Encryption Level (E), Access Frequency (A), Authentication Method (AM), and Data Storage (DS). The results indicate:
- Encryption Level (E) is the most sensitive factor affecting DBR, which means that stronger encryption protocols lead to a significantly reduced rate of data breaches. This reinforces the need for employing industry-standard encryption, such as AES-256, to protect sensitive user data.
- Access Frequency (A) also has a significant impact, where more frequent access points increase the risk of breaches. Implementing strategies to minimize exposure, such as limiting access to authorized users only or reducing unnecessary access frequency, is key.
- Authentication Method (AM) plays a pivotal role in enhancing security. Multi-Factor Authentication (MFA) is more effective in reducing DBR compared to single-factor methods.
- Data Storage (DS) impacts the risk depending on where and how data is stored. Utilizing encrypted cloud storage or secure on-premises databases can help mitigate risks associated with data breaches.
The analysis underscores the importance of using robust encryption and multi-factor authentication as primary defenses against data breaches. Additionally, limiting access frequency and securing storage can significantly improve the platform's security posture. This analysis can guide the prioritization of security measures to minimize breach risks effectively.
Based on the sensitivity analysis, it is evident that both performance (ART) and security (DBR) are influenced by distinct, yet interconnected factors. For ART, managing server capacity and load is critical to enhance the platform's responsiveness, while DBR is primarily determined by the robustness of encryption and access management protocols. These insights point towards an integrated approach to system optimization—where performance upgrades such as increased server capacity and load management should be complemented by security enhancements like improved encryption and access control to provide a reliable, secure experience for users.


