Difference between revisions of "Selective Laser Sintering"
| Line 47: | Line 47: | ||
The graphs below show the relationship between build rate and laser spot size. The graph on the left illustrates the effect of laser power, while the graph on the right highlights the differences in material properties. These graphs demonstrate that laser power and material properties have a significant impact on the build rate. Generally, a smaller laser spot size results in higher-quality 3D printing. Therefore, these graphs can be interpreted as a trade space between build speed and print quality, where the optimal point lies in the top-left corner. Increasing laser power or selecting appropriate materials can achieve high build speeds while maintaining high quality. | The graphs below show the relationship between build rate and laser spot size. The graph on the left illustrates the effect of laser power, while the graph on the right highlights the differences in material properties. These graphs demonstrate that laser power and material properties have a significant impact on the build rate. Generally, a smaller laser spot size results in higher-quality 3D printing. Therefore, these graphs can be interpreted as a trade space between build speed and print quality, where the optimal point lies in the top-left corner. Increasing laser power or selecting appropriate materials can achieve high build speeds while maintaining high quality. | ||
[[File: | [[File:Build_rate_vs_Laser_spot_size2.png|600x600px|frameless|center]] | ||
In addition, below are the results of the normalized sensitivity analysis for the build rate. Laser power has the largest impact on the build rate, as shown in the graph above. Specific heat capacity, melting temperature, density, and volumetric enthalpy are material properties. | In addition, below are the results of the normalized sensitivity analysis for the build rate. Laser power has the largest impact on the build rate, as shown in the graph above. Specific heat capacity, melting temperature, density, and volumetric enthalpy are material properties. | ||
Revision as of 06:02, 22 November 2024
Roadmap Overview
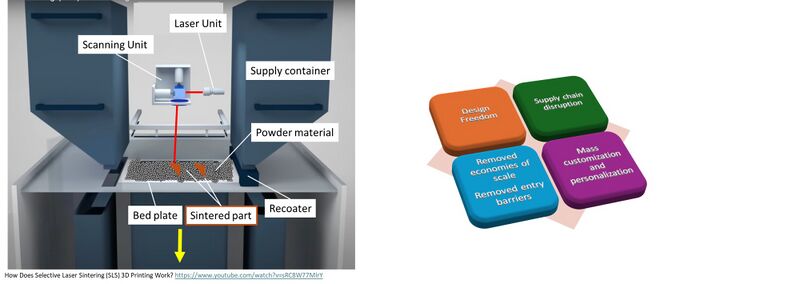
3D printing, or additive manufacturing, is a disruptive innovation transforming traditional manufacturing. Unlike subtractive methods, which remove material from a large block, 3D printing builds parts layer by layer, creating intricate designs previously impossible to manufacture. This technology has significantly reduced the time and complexity involved in assembly, allowing parts to be made on demand without sourcing from distant suppliers. By streamlining the prototyping process, 3D printing accelerates innovation and lowers costs, enhancing customer satisfaction and reducing product development waste. This technology has also changed cost structures in manufacturing by eliminating the need for large-scale, non-recurring investments in molds, tools, and setups. Industries such as aerospace, automotive, and healthcare have benefited from 3D printing's ability to produce lightweight, complex designs, like Pratt & Whitney's Geared Turbo Fan engine components and GE's 3D-printed fuel nozzles. With its potential to minimize waste and support sustainability, 3D printing continues to disrupt supply chains and enable mass customization across various sectors.
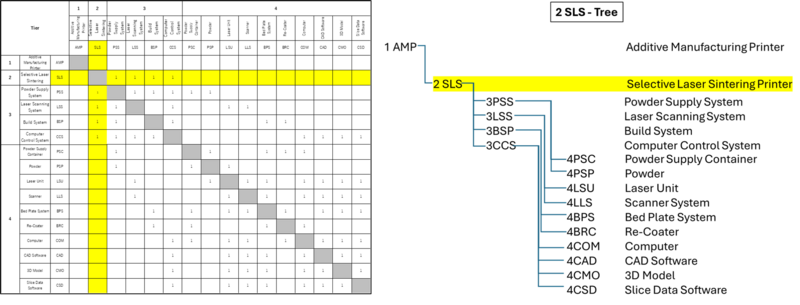
Design Structure Matrix (DSM) Allocation
Roadmap Model using OPM
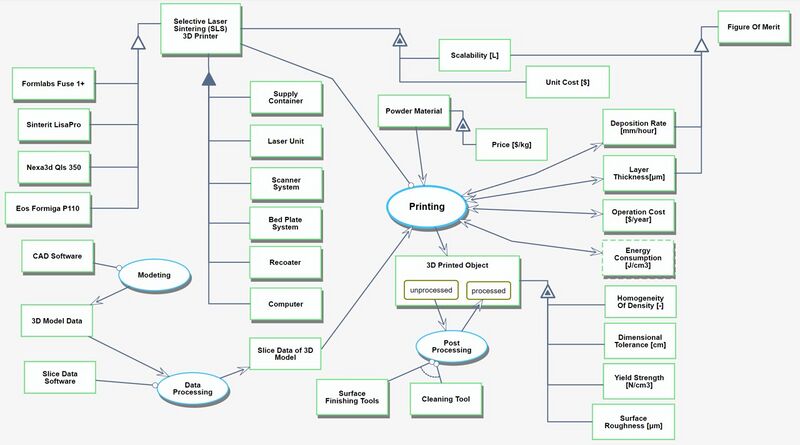
We provide an Object-Process-Diagram (OPD) of the 2SLS roadmap in the figure below (Fig.4-1). This diagram captures the main object of the roadmap (SLS 3D printing), its various instances that are famous in the industry, its decomposition into subsystems (laser unit, supply container, bed plate system …), its characterization by Figures of Merit (FOMs) as well as the main 3D printing processes (modeling, printing, post-processing).
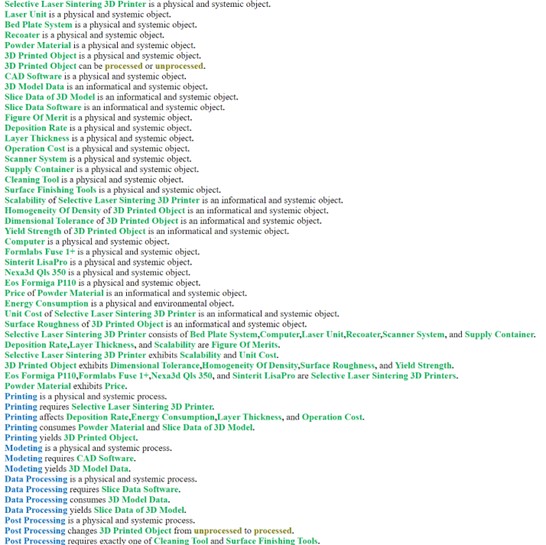
An Object-Process-Language (OPL) description of the roadmap scope is auto-generated and given below.
Figures of Merit
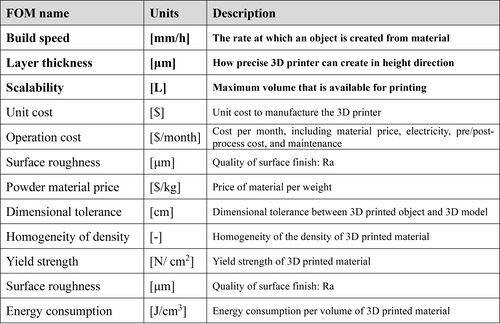
The below shows a list of FOMs by which SLS 3D printing can be assessed. Since we focus on applying this technology to industry, cost, time, and precision are critical factors.
Alignment with Company Strategic Drivers
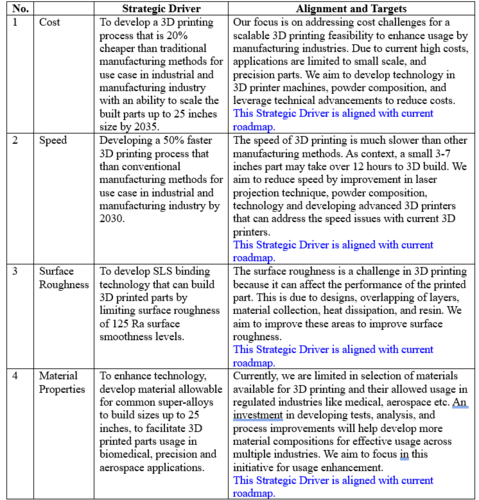
The table below shows an example of potential strategic drivers and alignment of the 2SLS technology roadmap with it.
Positioning of Company vs. Competition
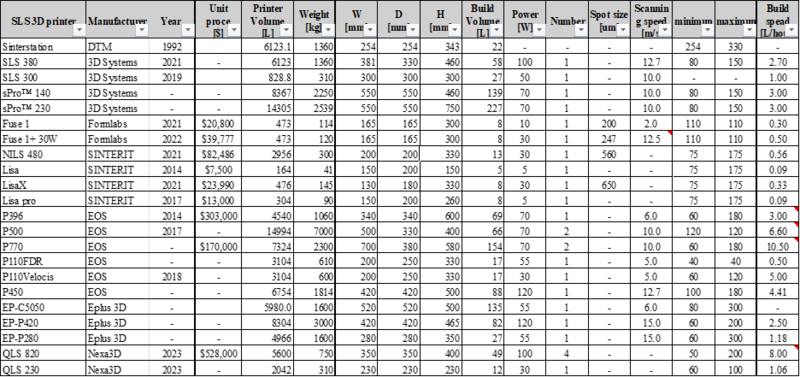
The table below compiles information on SLS 3D printers from leading 3D printer manufacturers. Confidential information has been left blank. The tradespace for unit cost and build speed, using valid data, is shown below.
Technical Model
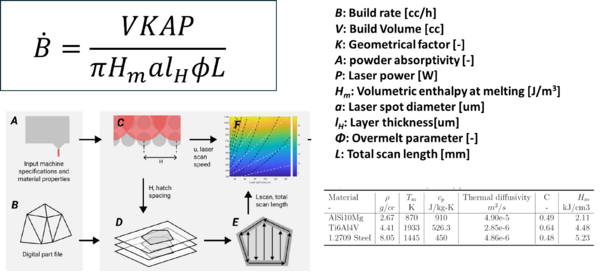
The build rate is a critical Figure of Merit (FOM) for the productivity of 3D printers. The technical model is shown below. If the laser parameter, material properties, and shape of 3D printed material are set, we can calculate the build speed of the SLS 3D printer.
The graphs below show the relationship between build rate and laser spot size. The graph on the left illustrates the effect of laser power, while the graph on the right highlights the differences in material properties. These graphs demonstrate that laser power and material properties have a significant impact on the build rate. Generally, a smaller laser spot size results in higher-quality 3D printing. Therefore, these graphs can be interpreted as a trade space between build speed and print quality, where the optimal point lies in the top-left corner. Increasing laser power or selecting appropriate materials can achieve high build speeds while maintaining high quality.
In addition, below are the results of the normalized sensitivity analysis for the build rate. Laser power has the largest impact on the build rate, as shown in the graph above. Specific heat capacity, melting temperature, density, and volumetric enthalpy are material properties.
Financial Model
List of R&T Projects and Prototypes
Key Publications, Presentations and Patents
The 3D printing patent technology has been evolving rapidly. With the addition of regular new patents, technology is improving daily across various applications and technologies. Many patents have significantly helped in multiple biomedical, aerospace, and manufacturing applications and technologies. The patent applications in 3D/ Additive Manufacturing are growing at an average rate of 26% between 2001 and 2020. This speed is much higher other areas in the technology sector. A search results over USPTO shows that, many leading companies with leading 3D printing patent numbers.
Some Leading Patent Holders are listed below. • GE Aerospace (1,500+ patents and pending applications) • RTX Corporation (1,400+ patents and pending applications) • HP Inc. (1,000+ patents and pending applications) • Stratasys Ltd. (450+ patents and pending applications) • 3D Systems (400+ patents and pending applications)
The 3D printing Notable Recent Patents are: • HP's patents related to Multi Jet Fusion and Metal Jet technologies • 3D Systems' patents for "Thiol-Ene Inks for 3D Printing" and "Non-Isocyanate Polyurethane Inks for 3D Printing" • Boeing's patent for a platform combining levitated parts, multiple build heads, and variable orientations
Emerging Technologies with patents include patents related to 1) volumetric 3D printing, 2) for composite materials in 3D printing and 3) patents for quality assurance and online monitoring in metal 3D printing.
The early Fundamental Patents in 3D printing started with 3D Systems, which holds some of the earliest and most fundamental patents in 3D printing technology, including Chuck Hull's U.S. Patent No. 4,575,330 for stereolithography.
Chuck Hull's Stereolithography Patent, U.S. Patent No. 4,575,330 https://patents.google.com/patent/US4575330A/en One of the foundational patents in 3D printing technology is Scott Crump's Fused Deposition Modeling (FDM) Patent.
Scott Crump's Fused Deposition Modeling (FDM) Patent, U.S. Patent No. 5,121,329 https://patents.google.com/patent/US5121329A/en
On Composite 3D Printing Patent, Northrop Grumman's Composite 3D Printing Patent. Northrop Grumman's Composite 3D Printing Patent: "Device and Method for 3D Printing with Long-Fiber Reinforcement" https://patents.google.com/patent/US20170144224A1/en
