Difference between revisions of "Digital Twin Technology"
| Line 66: | Line 66: | ||
=== Roadmap Images === | === Roadmap Images === | ||
[[File:Roadmap_of_Digital_Twin_OPM.png | [[File:Roadmap_of_Digital_Twin_OPM.png|800px|none]] | ||
[[File:Roadmap_of_Digital_Twin_OPL_1.png | [[File:Roadmap_of_Digital_Twin_OPL_1.png|800px|none]] | ||
[[File:Roadmap_of_Digital_Twin_OPL_2.png | [[File:Roadmap_of_Digital_Twin_OPL_2.png|800px|none]] | ||
[[File:Roadmap_of_Digital_Twin_OPL_3.png | [[File:Roadmap_of_Digital_Twin_OPL_3.png|800px|none]] | ||
== Figure of Merit (FOM) Section == | == Figure of Merit (FOM) Section == | ||
Revision as of 16:03, 3 December 2024
Technology Roadmap Sections and Deliverables
Our technology roadmap identifier is shown as:
- 2DTT - Digital Twin Technology
This identifier represents a Level 2 technology roadmap focused on product-level aspects of Digital Twin Technology. The roadmap is segmented into various tiers, with each level becoming more granular and specific as it progresses.
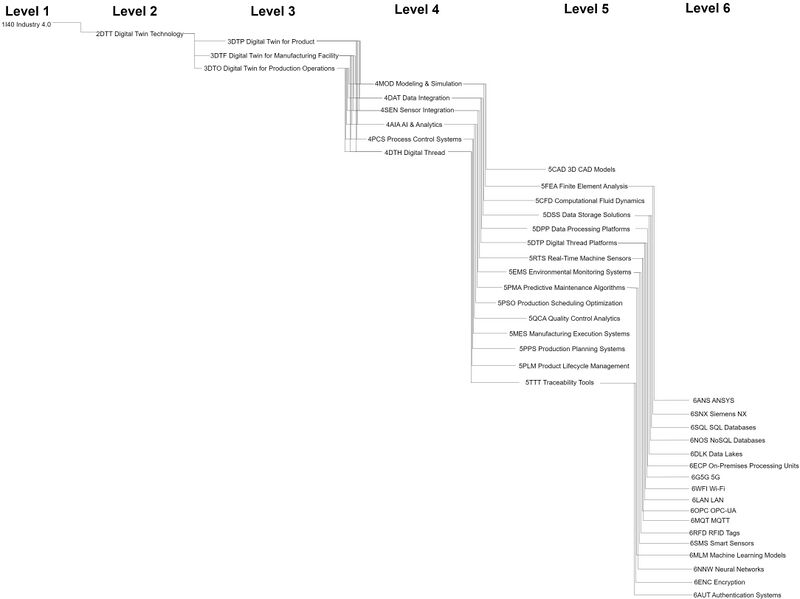
Level 1 (Market Level):
- It focuses on the broader market context for Embraer to revolutionize its manufacturing facilities, primarily focusing on Industry 4.0.
- The market demands, and technological trends that drive the need for Digital Twin solutions are addressed here.
Level 2 (Product/Technology Level):
- This is the product or overarching technology level, dealing with the general 2DTT Digital Twin Technology and its strategic significance to industry needs.
- Level 2 encompasses the overall architecture and essential components of Digital Twin, such as Physical Technology Integration and Smart Industry Platforms.
Level 3 (System/Facility Level):
- The roadmap breaks down into system-level components where the Digital Twin is implemented across specific systems or facilities.
- Key areas covered include technology implementation in product, facility, and operations. Level 3 covers end-to-end integration and system-level optimization.
Level 4 (Subsystem Level):
- At this level, the subsystems and digital enablers are detailed, such as Modeling & Simulation, Sensor Integration, CAD Data Integration, AI & Analytics, Process Control Systems, and Digital Threads.
- Level 4 subsystems are pivotal in effectively deploying Digital Twins across different environments.
Level 5 (Component Level):
- The roadmap moves to specific components like Edge Units, Real-Time Monitoring Sensors, Data Storage Structures, Predictive Maintenance Algorithms, and Quality Control Analysis.
- Level 5 components ensure the robust performance of digital twin models by continuously feeding real-time data and predictive insights into the system.
Level 6 (Technology or Tool Level):
- Finally, at the most granular level, individual technologies or tools such as AI/ML Models, Encryption Mechanisms, Authentication Systems, and Digital Twins Interoperability Tools are addressed.
- Level 6 elements ensure that the Digital Twin systems are secure, scalable, and integrated with other enterprise systems.
Roadmap Overview
Implementing a digital twin in Embraer’s aircraft manufacturing facility is an essential step towards realizing Industry 4.0, characterized as the Embraer 4.0 strategy by 2030. The field of Digital Engineering defines Digital Twin as a virtual representation of physical assets, processes, systems, or products that serve as a real-time representation throughout the system development lifecycle. The Aircraft Manufacturing Facility’s Digital Twin is a seamless integration of Data Handling, System Integration, Modeling, Simulation, and Digital Thread Implementation.
As per Embraer's Digital Twin strategy, defined by the Industry 4.0 Vertical Team, it primarily addresses three critical challenges:
- a) Infrastructure
- b) Business Processes
- c) Digital Thread
In addition, the successful realization of Digital Twin also encompasses:
- i) Establishing robust system integration
- ii) Optimizing data storage
- iii) Processing capacities
- iv) Evaluating ROI
- v) Managing transformative changes
The Digital Twin Strategy is intended not to be realized in a vacuum but well integrated with other ongoing Digital/AI Transformation efforts. This includes 'Generative AI models which will play an essential role in enabling Digital Twins to simulate and optimize manufacturing processes, adapt to unforeseen scenarios, and generate innovative solutions.
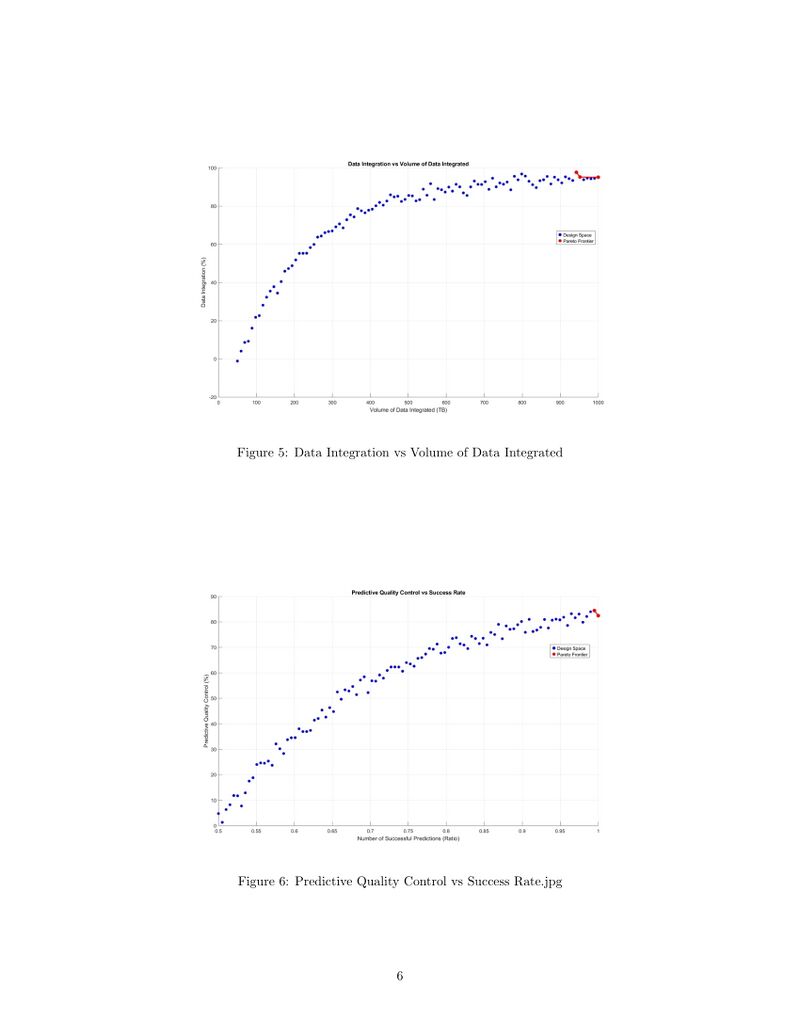
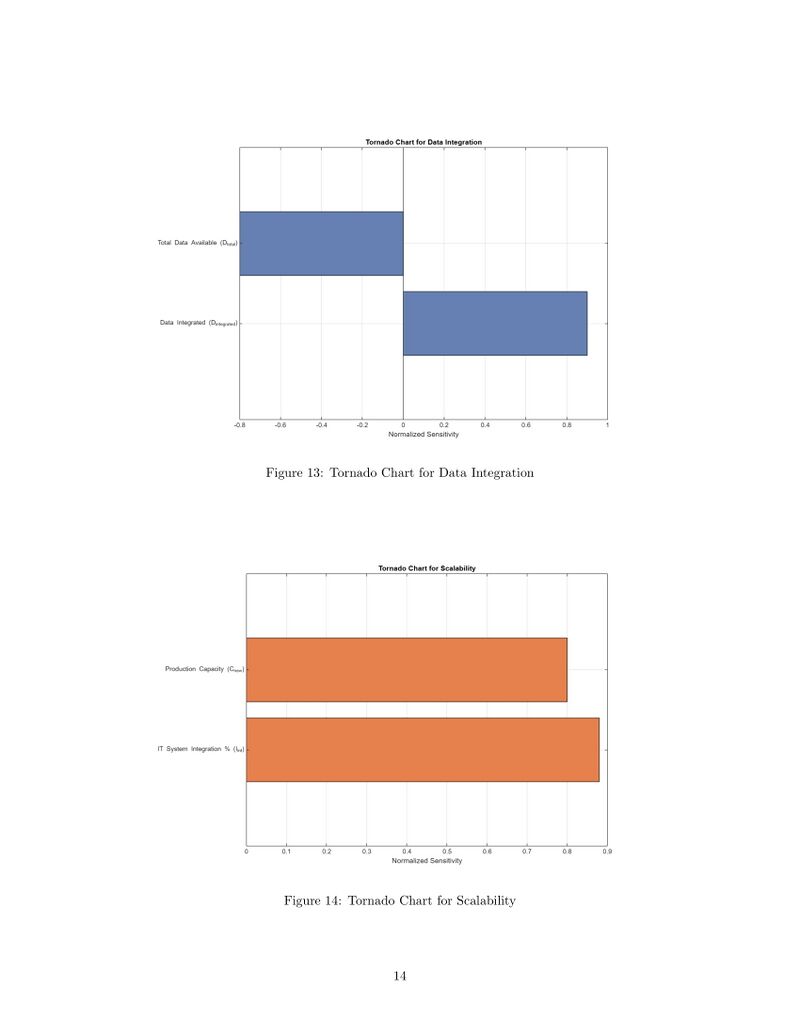
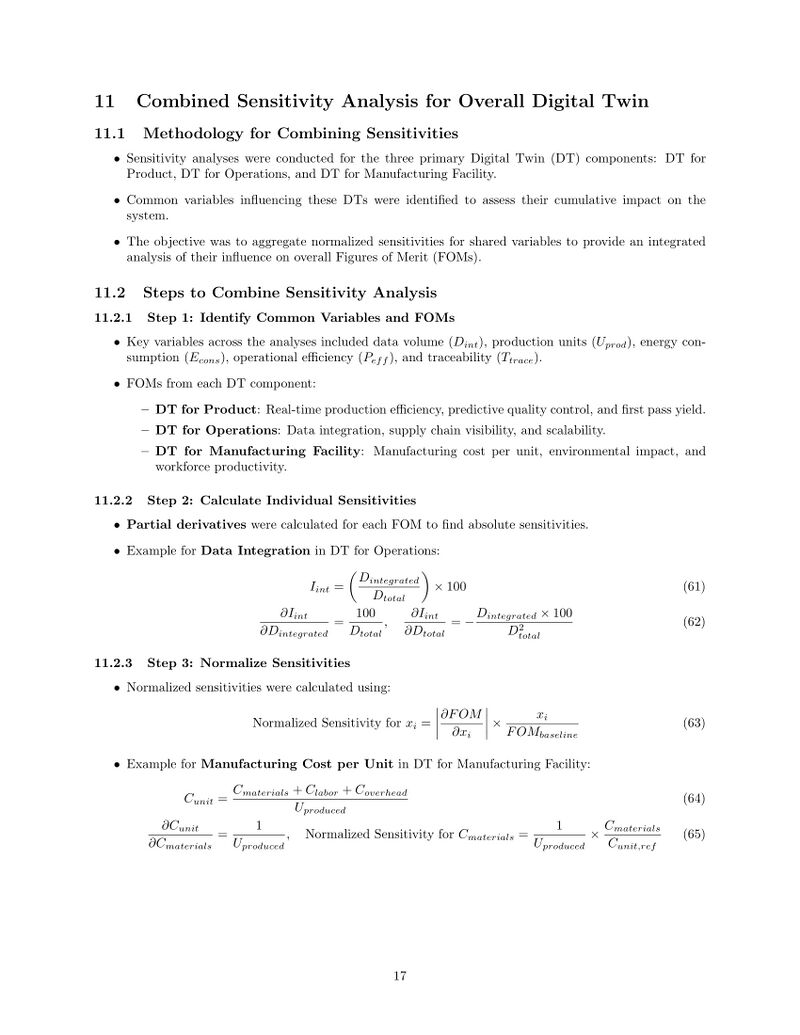
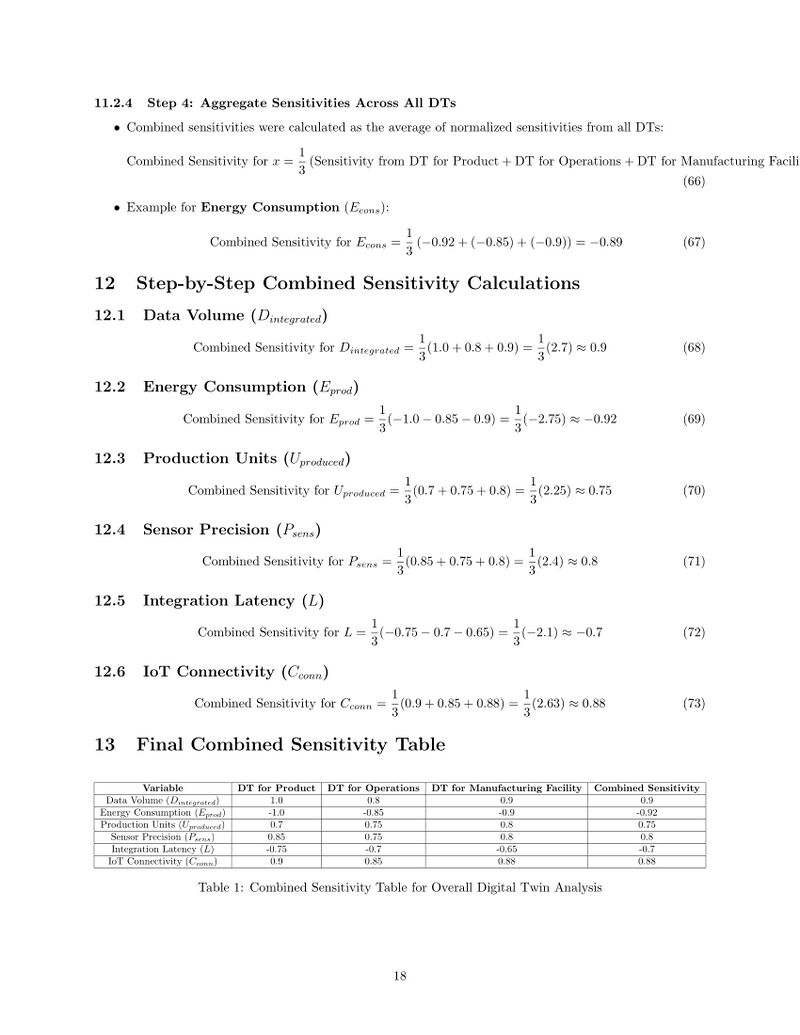
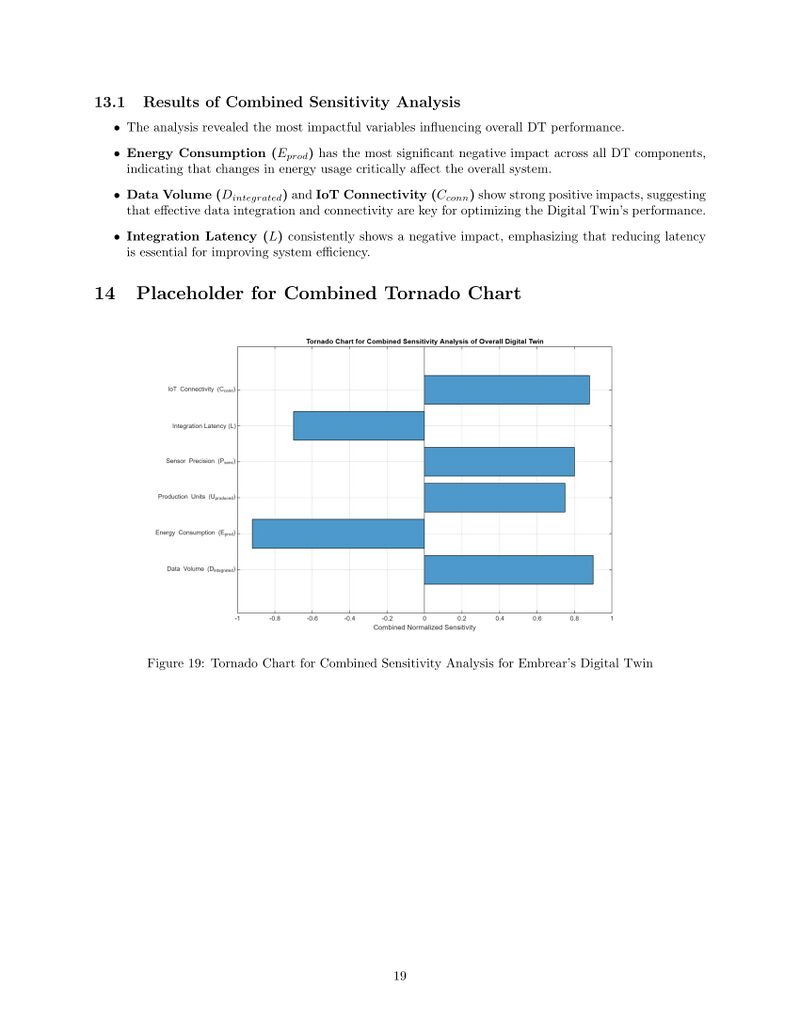
The diagram Progress of Digital Twin Technology from 1943 to 2024 illustrates how Digital Twin has evolved over the years regarding its capability to integrate available data for specific complex systems. Historical events have been used as Data points to illustrate the critical milestones in Ditial Twin, incorporating technologies such as Neural Networks, Computer Aided Engineering (CAE), Computer-Aided Design (CAD), and Cognitive Learning capabilities. The evolution graph uses Data Integration Equation to track the progression of capability development of Digital Twin, with each historical milestone appearing to mark an increase in data integration.
Design Structure Matrix (DSM) Allocation
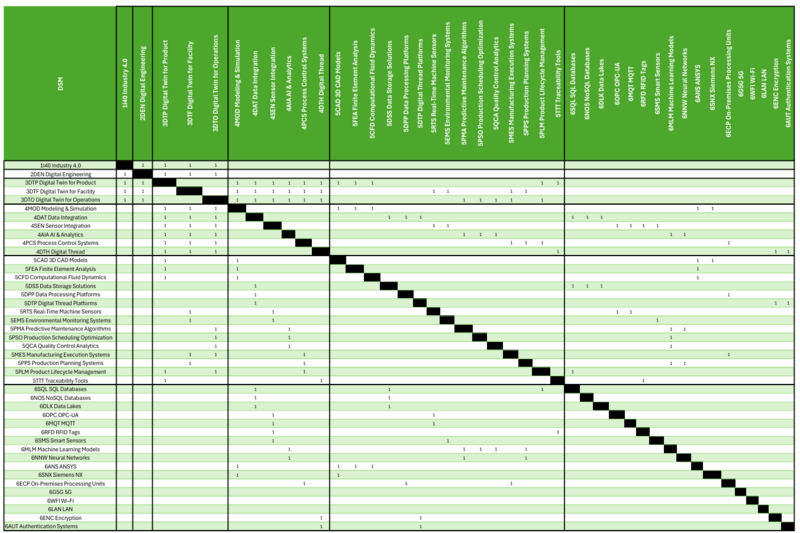
The above 2DTT Digital Twin Technology decomposition and Design Structure Matrix (DSM) visualize the complex layers of technology integration essential for next-generation systems. Starting at 1I40 Industry 4.0, the framework trickles down through key enablers like 2DEN Digital Engineering and 3DTF Digital Twin for Facilities, connecting all the way to component-level technologies such as 4MOD Modeling & Simulation, 4SEN Sensor Integration, and 5PMA Predictive Maintenance Algorithms. These lower-level elements at levels 4 and 5 don't operate in silos, and their interdependencies within the DSM reveal a dynamic, real-time interplay that facilitates continuous system optimization. By illustrating the interaction between subsystems like 4PCS Process Control Systems and 5DPP Data Processing Platforms, the matrix demonstrates how each layer contributes to the holistic advancement of digital twins—from high-level frameworks to operational intelligence. As data integration reaches new heights, the DSM paves the way for intelligent, adaptive systems that drive scalability, efficiency, and innovation, establishing the Digital Twin as the linchpin of future industrial transformation.
Roadmap of Digital Twin Technology OPM
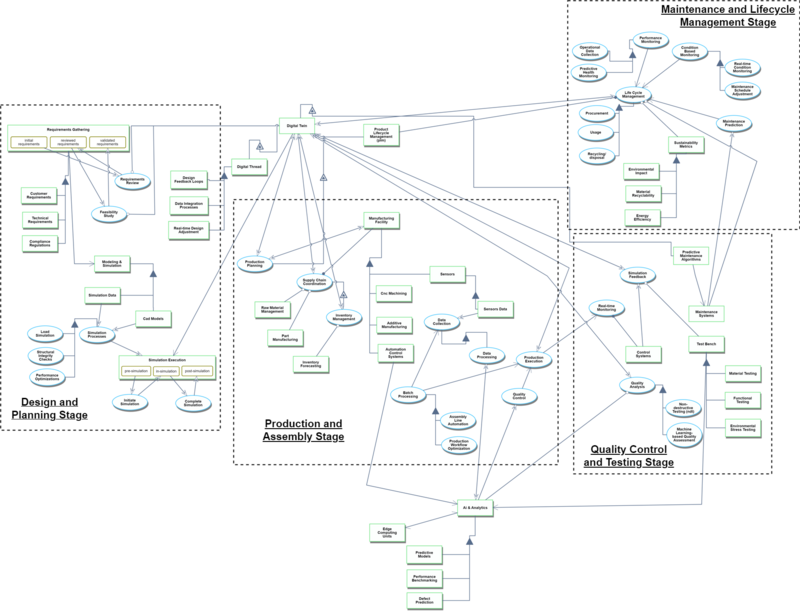
The Digital Twin roadmap outlines a comprehensive flow across multiple lifecycle stages, incorporating the design and planning, production and assembly, quality control and testing, and maintenance and lifecycle management stages. At the core is the Digital Twin, which integrates data from sensors and real-time monitoring systems to simulate, optimize, and adjust virtual models of aircraft products, manufacturing facilities, and operational systems. Through the Digital Thread, a continuous feedback loop is maintained, connecting the aircraft's design, production, and operational performance. The roadmap includes processes such as Data Collection, Simulation Execution, Predictive Maintenance, Quality Control, and Lifecycle Monitoring, ensuring that the digital and physical realms are synchronized for efficient production, real-time operational adjustments, and sustainable lifecycle management. Advanced AI Analytics and Predictive Algorithms enhance the system's ability to monitor and predict outcomes, while interdependencies between the Supply Chain, Manufacturing Process, and Product Design are continuously optimized for enhanced productivity, scalability, and environmental sustainability. This approach ensures a seamless integration of all stages, enabling precise decision-making and high operational efficiency.
Roadmap Images
Figure of Merit (FOM) Section
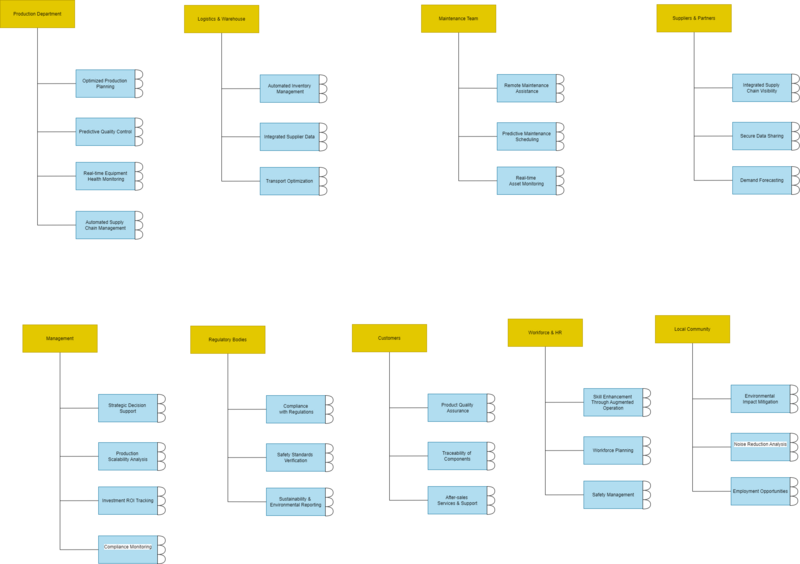
We began by identifying key stakeholders who have a direct or indirect impact on the Digital Twin system, as well as those who rely on its performance. This included departments such as production, logistics, IT systems, management, regulatory bodies, customers, and the workforce. For each stakeholder, we conducted a thorough needs analysis to determine their core requirements. For instance, the production department required high efficiency and cost control, while the workforce and HR emphasized safety and productivity improvements. This stakeholder mapping helped us clarify both the fundamental and aspirational goals of each group, ensuring that the Digital Twin technology aligns with their expectations.
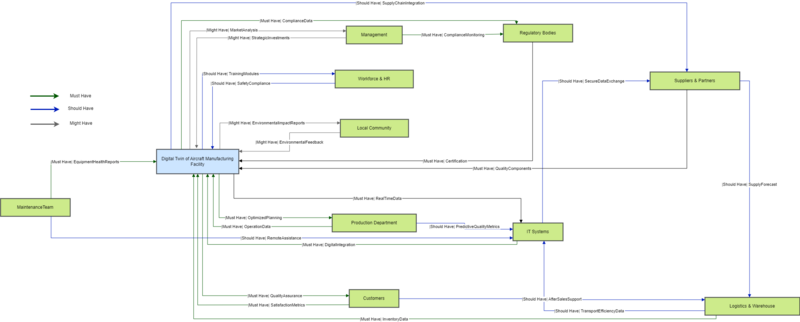
To further refine our understanding, we conducted a Stakeholder Value Network (SVN) analysis. In this phase, we mapped out relationships between stakeholders and defined the critical goals (Must Have), important requirements (Should Have), and aspirational excellence (Might Have). For example, Must Have included critical components like equipment health reports for the maintenance team and supply chain visibility for logistics. Should Have requirements focused on optimization goals such as predictive quality metrics and secure data exchange between suppliers. Might Have items were considered performance enhancements, such as advanced environmental feedback and long-term investment insights for management. This analysis provided a structured approach to prioritizing stakeholder needs in line with both operational and strategic objectives.
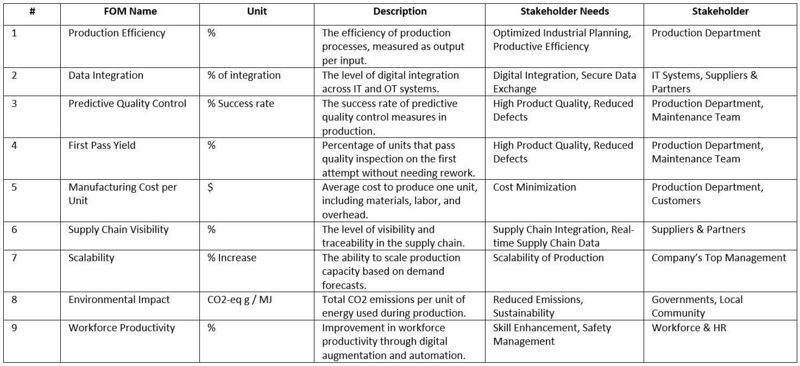
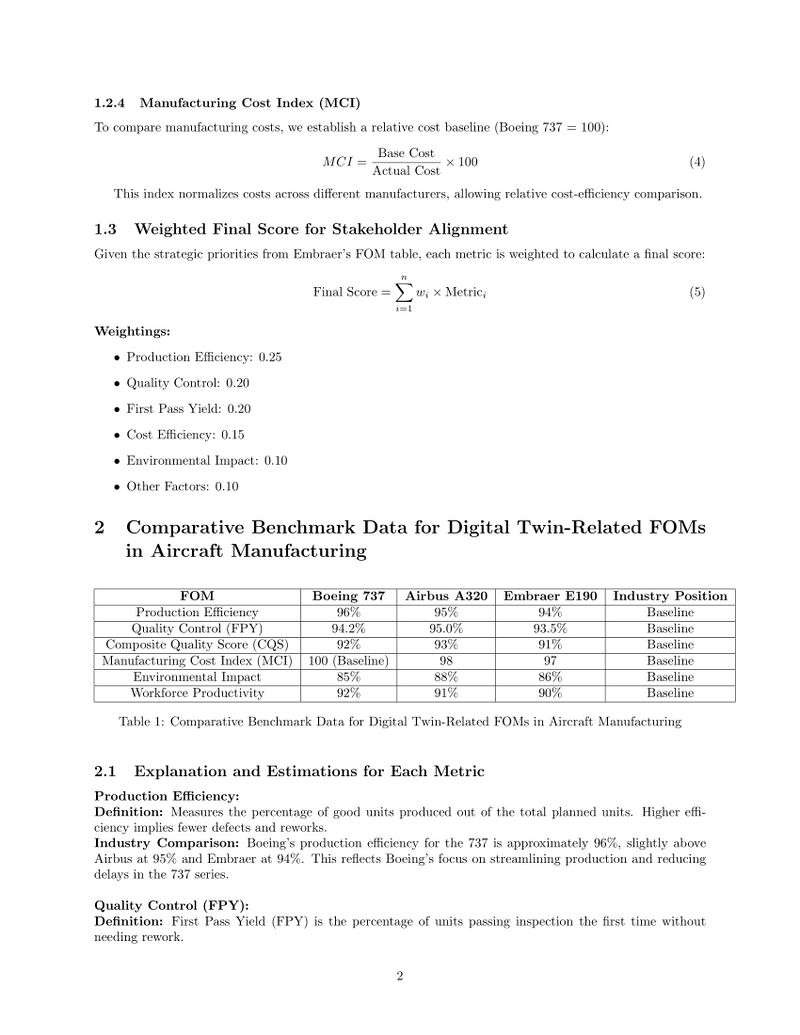
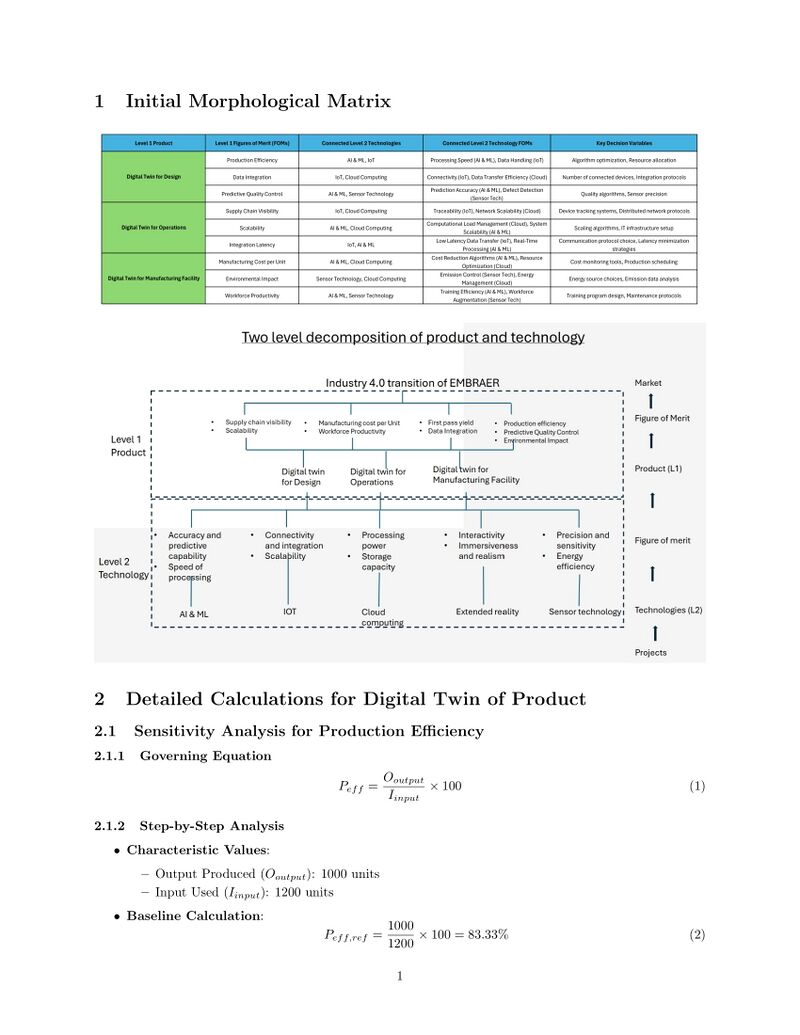
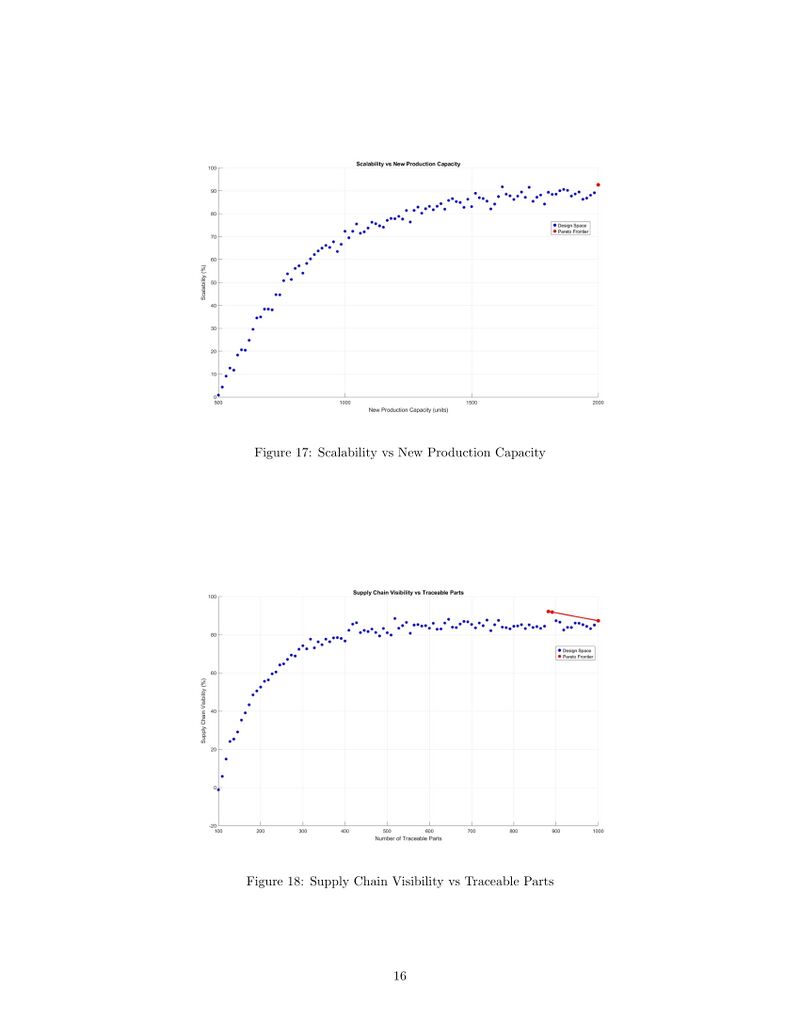
Using the stakeholder needs and goals derived from the SVN analysis, we developed a set of Figures of Merit (FOMs) to address these requirements quantitatively. Each FOM was designed to evaluate the performance of the system in a way that directly aligns with the needs of the stakeholders. For example, Production Efficiency was created to measure how well the manufacturing process optimizes output per input, directly addressing the production department's need for cost-effective operations. Similarly, Supply Chain Visibility measured how well the system tracks parts and inventory throughout the production process, aligning with logistics and warehouse goals. These FOMs ensured that every stakeholder's critical needs were measurable and improvable within the Digital Twin framework.
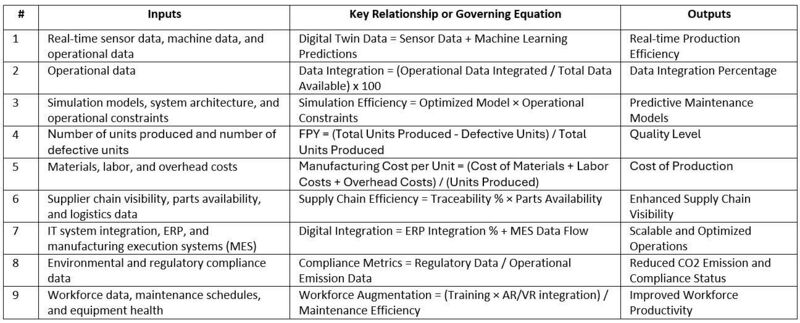
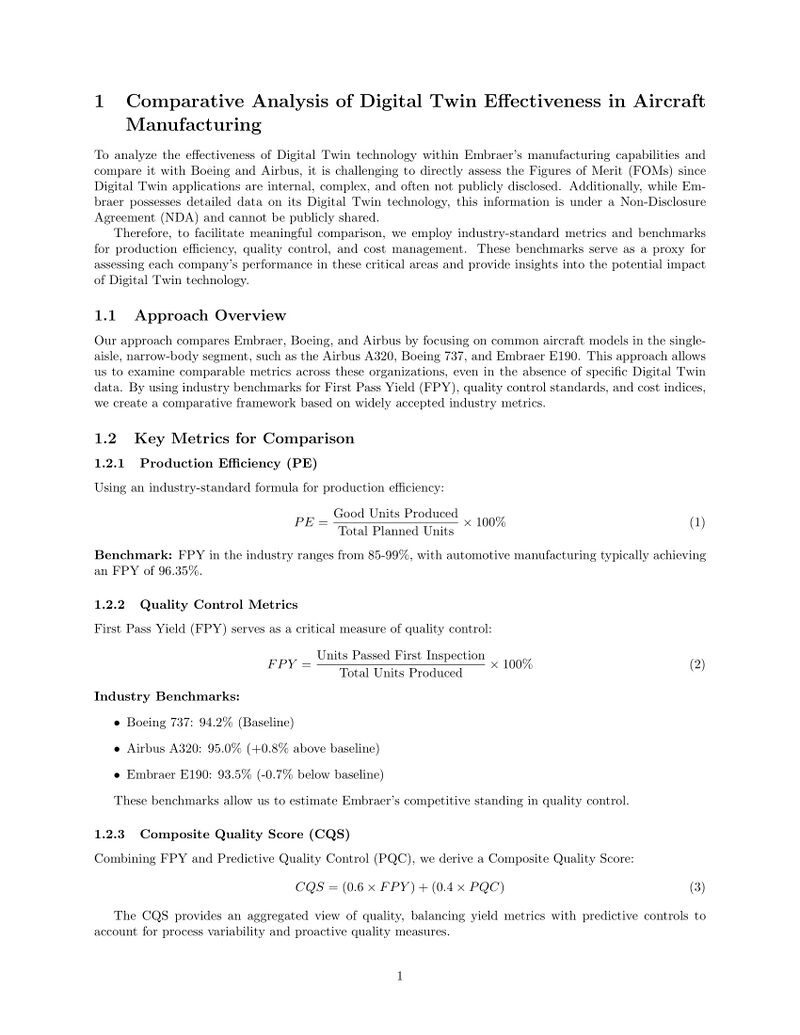
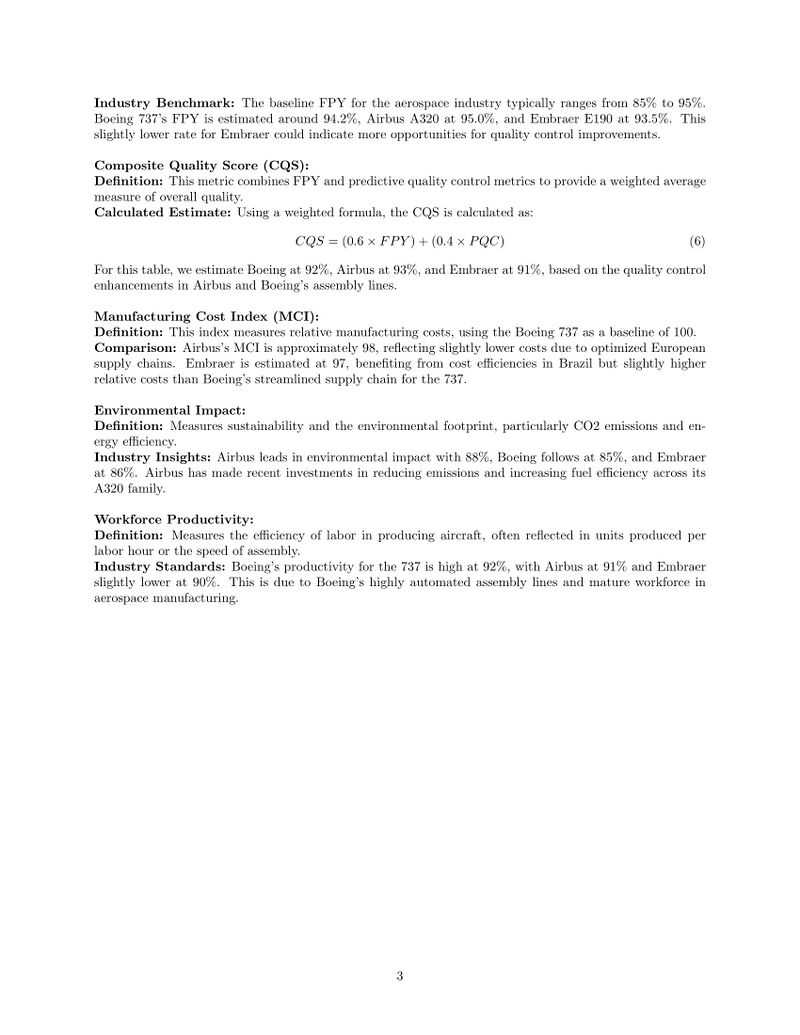
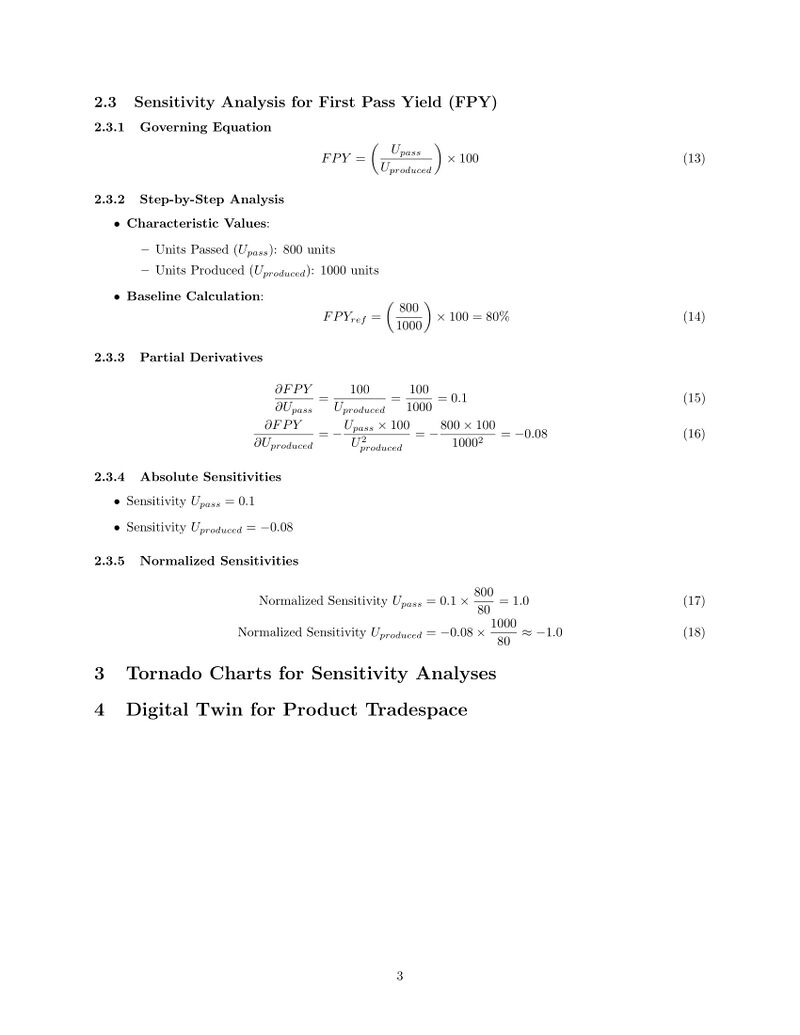
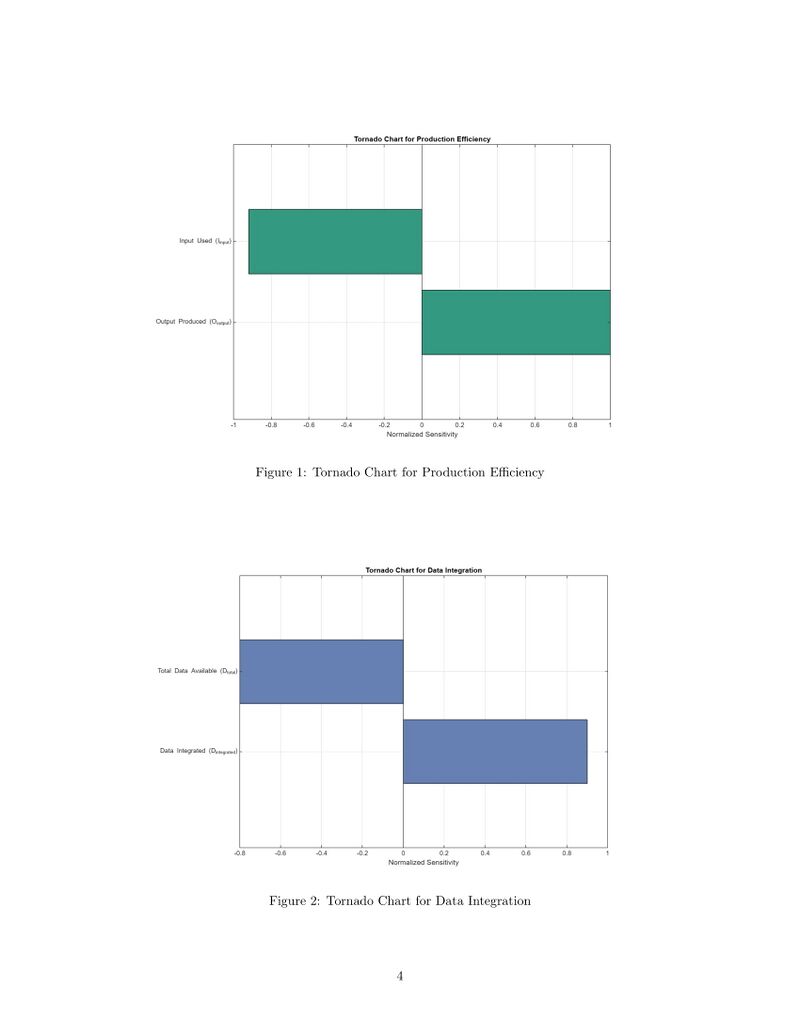
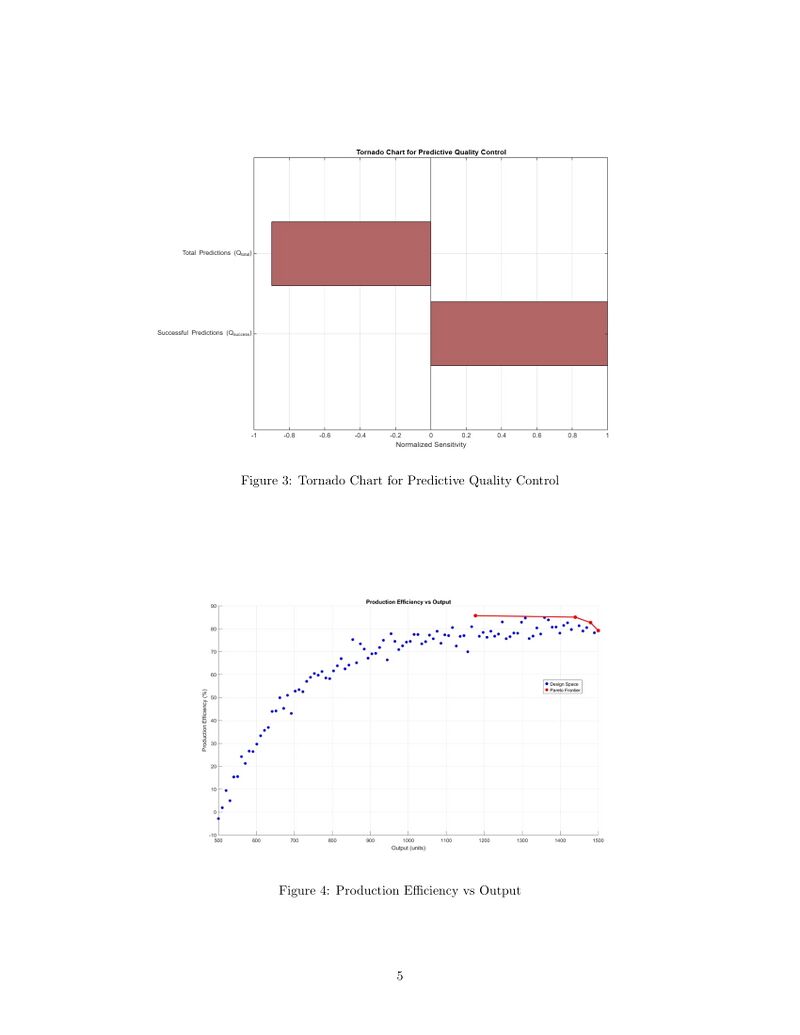
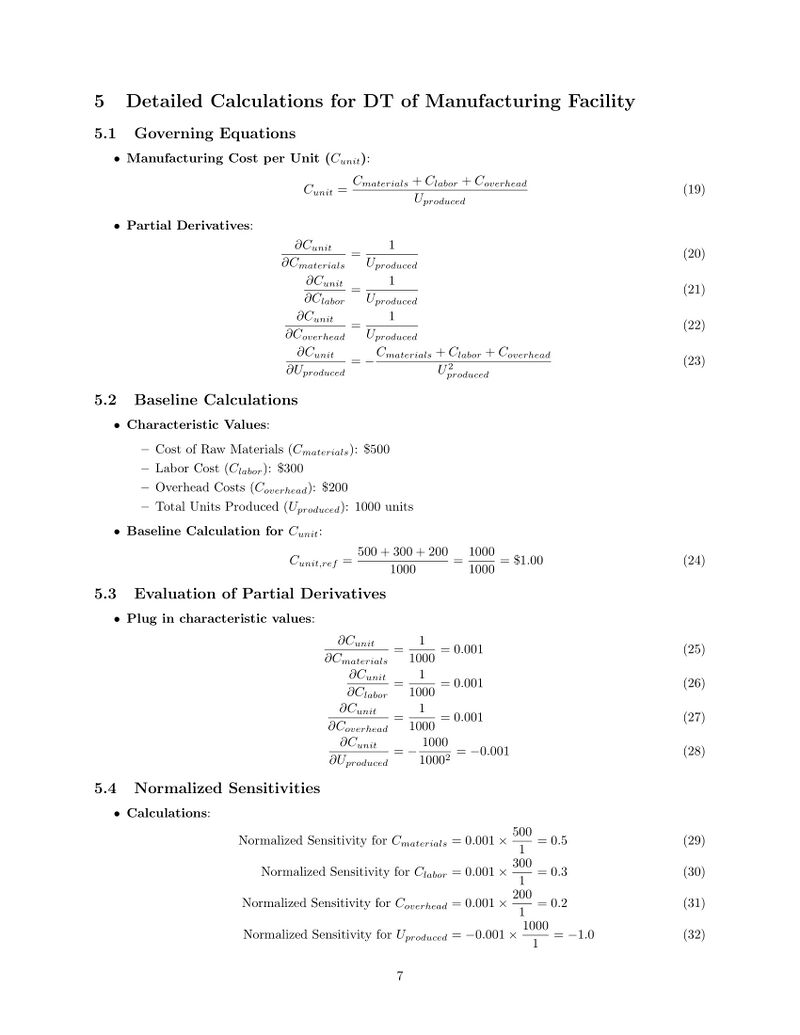
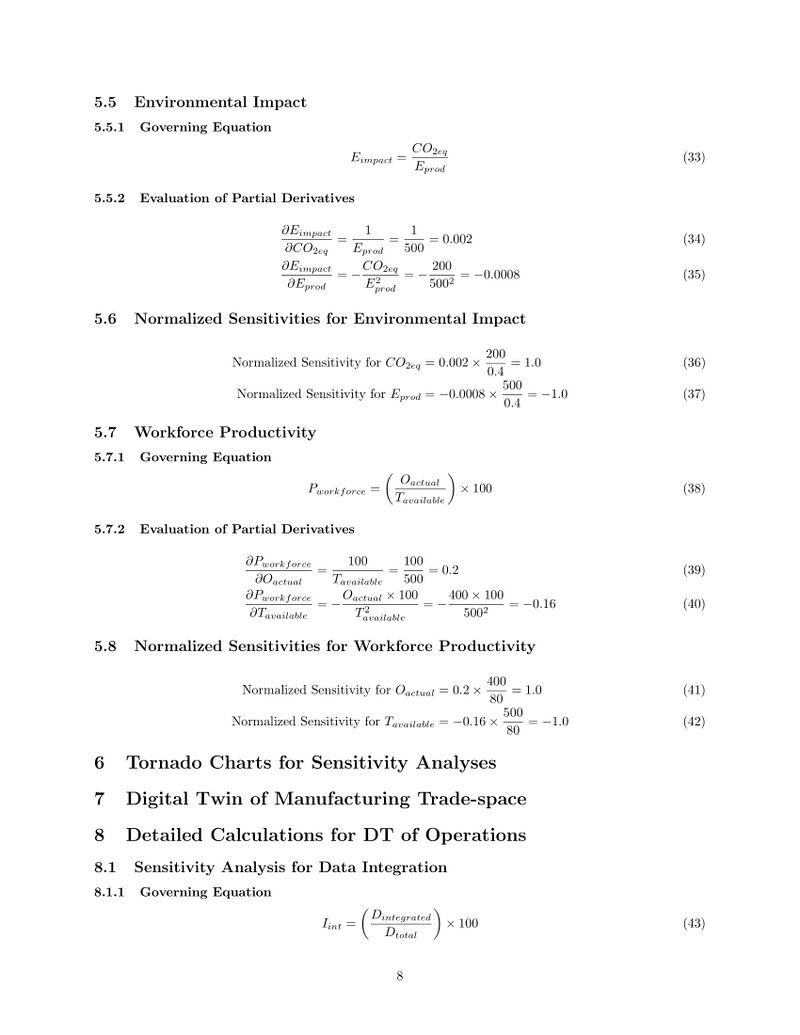
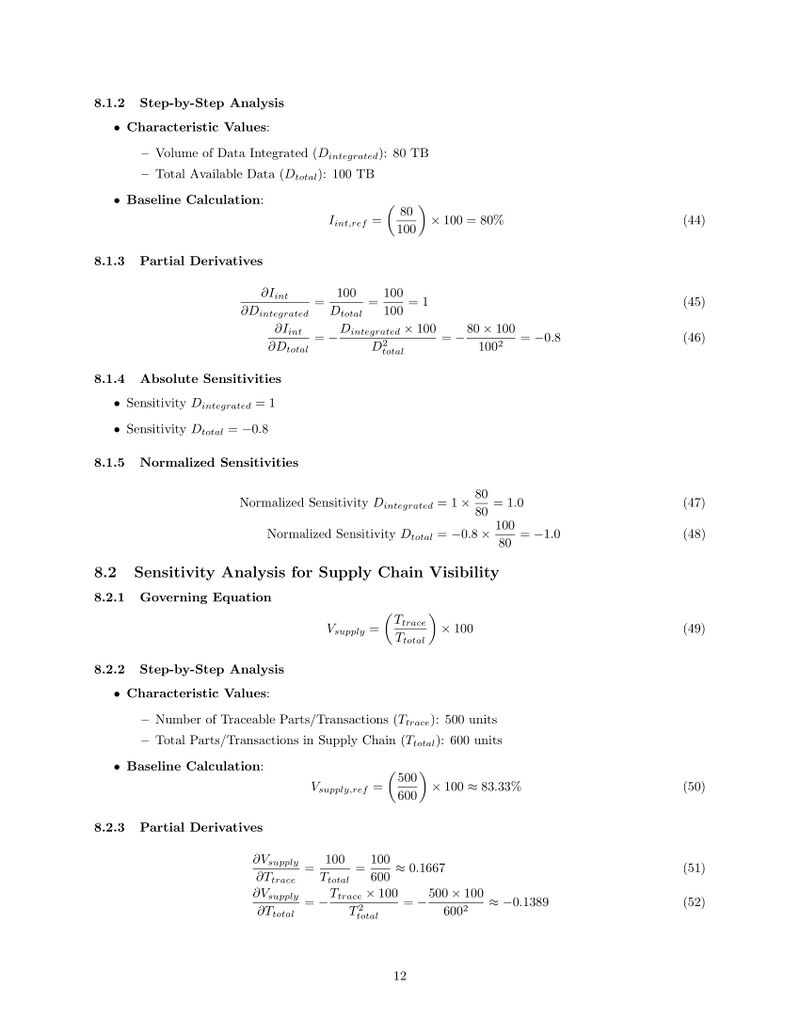
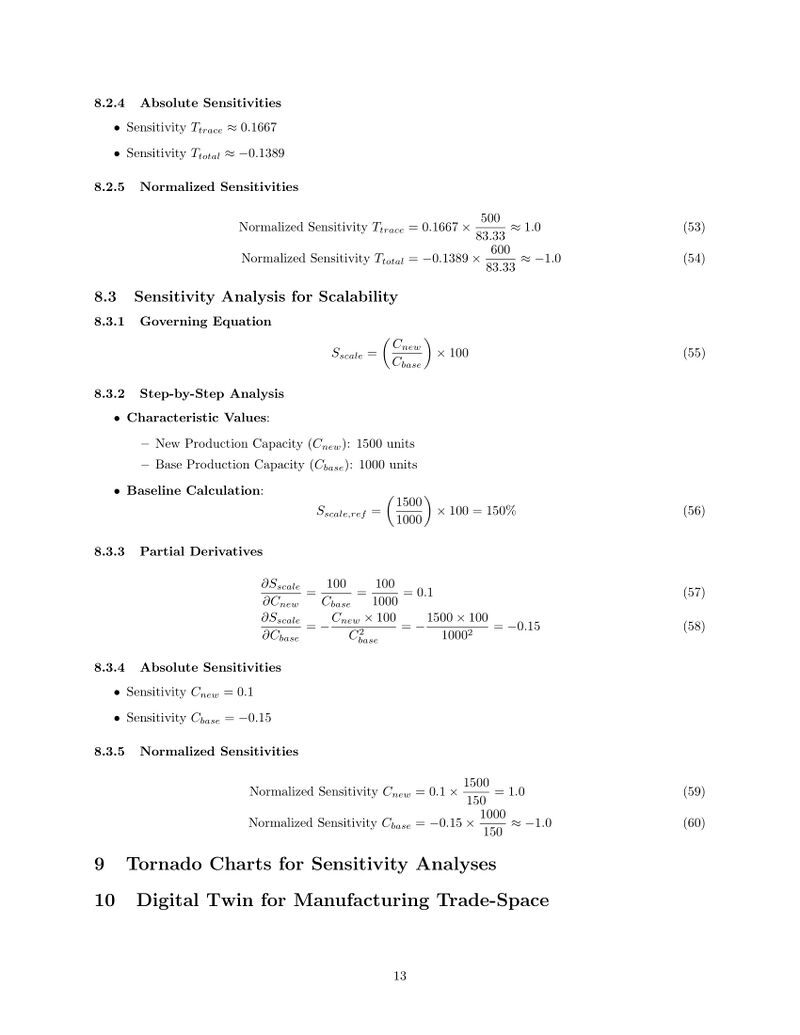
After defining the FOMs, we focused on developing the key governing equations that could quantify each metric. These equations helped us translate stakeholder needs into mathematical formulas that could be tracked and optimized in the Digital Twin system. For example, Production Efficiency was calculated using real-time sensor data, machine learning predictions, and operational output data. First Pass Yield (FPY) was derived from the total number of units produced versus defective units, reflecting quality control measures. Each governing equation ensured that our FOMs were not only measurable but also provided actionable insights into system performance, enabling continuous optimization and alignment with stakeholder needs.
Alignment with Company Strategic Driver
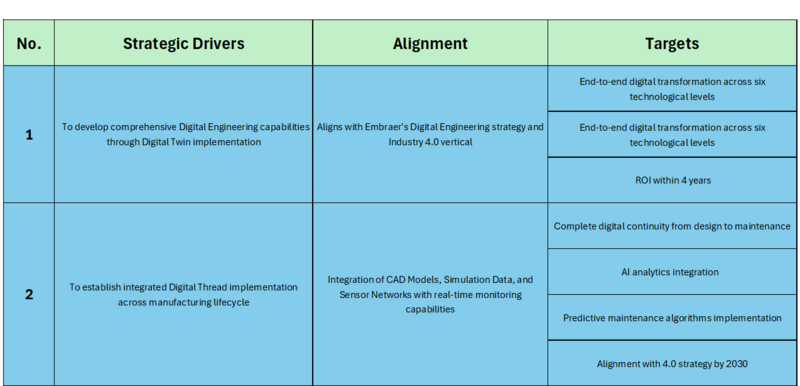
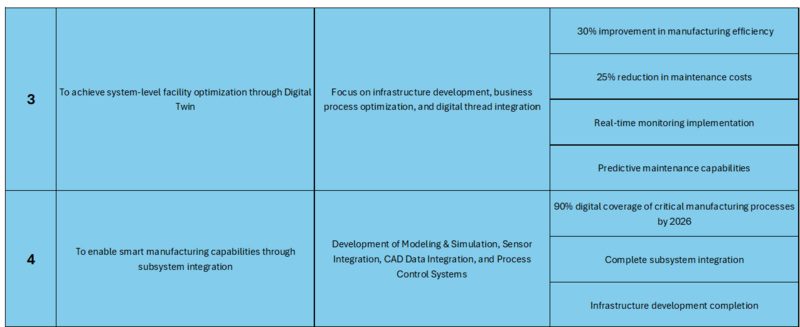
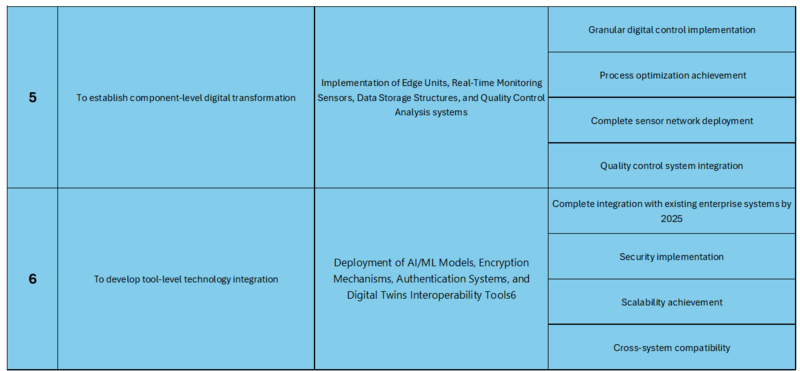
The table illustrates the strategic alignment of Embraer's Digital Twin implementation with key objectives. The first strategic driver focuses on developing Digital Engineering capabilities, aligning with Embraer’s Digital Engineering strategy and Industry 4.0 goals. The targets include achieving end-to-end digital transformation across six technological levels and realizing ROI within four years. The second driver emphasizes the establishment of an integrated Digital Thread across the manufacturing lifecycle, aligning through CAD models, simulation data, and real-time monitoring capabilities. This driver aims to achieve digital continuity from design to maintenance, AI analytics integration, and predictive maintenance by 2030. The third driver targets system-level optimization through infrastructure enhancement and business process improvements, aiming for a 30% efficiency increase, 25% cost reduction in maintenance, and real-time monitoring. The fourth driver supports smart manufacturing through subsystem integration, targeting 90% digital coverage of critical processes by 2026. The fifth driver focuses on component-level digital transformation, aiming for granular digital control, process optimization, and complete sensor network deployment. Lastly, the sixth driver aims to integrate AI/ML models, encryption, and interoperability tools at the tool level, targeting enterprise-wide integration, security, scalability, and cross-system compatibility by 2025.
Positioning of Company vs. Competition
Technical Model
Key Publications and Patents
Key Publication #1: US Patent Application Publication
- Patent #: US 2017/0286572 A1
- Publication Date: Oct 5, 2017
- Patent Name: DIGITAL TWIN OF TWINNED PHYSICAL SYSTEM
- Applicant(s): General Electric Company
- Inventor(s): John Erik Hershey, Frederick Wilson Wheeler, Matthew Christian Nielsen, Christopher Donald Johnson, Michael Joseph Dell'Anno, Joij Joykutti
- U.S. classification codes: G06F 17/5009 (2013.01); G06F 17/18 (2013.01)
- Description and Relevancy: The patent describes a system and method for implementing a "digital twin" of a physical system (electro-mechanical system). The digital twin uses sensor data and computer modeling to monitor and assess the condition of the physical system, predicting its remaining useful life (RUL). This system allows for real-time monitoring and prognosis of various parameters, even when the physical system is not operational, aiming to enhance efficiency, reduce downtime, and optimize maintenance schedules.
Key Publication #2: US Patent Application Publication
- Patent #: US 2022/0237532 A1
- Publication Date: Jul 28, 2022
- Patent Name: SYSTEM AND METHOD FOR MODELLING AND MONITORING PROCESSES IN ORGANIZATIONS USING DIGITAL TWINS
- Applicant(s): Sameer Phadke
- Inventor(s): Sameer Phadke
- U.S. classification codes: G06Q 10/067 (2013.01); G06Q 10/0637 (2013.01)
- Description and Relevancy: The patent relates to modeling business processes, deploying these models to run as a digital twin of the processes, and using these digital twins for monitoring the business processes. The present invention relates to a plurality of such digital twins representing the digital twin part of an organization or of the entire organization. The system and method advantageously enable configuration, deployment, and running of digital twins of business processes quickly and with less effort.
Key Publication #3: US Patent Application Publication
- Patent #: US 2022/0137585 A1
- Publication Date: May 5, 2022
- Patent Name: ENGINEERING BASED DIGITAL TWIN PLATFORM
- Applicant(s): Simularge Bilisim ve Mühendislik Teknolojileri Anonim Sirketi, Istanbul
- Inventor(s): Büryan Turan, Erhan Turan
- U.S. classification codes: G05B 191054 (2013.01); G06F 1113409 (2013.01); G06Q 30/0603 (2013.01); G06F 2201/865 (2013.01); G05B 2219/15116 (2013.01); G05B 2219/13024 (2013.01); G06Q 10110 (2013.01)
- Description and Relevancy: The patent describes a method for creating digital twins that replicate machines or production systems within a computer environment. These digital twins are developed using physical laws and equations rather than just sensor data, providing a more accurate representation of real-world systems. The digital twins can be modularized through APIs, enabling them to be divided into smaller components and traded on marketplaces as application packages. The patent also describes faster development of digital twins by combining mathematical methods and cloud technology together. The patent also discusses an architecture that is useful and could be easily adaptable to changes in the production line.
Key Publication #4: Published Research Paper
- Paper Title: Interactive Real-Time Monitoring and Information Traceability for Complex Aircraft Assembly Field Based on Digital Twin
- Journal: IEEE Transactions on Industrial Informatics
- Date: September 2023
- Author(s): Yajun Li et al.
- Description and Relevancy: This paper introduces an interactive real-time monitoring system for complex aircraft assembly, developed using a digital twin framework. Key contributions include a standardized data organization method that ensures traceability by utilizing hierarchical relationships, workflows, and timestamps for both static and dynamic data. The authors present a flexible and scalable data collection system that supports multiple protocols and heterogeneous data sources, enabling equipment upgrades without disrupting assembly workflows.
Key Publication #5: Published Research Paper
- Paper Title: Heterogeneous Models Integration for Safety Critical Mechatronic Systems and Related Digital Twin Definition
- Journal: Applied Sciences, MDPI
- Date: March 2022
- Author(s): Faïda Mhenni et al.
- Description and Relevancy: This paper presents an integrated approach for designing and analyzing safety-critical mechatronic systems, focusing on developing a digital twin for a collaborative aircraft assembly workspace. The authors employ Model-Based Systems Engineering (MBSE), Model-Based Safety Assessment (MBSA), and multi-physics modeling to design a workplace for assembling Electro-Mechanical Actuators (EMAs) on aircraft wings.
Key Publication #6: Published Research Paper
- Paper Title: Digital Transformation in Aviation: An End-to-End Digital Twin Approach for Aircraft Engine Maintenance
- Journal: Proceedings of the Global Power and Propulsion Society
- Date: September 2024
- Author(s): Stanislaus Reitenbach et al.
- Description and Relevancy: This paper presents an end-to-end digital twin approach for aircraft engine maintenance, using a turbine blade case study. The process begins with 3D scanning using high-resolution cameras to capture blade geometry, including defects and wear. Results are integrated into multi-fidelity simulations for system-level analysis.
Key Publication #7: Published Research Paper
- Paper Title: Digital Twin: Origin to Future
- Journal: Applied System Innovation, MDPI
- Date: May 2021
- Author(s): Maulshree Singh et al.
- Description and Relevancy: This paper provides a comprehensive review of Digital Twin (DT) technology, covering its origins, definitions, characteristics, types, advantages, applications, and challenges. DT is defined as a virtual representation of a physical entity connected via real-time data exchange, originating from the aerospace industry but now applied across diverse sectors.
Key Publication #8: Published Research Paper
- Paper Title: A Standardized Approach for Measuring the Performance and Flexibility of Digital Twins
- Journal: International Journal of Production Research
- Date: November 2022
- Author(s): Foivos Psarommatis & Gokan May
- Description and Relevancy: This paper proposes a standardized approach for measuring the performance and flexibility of digital twins (DTs) in manufacturing. It introduces a quantitative method for evaluating DT performance based on key performance indicators (KPIs) such as accuracy, response time, and flexibility.
Finance Model
1. NPV Analysis
1.1 Cost Breakdown
1.2 Calculation Process
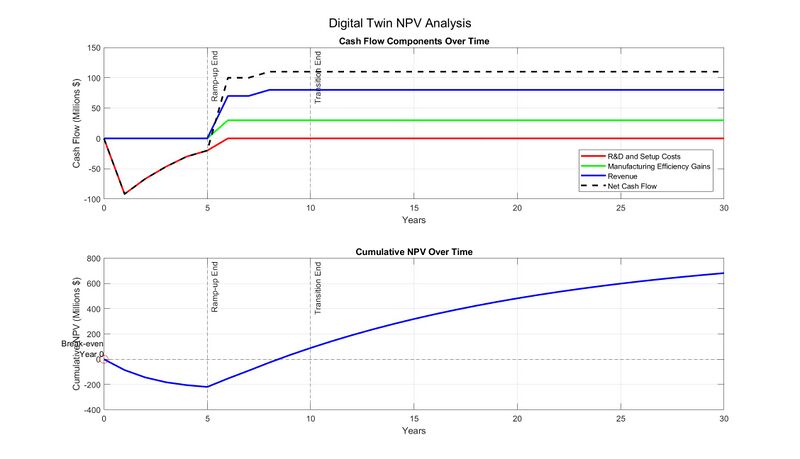
1.3 Digital Twin NPV Analysis
1.4 Key Takeaways
- Development Costs: High initial costs are unavoidable but necessary to establish the infrastructure and capabilities for a Digital Twin implementation.
- Ramp-Up Success: The ramp-up phase demonstrates a well-timed transition to revenue generation, aided by efficiency improvements.
- Sustainability: The project achieves long-term profitability with stable revenue and efficiency gains, showcasing the value of Digital Twin technology.
- Strategic Planning: The breakeven point at Year 8 highlights the importance of securing funding and stakeholder patience during the early years of the project.
2. Revenue and Cost Breakdown
2.1 Revenue and Cost Breakdown Table
2.2 Revenue Streams and Cost Over Time
2.3 Sensitivity Analysis: Impact of Market Size
2.4 Key Insights
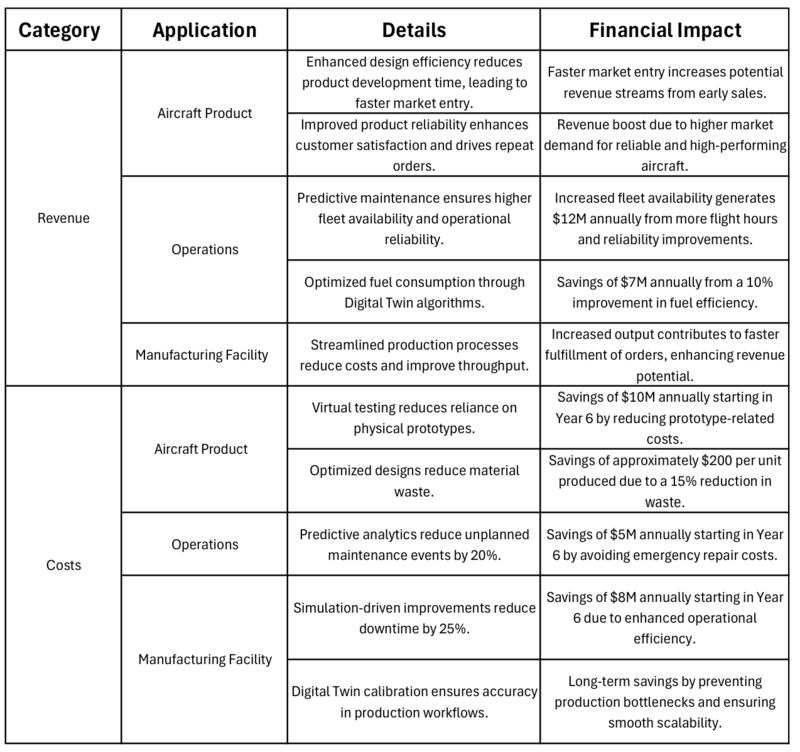
- Steady Revenue Growth: Revenue reaches approximately $40 million annually by Year 10, driven by market entry, improved fleet availability, fuel efficiency, and product reliability.
- Significant Cost Savings: Total annual cost savings grow rapidly to $22 million by Year 10, with manufacturing optimizations, material savings, and reduced maintenance costs as primary contributors.
- Fleet Availability Impact: Improved fleet uptime through predictive maintenance generates substantial early revenue gains, showcasing the operational benefits of Digital Twin technology.
- Revenue Sensitivity: Revenue is highly responsive to market size changes, growing significantly with an increase in market share, while costs remain relatively stable, demonstrating scalability.
- Profitability Advantage: By leveraging Digital Twin efficiencies, the gap between revenue and costs widens over time, maximizing profitability as market size increases.
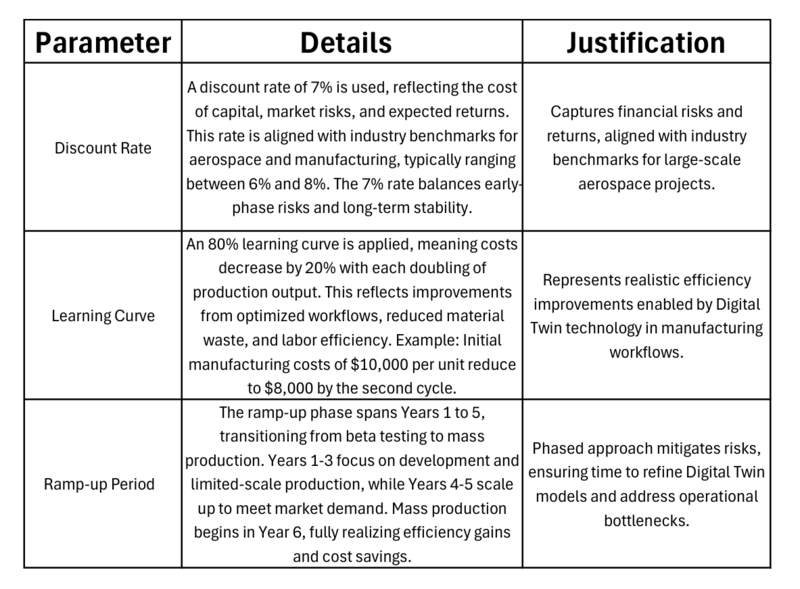
3. Discounted Cash Flow(DCF) Assumptions
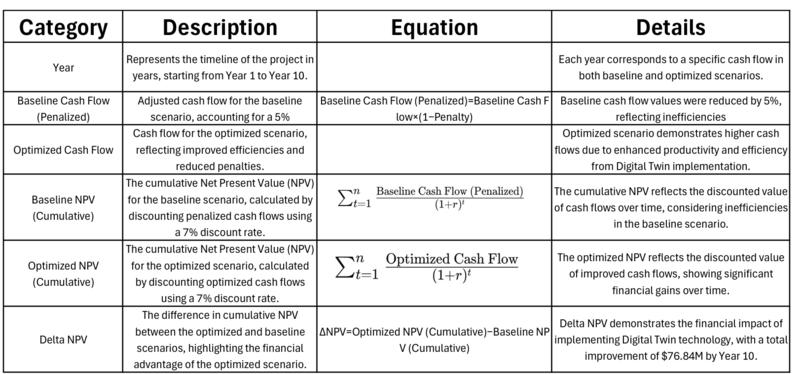
4. Delta NPV (DNPV) for Project Comparison Metrics
4.1 DNPV Chart
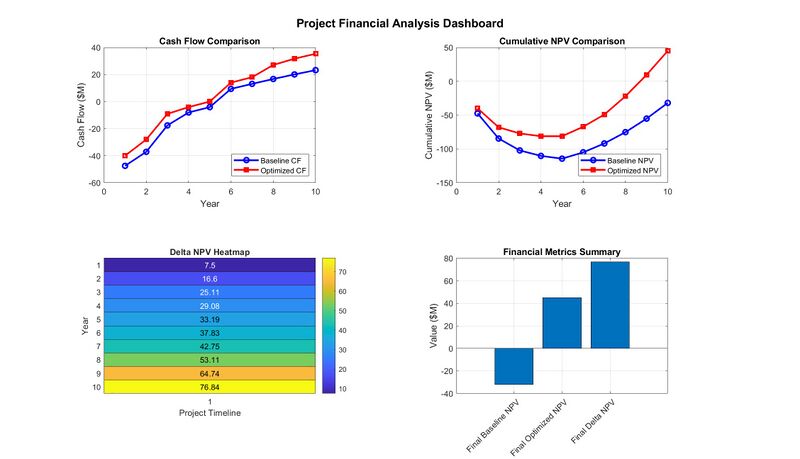
4.2 Project Financial Analysis Dashboard
4.3 Key Insights
- Cash Flow Comparison: Optimized cash flow outperforms the baseline scenario starting from Year 6 due to efficiency improvements.
- Cumulative NPV Comparison: Optimized NPV surpasses the baseline by Year 8, with a final Delta NPV of $76.84M at Year 10.
- Delta NPV Heatmap: Delta NPV grows consistently over time, highlighting the financial advantage of the optimized scenario.
- Financial Metrics Summary: Final baseline NPV is negative, while the optimized scenario achieves significant positive returns, demonstrating clear project profitability.
List of R&T Projects and Prototypes
1. Project Performance Indicators
1.1 Figures of Merit (FOMs) by Product Level
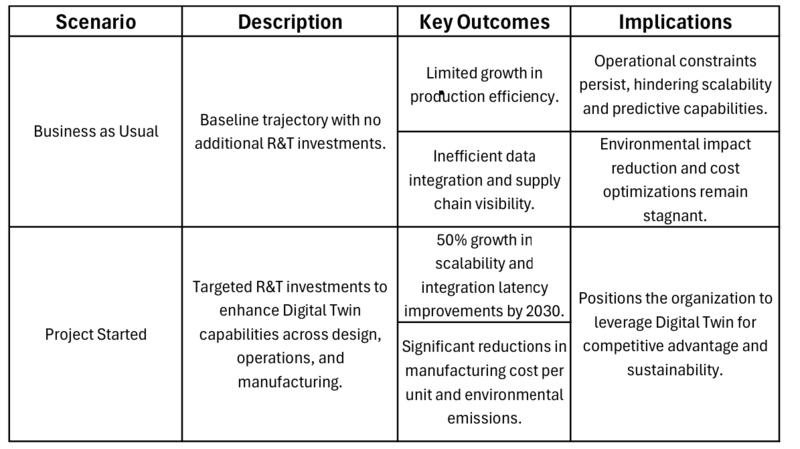
1.2 Scenario Analysis
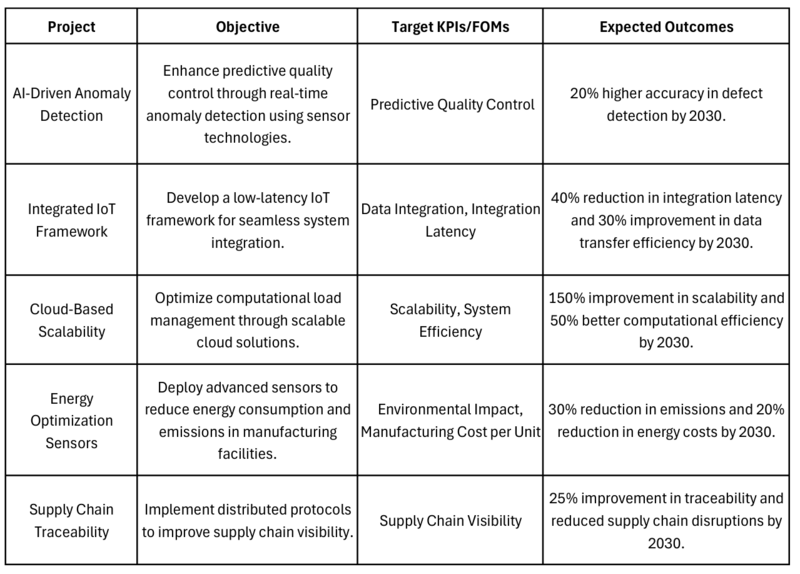
1.3 Example Projects
2. Transfer Function
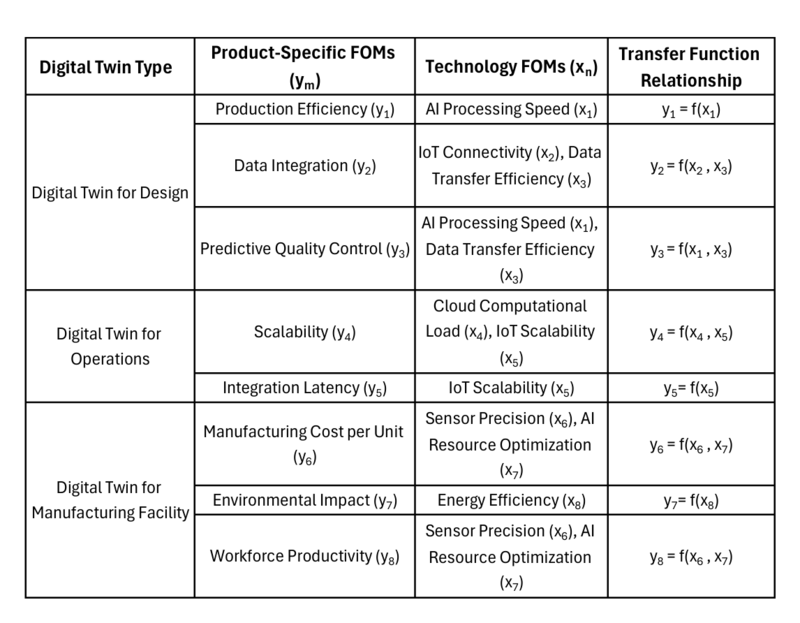
The Transfer Function Model provides a structured relationship between project-specific Figures of Merit (FOMs) and the enabling technology FOMs, enabling a quantitative assessment of how R&T efforts impact Digital Twin performance. This model is represented as:
𝑦₁, 𝑦₂, …, 𝑦ₘ = 𝑓(𝑥₁, 𝑥₂, …, 𝑥ₙ)
Where: - 𝑦₁, 𝑦₂, …, 𝑦ₘ represent **Product-specific FOMs**, such as Production Efficiency, Data Integration, Scalability, and Environmental Impact. - 𝑥₁, 𝑥₂, …, 𝑥ₙ represent **Technology FOMs**, such as AI & ML Processing Accuracy, IoT Connectivity, Cloud Scalability, and Sensor Sensitivity.
2.1 Transfer Function Model
3. Target Performance Evaluation
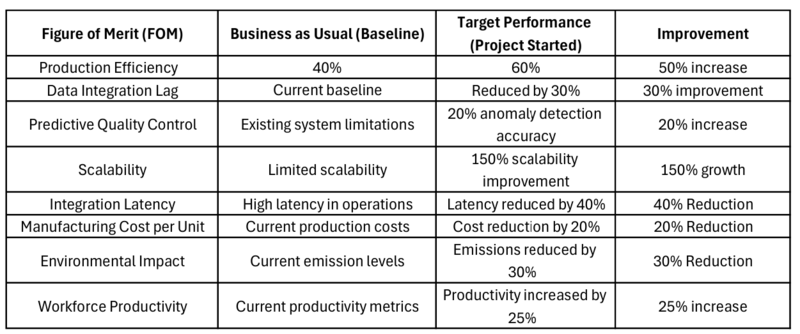
3.1 Scenario Comparison
3.2 Target Performance Evaluation Charts
Performance Analysis
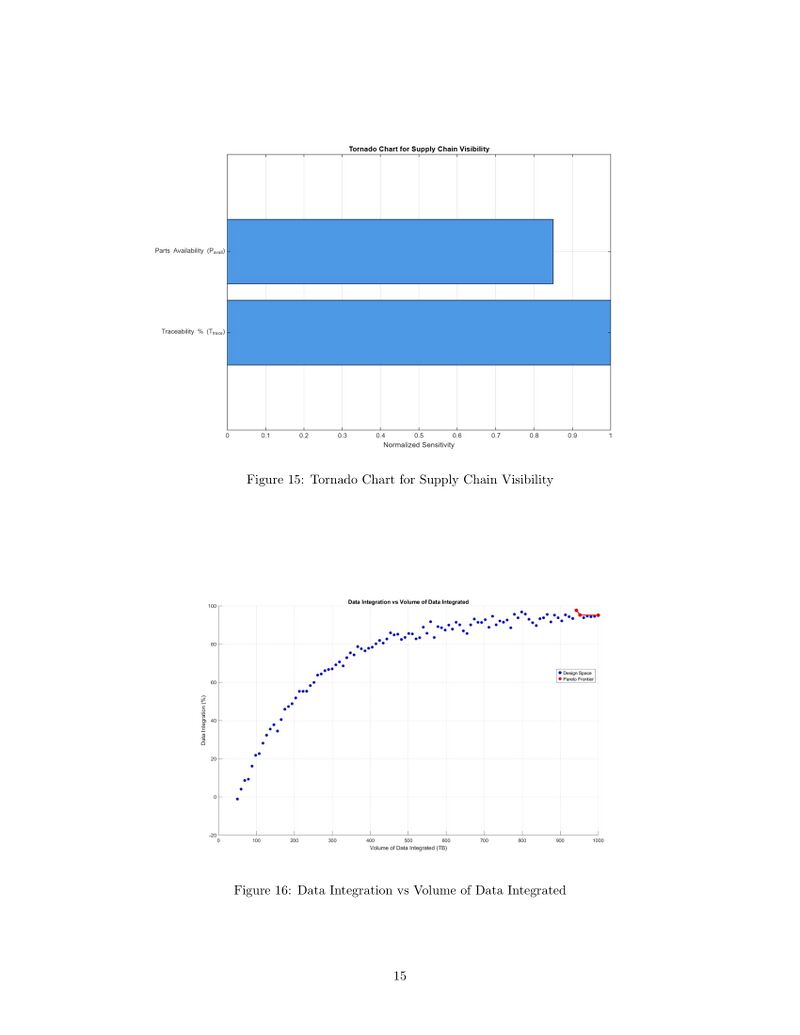
- Scalability shows the highest improvement, indicating substantial progress in handling increased workload and system capacity. This reflects significant focus and investment in scalability.
- Production Efficiency has increased substantially, highlighting optimized processes and effective resource utilization to achieve a 50% improvement.
- Data Integration and Quality Control exhibit moderate improvements, indicating steady progress in enhancing system connectivity and quality standards.
- Integration Latency and Environmental Impact show noticeable but less dramatic improvements, suggesting these areas have received some attention but may require additional focus to achieve larger gains.
- Workforce Productivity and Manufacturing Cost show modest improvements, reflecting either lower prioritization or the inherent challenges of achieving significant gains in these areas.
4. Gantt Charts for Milestones
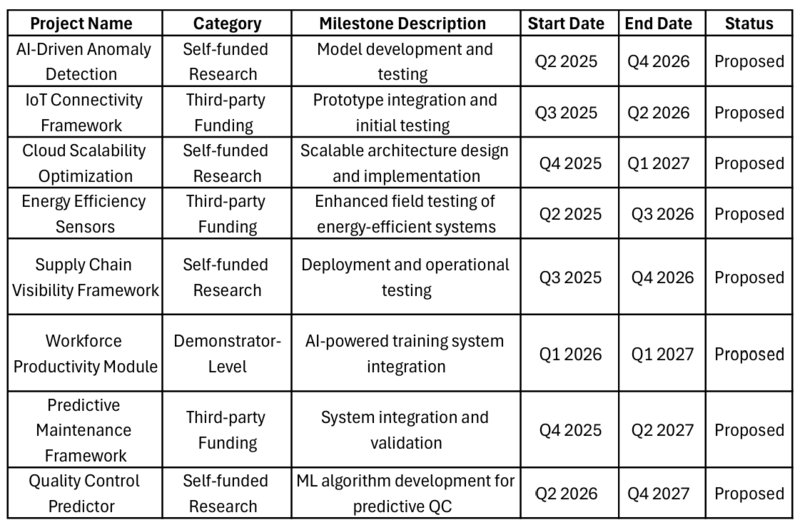
4.1 Project Milestones Breakdown
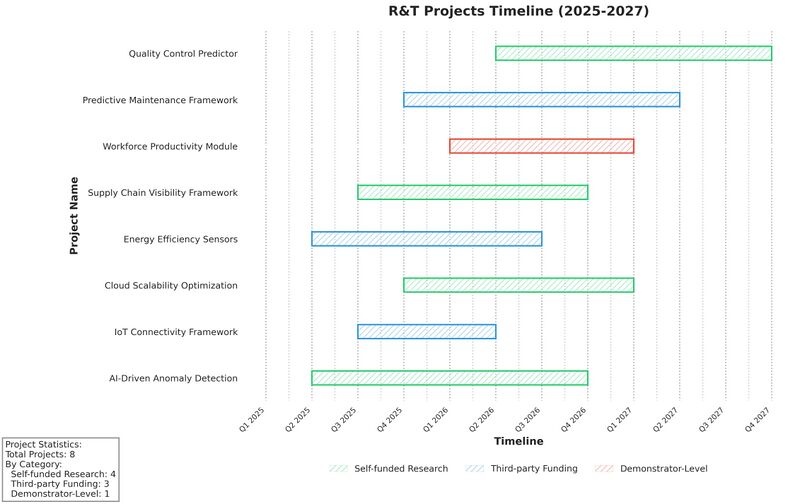
4.2 R&T Projects Gantt Charts
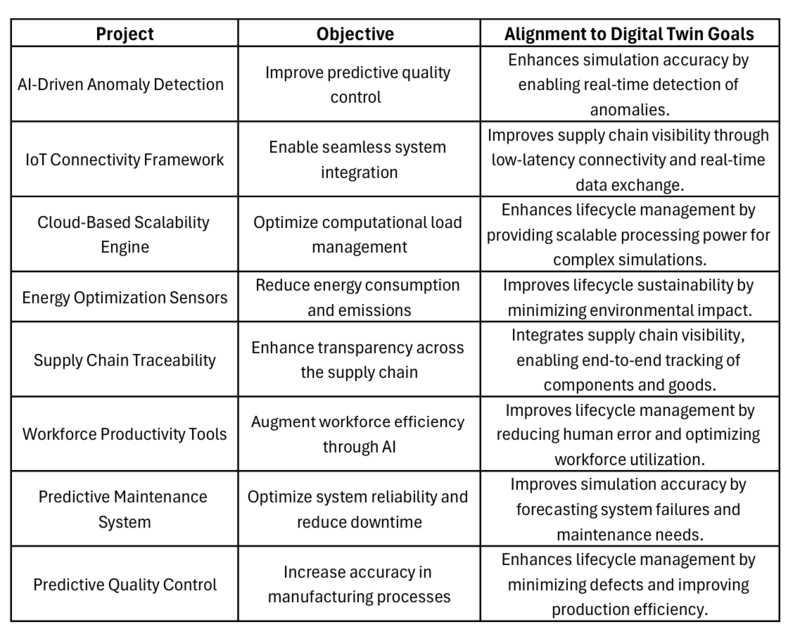
5. Alignment to Goals
6. Budget and Resources
6.1 Budget Allocation
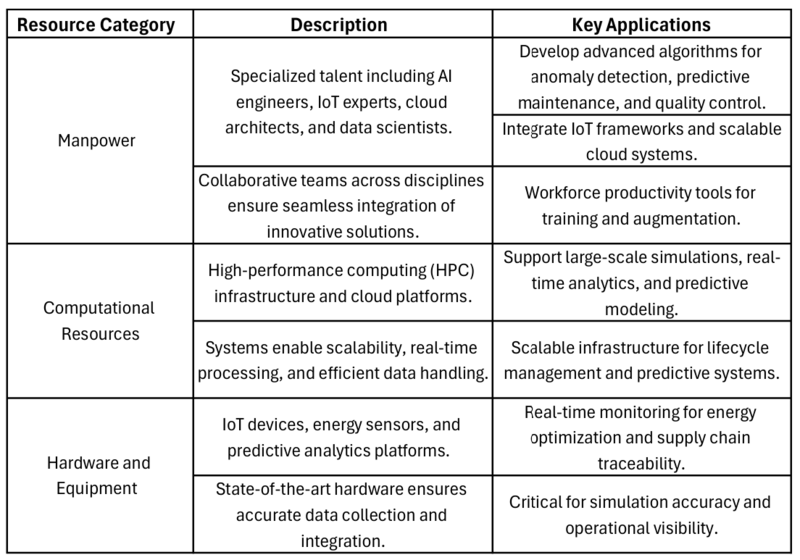
6.2 Resource Breakdown
6.3 Budget Summary
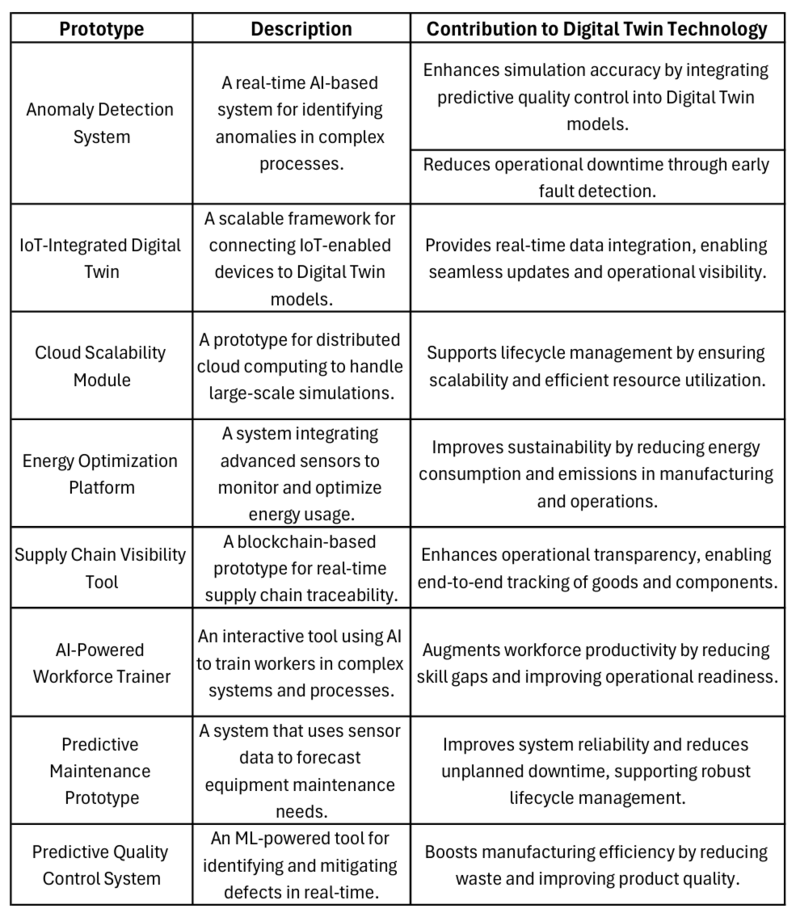
7. Potential Prototypes
Technology Strategy Statement
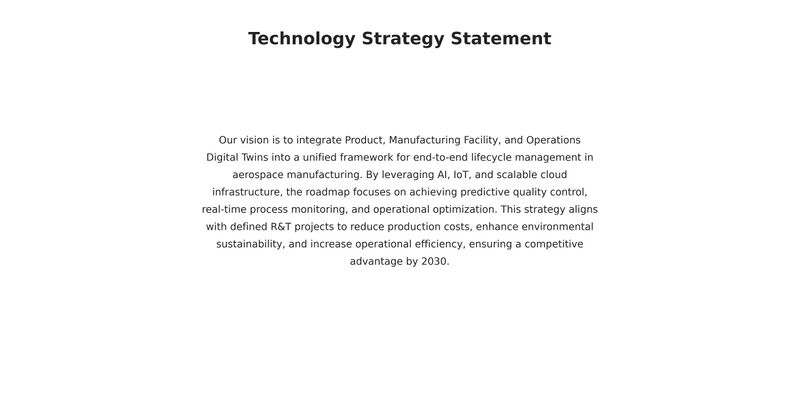
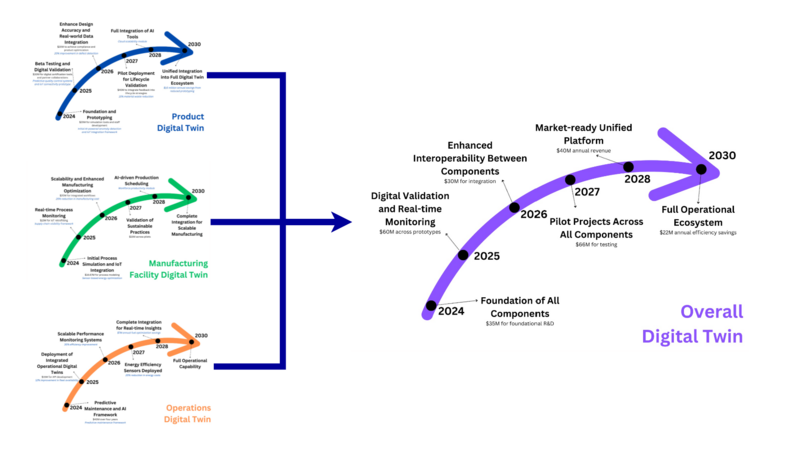
A technology roadmap should conclude and be summarized by both a written statement that encapsulates the technology strategy emerging from the roadmap and a graphic that illustrates the key R&D investments, milestones, and vision for this technology over time. For the 2DTT - Digital Twin Technology roadmap, the strategy statement can be outlined as follows:

