Difference between revisions of "Sparse Apertures for Next Generation Optical Space Telescopes"
| Line 36: | Line 36: | ||
One key figure of merit is the mass-specific effective aperture. The figure below shows the progression of this figure of merit over time from early Earth-reconnaissance satellites, to the filled-aperture space telescopes in the past 30 years, to the next generation of synthetic aperture systems that extend the pareto front. | One key figure of merit is the mass-specific effective aperture. The figure below shows the progression of this figure of merit over time from early Earth-reconnaissance satellites, to the filled-aperture space telescopes in the past 30 years, to the next generation of synthetic aperture systems that extend the pareto front. | ||
[[File: | |||
[[File:Pareto.png|none|800px]] | |||
== Strategic Drivers and Alignment of Key Figures of Merit == | == Strategic Drivers and Alignment of Key Figures of Merit == | ||
Revision as of 21:44, 3 December 2019
Technology Roadmap Sections and Deliverables
This technology roadmap is identified as follows:
- 2SASOT - Sparse Aperture Space Optical Telescope
This a Level 2 roadmap that evaluates sparse aperture optical telescopes that can achieve larger effective aperture. This feeds into a Level 1 roadmap for next generation space optical telescopes, which includes separate categories like monolithic or segmented telescopes. A Level 3 roadmap would describe the technological progress required to achieve a particular sparse aperture technique (deployable, formation flying, or erecting on-orbit). A Level 4 roadmap would describe individual enabling technologies such as on-orbit alignment metrology, and precision formation flying control algorithms.
Roadmap Overview
The angular resolution of a telescope is proportional to the size of the aperture. The mass and thus cost of space telescopes increases exponentially with aperture diameter. There is a need for systems that can produce the equivalent of a large aperture with low mass. This can be achieved by creating a synthetic aperture using multiple sub-apertures. One method to achieve this is to create a large number of small spacecraft, flying in a formation that creates the synthetic aperture.
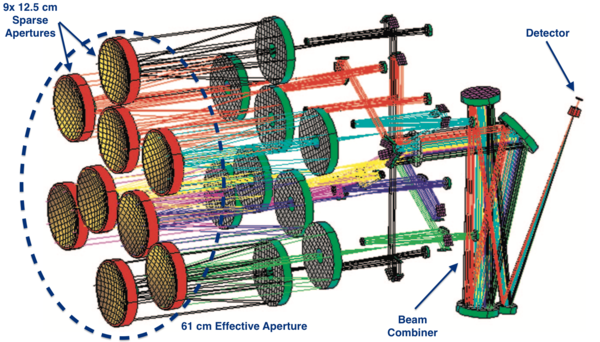
Currently, a sparse aperture space telescope has not yet been fielded. In 2006, Lockheed Martin built a laboratory demonstration of a sparse aperture space telescope, which is depicted in the figure below. Currently, the technology appears be at approximately TRL 4. Research has proven the feasibility of the technology, however, significant technology development must be completed before a space technology demonstration is ready.
DSM Allocation
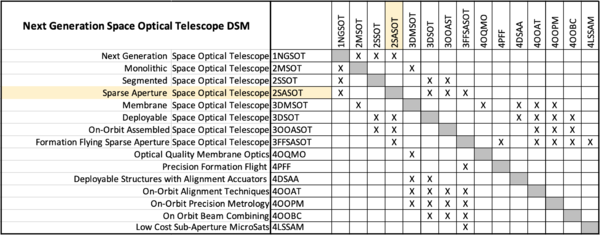
The design structure matrix for space optical telescopes is shown in the figure below. This DSM starts at Level 1.
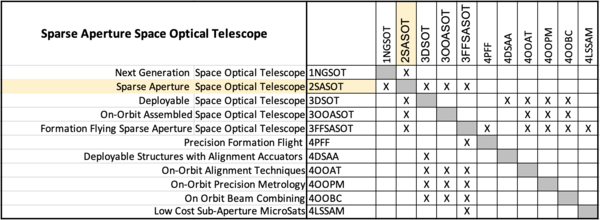
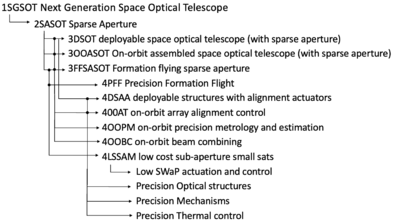
From this top level DSM, we can extract a Level 2 DSM specifically for Sparse Aperture Space Optical Telescopes (SASOT), which is provided below. This matrix can also be view in tree form. Here we can easily see that there are several enabling technologies required to develop SASOTs that are common to all Level 3 instantiations (deployable, on-orbit assembly, formation flying). There are also some technologies that are only feed one Level 3 SASOT, so such as low cost sub-aperture small sats enabling formation flying sparse apertures. Finally, the DSM tree includes some lower level technologies there are also important, but do not have their own specific roadmap identifier at this time.
Roadmap OPM Model
An Object Process Model is presented for a formation-flight synthetic aperture imaging system.
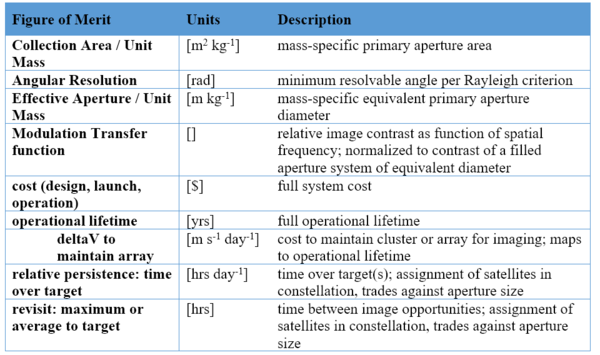
Figures of Merit
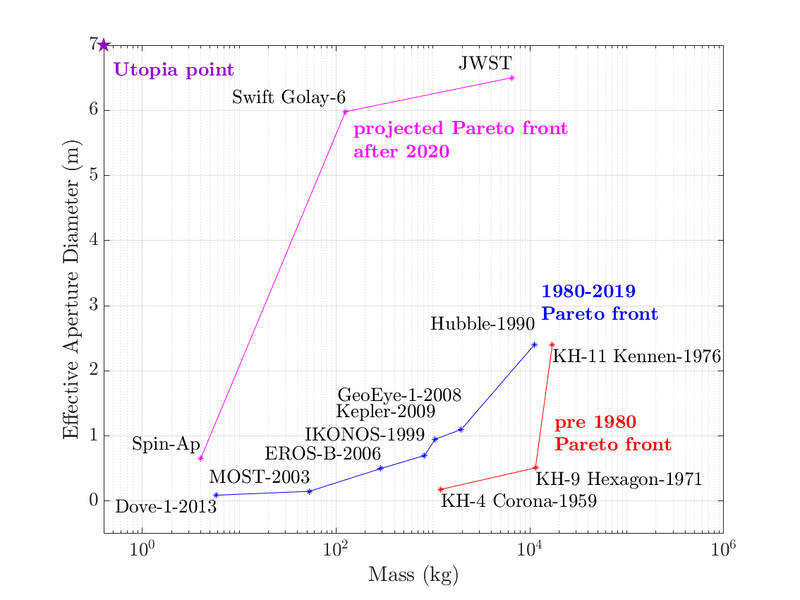
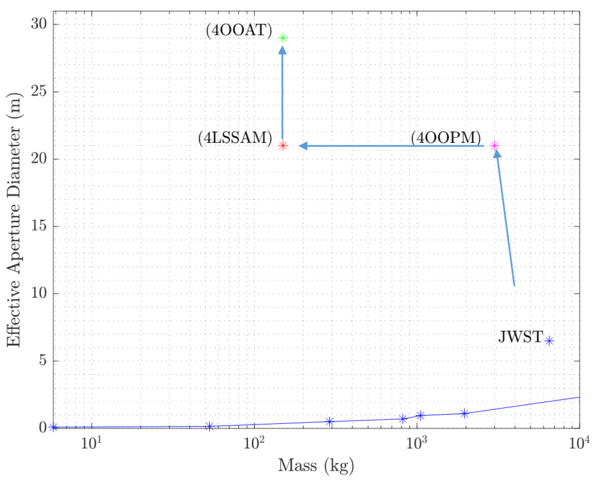
One key figure of merit is the mass-specific effective aperture. The figure below shows the progression of this figure of merit over time from early Earth-reconnaissance satellites, to the filled-aperture space telescopes in the past 30 years, to the next generation of synthetic aperture systems that extend the pareto front.
Strategic Drivers and Alignment of Key Figures of Merit
Ever since the launch of Sputnik in 1957, satellite development and deployment have largely remained under the the domain of government agencies due to the high costs and technological barriers to entry. However, in the last few decades, we have begun to see the commoditization of satellite technology as many commercial companies are now launching and operating satellites and making profits. This is readily apparent in the rapidly growing Earth imaging marketplace and wide spectrum of business models. This market is dominated on the high performance end by vendors such as Lockheed Martin, who have an exquisite sensor with a 1.1 [m] primary mirror on their WorldView-3 satellite. On the opposite side of the spectrum, PlanetLabs competes with constellations of satellites with smaller apertures between 0.9 [cm] - 35 [cm], but provide imagery that is significantly less expensive.
While the Earth observation market expands and moves toward saturation, deep space observation using space telescopes is still led primarily by government agencies such as NASA. Existing satellite, astronomical observatories are few, high cost, and not readily available to researchers who are outside NASA or high profile research institutions. Therefore, a market opportunity exists to provide lower cost, high resolution imagery to a larger market, especially as worldwide interest in space continues to grow.
Sparse Aperture Imaging LLC. (SAIL) is a new start-up venture that plans to lead in this new marketplace by developing, launching, and operating deep-space telescopes and providing that imagery to customers. SAIL has decided to initially operate in the infrared spectrum and provide medium-to-high resolution imagery. However, to keep costs low compared to high performance sensors with monolithic meter-class primaries, SAIL will employ a sparse aperture imaging approach. This roadmap seeks to evaluate the approach that is most suitable for achieving these strategic drivers and hitting the FOM targets laid out in the table below. These targets are grounded in data from existing systems as well as performance models of the potential gains from sparse aperture systems. Since SAIL is a new venture starting from the ground up, it has ensured that the strategic drivers are aligned with this roadmap.
| Strategic Driver | Alignment and Targets | |
|---|---|---|
| 1 | Use sparse aperture imaging technology to drive down the effective aperture per kg of the system (which could be a single satellite or multiple flying in formation). This tightly coupled to the total system cost, driver 3. | 0.2 [m/kg]: Effective aperture per kg
Alignment: |
| 2 | Provide medium to medium/high resolution data that is able to meet the majority of customer needs using a modular, sparse aperture architecture. | 0.04 [urad] - 0.1 [urad]: Angular Resolution
Alignment: |
| 3 | Offer imagery at a competitive price by keeping total system cost low compared to current state-of-the-art systems. | 100 [millions of $]: Total System Cost (build and launch of 0.75 [mrad] angular resolution system)
Alignment: |
References:
- https://www.airspacemag.com/space/is-spacex-changing-the-rocket-equation-132285884/
- https://en.wikipedia.org/wiki/Atlas_V#Launch_cost
- https://www.forecastinternational.com/archive/disp_pdf.cfm?DACH_RECNO=1252
- https://en.wikipedia.org/wiki/WorldView-3
Positioning vs. Competition
The following table shows the recent and near future infrared space telescopes with which SAIL will need to compete. The last row shows the system parameter FOM targets for the SAIL system, assuming all enabling technology roadmap goals are completed as outlined in the sections below.
| Spacecraft | Total Cost* | Mass | Aperture | Aperture / Mass | Wavelength Range | Normalized Angular Resolution** |
|---|---|---|---|---|---|---|
| [$ millions, 2019] | [kg] | [m] | [m/kg] | [um] | [urad] / [arcsec] | |
| Herschel | 1,679 | 3,300 | 3.5 | 0.0011 | 55 - 672 | 0.35 / 0.07 |
| WISE | 436 | 661 | 0.4 | 0.0006 | 3.4 - 22 | 3.05 - 0.63 |
| Spitzer | 1,181 | 851 | 0.85 | 0.0010 | 3.6 - 160 | 1.44 / 0.30 |
| JWST | 10,000 | 7,000 | 6.5 | 0.0009 | 0.6 - 28.5 | 0.19 / 0.04 |
| WFIRST | 2,700 | 4,166 | 2.4 | 0.001 | 0.5 - 2.0 | 0.51 / 0.10 |
| SAIL | 100 | 150 | 29 | 0.2 | 1.0 - 10 | 0.04 / 0.01 |
(*Total Cost: Design, launch, and operations)
(**Angular resolution normalized to 1 um)
Technical Model: Morphological Matrix and Tradespace
The Rayleigh Criterion gives the angular resolution as a function of the wavelength and the effective aperture diameter. Therefore, the abstracted FOM in this model is the effective aperture diameter.
The Rayleigh Criterion assumes that the point sources are resolved as single-peak point spread functions. However, for a non-monolithically filled aperture system, the peaks may not be resolved cleanly. Instead there may be side lobes indicating degraded contrast and thus image quality. These are both functions of the interfered wavelengths. For visible light applications, it is desirous to consider the effective diameter to only include the aperture in which all distances can be interfered. This corresponds to the roots of the modulation transfer function (MTF). A simplified approach is presented in [2] to generate a u-v plane, normalized to the units of the subapertures to calculate an effective aperture diameter within the first root of the MTF (the maximum circumscribed diameter in the u-v plane that contains no singular u-v locations).
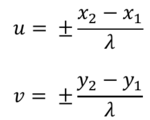
u-v coordinates are defined for any two points spatially located in the primary aperture imaging plane denoted as (x_1,y_1 ) and (x_2,y_2):
For a given aperture configuration, a Monte Carlo sampling of pairwise points on the physical surfaces of each aperture within the spatial x-y plane can be used to construct the u-v plane. Normalization against the observed wavelength in the u and v equations will produce a result for a wave number of 1. The units of this u-v plane will be in those of the aperture diameter and thus map to an effective aperture relative to the physical x-y plane of the aperture [6]. A numerical edge-search method to find the largest circumscribed area with no sizable intermediate wavelength u-v singularities (empty pockets) is used to determine the effective aperture diameter.
Meinel and Meinel present cost and mass estimates where [4]:
For this analysis, the proportionality for the system mass will be given by:
For this sensitivity analysis, 3 design parameters will be considered about the baseline shown:
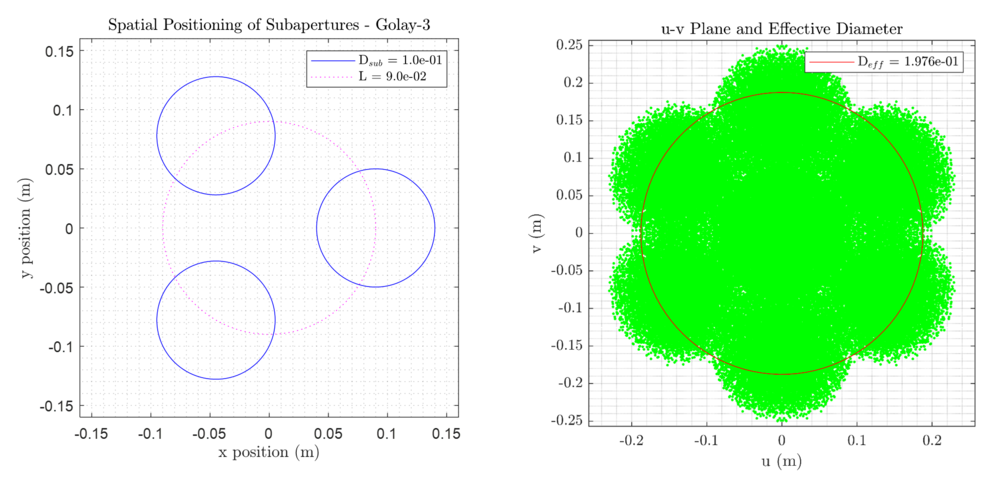
The results for the numerical Monte Carlo approach to sizing of the effective aperture of the baseline case is shown below:
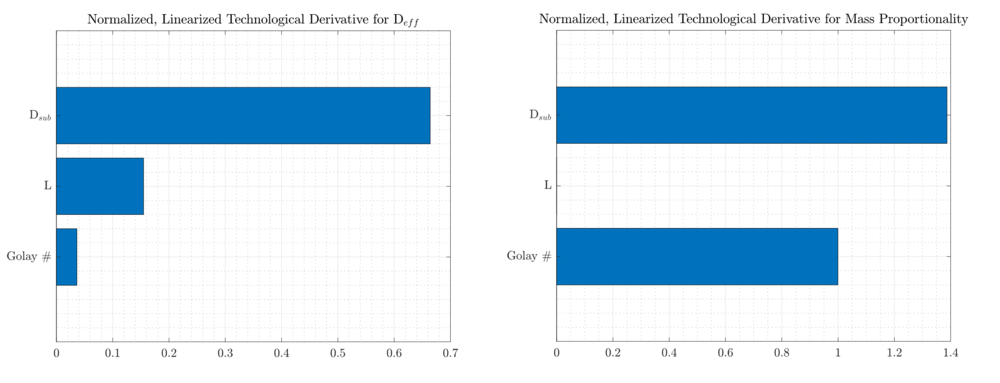
Normalized, univariate sensitivities are shown for stepwise variations from the baseline architecture to the next incremental value for each design parameter.
The normalized sensitivity results show the effect of each univariate perturbation around this baseline. Deff is most strongly affected at this point by the subaperture diameter. This has the corresponding effect of having the highest increase in the mass proportionality term. The net effect of increasing the subaperture diameter for a fixed spacing, is to increase the physical fill factor of the aperture. The ratios of the normalized linearizations indicate that from this point, an increase in the subaperture diameter would be desirable only if the Deff is valued proportionately more than the mass term.
In contrast, perturbation of the L term results in a proportionately low increase in Deff with no penalty to the mass. Therefore, L should be unilaterally increased to move towards the pareto front. However, it should be noted that as L is increased, there is a point where singular regions of the u-v plane will form inside of the inscribed diameter (left figure below). This would indicate that some mid-frequencies are no longer being interfered, and the effective aperture is no longer compact. In this case, a requirement on contrast per the point spread function is needed. Further increase in L will eventually create a continuous region of u-v singularities in all directions (right figure below). This annulus would indicate a new root in the MTF at the diameter of the inner cluster of u-v points. Variation in L is therefore convex.
In this example, the Golay number has a very limited effect since no other terms are varied. In this example, a center aperture is added, but is line-to-line with the other 3 subapertures. The result is that there is only a small effect on the effective aperture diameter, at the cost of 1 additional subaperture of mass. However, it is expected that covariation of the three terms would yield a proportionately greater increase with more subapertures. Furthermore, greater increases necessitate definition of more spacing terms to fully define the arrays.
The sensitivity results represent a linearization of the Jacobian strictly about the given baseline architecture. Changes in the perturbation step size will result in alternate linearizations due to non-linearity. Moreover, sensitivity about a different baseline will yield a vastly different set of linearizations due to the non-linearity. It is also expected that covariation of terms would result in different effects on the FOMs.
Financial Model
Space systems are very expensive with many barriers to entry. In order for SAIL to become a viable company and maintain a solid financial foundation, it will require a significant amount of initial venture capital funding as well as backing from a government organization such as NASA. In recent years, NASA has shown interest in outsourcing specific functions to industry in order for it to better focus on its core charter. For example, NASA now utilizes SpaceX for ISS re-supply mission because this commercial company has innovated to provide a lower cost service. In a similar fashion, SAIL is intending to drastically decrease the cost of high resolution, deep space imaging in a way that it makes financial sense for NASA to outsource production and operation of deep space IR imaging observatories.
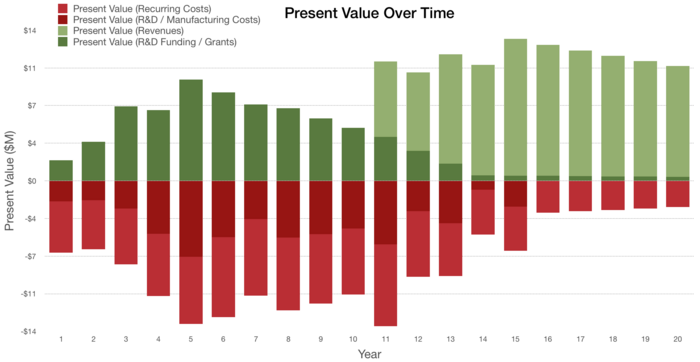
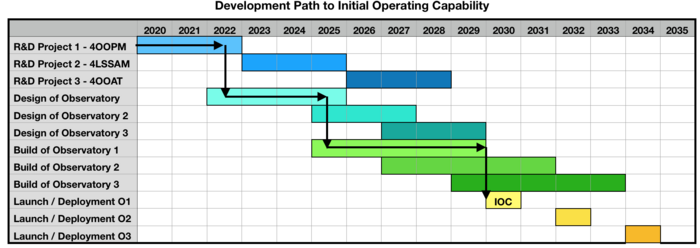
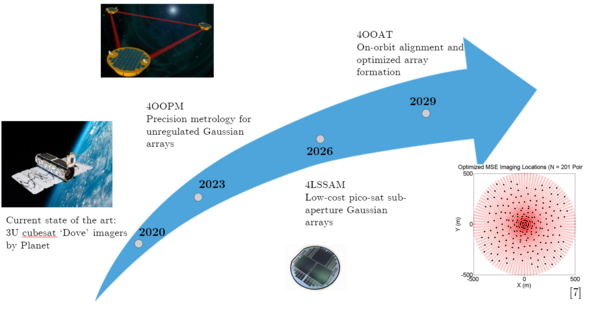
The financial forecast below is over the period of 20 years. The three R&T research projects listed below are staggered over the first nine year period. Early NASA and venture capital funding is required to develop the enabling precision metrology techniques (400PM), which will flow into the design and build of the fist SAIL observatory. An initial imaging capability is expected by year 11. Once first light is achieved, revenue will begin to flow from the imagery generated by the observatory to support the build and deployment of subsequent observatories. The second (4LSSAM) and third (400AT) R&T projects will follow and occur in parallel with the design and build of observatory 1. As these projects complete, the technology will be infused into the 2nd and 3rd observatories, respectively. By year 15, the full capability outlined in the vector plot below will be realized.
An annual contract will be established with NASA as a primary customer of the deep space imagery. It is also anticipated that the STSci (Space Telescope Science Institute) will provide additional funding. Finally, by offering a low cost astronomical observatory, it will be possible for the amateur astronomy community to purchase imagery. It is expected that this funding stream will be minimal initially, but will grow as SAIL gains recognition and can lower costs over time.
Over this time horizon, the estimated Net Present Value (NPV) for the development and implementation of this technology is estimated at 18 million. However, it is typical for many space systems to experience delays and cost over-runs, especially as technology is matured to a TRL of 6, which will be required for this effort.
Additional financial assumptions:
- Discount rate of 5%
- Venture capital funding of 12 million over 6 years
- Manufacturing learning curve efficiencies of 10% from build to build after first observatory
- Launch costs of $5 million by utilizing ride share opportunities
The Gantt chart below provides a timeline showing the path to achieve an initial operating capability within 11 years followed full capability after 15 years by incorporating the developments of the three different R&T projects.
R&T Projects and Prototypes
There are three key enabling technologies to advance the pareto front of effective aperture vs. system mass (currently defined by strictly monolithic spacecraft).
1. Precision Metrology (4OOPM)
- capability target derived from NASA 2015 Technology Roadmaps 8.2.3.1: Ultra-Precise Absolute Ranging for Distributed Aperture
- if not developed: aperture cost curve remains in the monolithic domain at current Pareto front
2. Low-cost sub-aperture small-sats (4LSSAM)
- if not developed: use current state-of-the-art cubesats for arrays ~4-10 kg each (e.g., Planet Dove imagers)
- if developed: picosat subaperture imagers in the 200-300 gram range: ~ order of magnitude mass reduction for a given array size
3. On-Orbit Alignment Techniques (4OOAT)
- if not developed: utilize Gaussian arrays with metrology - limited to large inter-spacecraft separation therefore only long imaging wavelengths (IR), less efficient arrays - more spacecraft needed for a given aperture diameter
- if developed: potential for tighter controlled array formation for optimal, non-redundant formations, fewer spacecraft for a given aperture diameter, potential for shorter wavelength imaging
Below is a baselined comparison of the capabilities of a sparse aperture IR imaging system. The three labeled benchmarks represent the effective aperture diameter and mass using the technical model for a proliferated 500-satellite cluster aperture.
Key Publications and Patents
Key Publications:
[1] Golay, Marcel JE. "Point arrays having compact, nonredundant autocorrelations." JOSA 61.2 (1971): 272-273.
- presents optimized, non-redundant point aperture arrays to create effectively large apertures with minimum numbers of elements
[2] Chung, Soon-Jo, David W. Miller, and Olivier L. de Weck. "Design and implementation of sparse-aperture imaging systems." Highly Innovative Space Telescope Concepts. Vol. 4849. International Society for Optics and Photonics, 2002.
- Design and implementation of a Golay-3 synthetic aperture system
[3] Chung, Soon-Jo, and F. Y. Hadaegh. "Swarms of femtosats for synthetic aperture applications." (2011).
- Presents effective aperture calculations for proliferated femtosat clusters; Gaussian arrays, Golay series arrays composed of sub-clusters
[4] Stahl, H. Philip, et al. "Preliminary cost model for space telescopes." UV/Optical/IR Space Telescopes: Innovative Technologies and Concepts IV. Vol. 7436. International Society for Optics and Photonics, 2009.
- Presents several cost and mass models for scaling of space-base telescopes
[5] Dhurandhar, S. V., et al. "Fundamentals of the LISA stable flight formation." Classical and Quantum Gravity 22.3 (2005): 481.
- A proposed 3-element rotating long-baseline interferometer; orbital dynamics solution for low fuel array maintenance
[6] Chung, Soon-Jo. Design, implementation and control of a sparse aperture imaging satellite. Diss. Massachusetts Institute of Technology, 2002.
- Thesis presenting methods for u-v plane analysis and relation to MTF
[7] Kong, E.M.C., 1998. Optimal trajectories and orbit design for separated spacecraft interferrometry (Doctoral dissertation, Massachusetts Institute of Technology). Key Patents:
1. Hunt, Rafanelli, and Phillip: Full aperture scene synthesis using rotating strip aperture image measurements; 1997; European Patent Office - EP 0 802 425 A3
- This patent presents a novel method to fill the u-v plane through integration of images taken for a rotating strip section of an aperture. This produces an axisymmetric MTF equal to the length of the cross-rotational axis segment of the aperture.
- While not directly a multi-element synthetic aperture, it presents a post-processing method to further extend the effective diameter of a compact imaging system of a Golay series array. Orbital dynamics of a close formation-flight system might already naturally be spinning (e.g., the three-element solution for LISA [5]).
2. Duncan et al., Enhanced Multiple Instrument Distributed Aperture Sensor, 2009, US Patent - US US 7,631,839 B1
- This patent presents an instrument configuration that uses 9 subapertures to produce a large ring aperture. The patent includes the mechanical alignment design to host the 9-element large aperture on a single spacecraft.
3. Auterman, et al., Three Dimensional Interferometric Synthetic Aperture Radar Terrain Mapping with Unambiguous Phase Unwrapping Employing Subset Bandwidth Processing, 1993, US Patent – US 5,260,708
- This patent presents a method for terrain mapping with three-element measurements using interferometry. In particular, it presents a novel method to disambiguate the wave number during interferometry of parallel flight-path swaths. This shows one of the early concepts utilizing interferometry to enhance measurements.
Technology Strategy Statement
In order for humans to further our understanding of the universe, new astronomical observations with higher angular resolution need to be designed, built, and launched. Over many decades, NASA has been at the forefront of the developing these space telescopes, such as the Hubble and JWST. However, current monolithic or segmented/filled aperture telescopes are limited in the achievable resolution because of how telescope mass scales with aperture. SAIL plans to overcome this limitation by developing sparse aperture technology that can provide large, effective apertures with very high resolution but with significantly less mass. This will require investment in three key enabling technologies: precision metrology, low-cost sub-aperture small-sats, and on-orbit alignment techniques. Because of the significant costs associated with space systems, a funding partner such as NASA will be needed. With the necessary investment, by 2030, SAIL seeks to deploy between a 20 - 30m effective aperture system with a mass of 150 kg.
