Difference between revisions of "Small Launch Vehicles"
| Line 144: | Line 144: | ||
$$ \frac{\partial \Delta V}{\partial \text{Isp}} = g_0 \log (R)$$ | $$ \frac{\partial \Delta V}{\partial \text{Isp}} = g_0 \log (R)$$ | ||
$$ \frac{\partial \Delta V}{\partial R} = \frac{\txt{Isp } \cdot g_0 }{R}$$ | $$ \frac{\partial \Delta V}{\partial R} = \frac{\txt{Isp} \cdot g_0 }{R}$$ | ||
$$ \frac{Isp_0}{\Delta V_0} g_0 \log (R_0) = 0.99$$ | $$ \frac{Isp_0}{\Delta V_0} g_0 \log (R_0) = 0.99$$ | ||
Revision as of 02:23, 31 October 2020
Technology Roadmap Sections and Deliverables
- 1SLV - Small Launch Vehicles
The small launch vehicle market, a level 1 roadmap, is a sub-sect of the launch vehicle / launch provider market. Level 2 roadmaps are the product level, level 3 roadmaps are at the subsystem level, and level 4 roadmaps are at the component level.
Roadmap Overview
Small launch vehicles (SLVs, also called "Small launchers" or "Small-lift launch vehicles") are a category of orbital launchers capable of carrying a payload of maximum 2000kg* to LEO (Low Earth Orbit). Half a century ago, many families of launch vehicles have started as small launchers, as prototypes, and have led to today's large landscape of heavy launch vehicles (Ariane V, Falcon 9, Soyuz, Delta IV...). Today, the growing market of small satellites (below 500kg) - including, notably, LEO constellations projects and cubesats - pushes towards dedicated small launchers. This trend started in the 1990s and considerably accelerated in the 2010s with the development of a broad ecosystem of SLV startups. In comparison to conventional (heavy) launch vehicles, SLVs have: a higher scheduling flexibility, a higher launch frequency, a much lower total cost but a higher cost per kg of payload.
*: Diverse definitions exist. Some define small launchers as limited to 1 ton instead of 2 tons, some also define a lower boundary of 500kg under which launchers are called 'micro-launchers'.
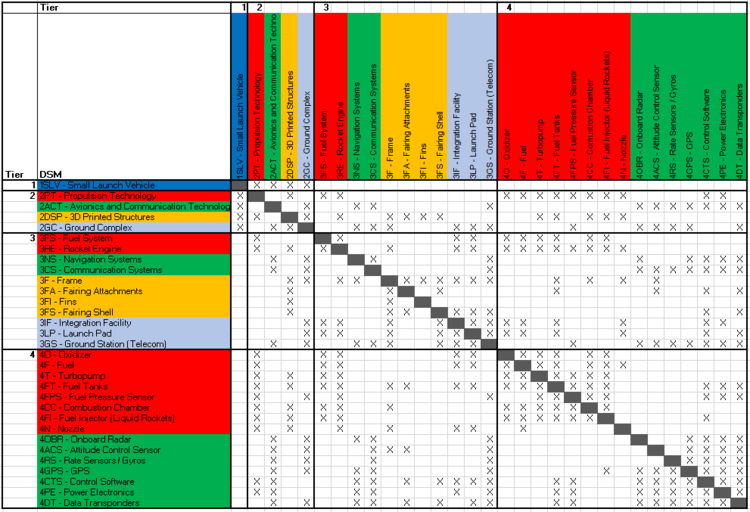
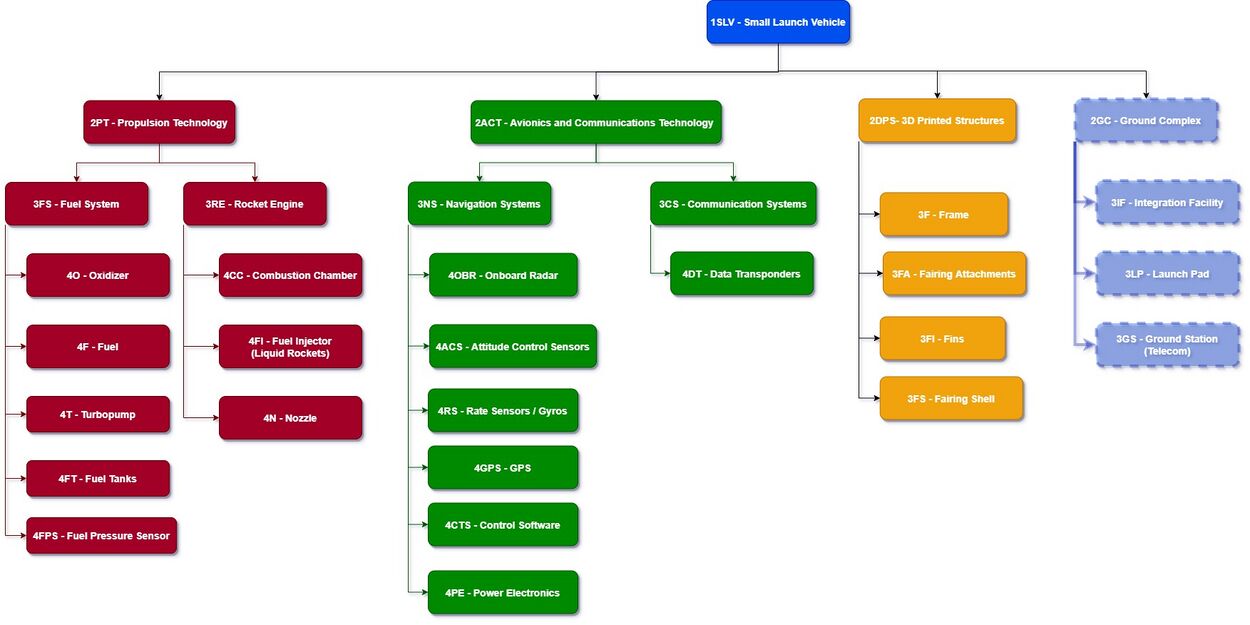
Design Structure Matrix (DSM) Allocation
The technology hierarchy demonstrates that such technologies as metal 3-D printing and modulable launchpads are supporting the development of small launchers. Initiatives and development plans for these technologies enhance small launchers by increasing their reusability, launch rate, scheduling flexibility, and reducing their cost per kilogram to launch payloads into orbit.
Roadmap Model using OPM
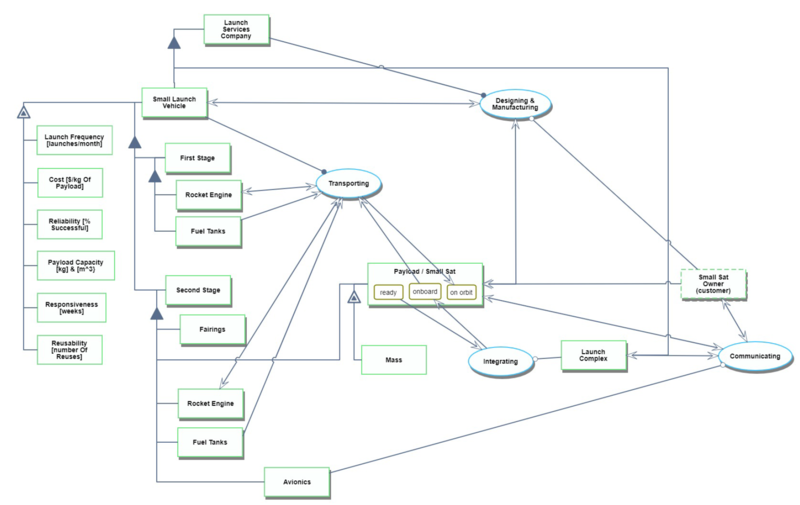
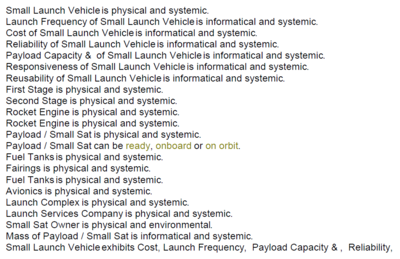
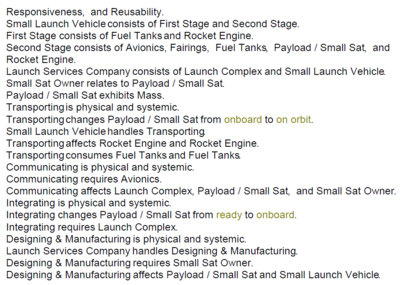
We provide below an Object-Process-Diagram (OPD) of the 1SLV roadmap. This diagram captures the main object of the roadmap, its decomposition into subsystems (engines, avionics, payload...), its characterization by Figures of Merit (FOMs) as well as the main processes and actors involved.
An Object-Process-Language (OPL) description of the technology is auto-generated and given below:
Figures of Merit
Figures of Merit (FoM) used to evaluate small launchers are very similar to the FoMs of conventional launch vehicles, but they have redefined the priorities among these. Typical FoMs for small launchers are:
| Figure of Merit (FOM) | Unit | Description |
|---|---|---|
| Launch Frequency | [launches/month] | The number of launches a launch vehicle can perform in a month |
| Reliability | [% of successful launches] | The percentage of launches out of total launches that are successful as determined by ability to meet end requirements of customers |
| Payload mass capacity | [kg of payload to 500km LEO] | The amount of payload in kilograms that can be launched to 500km Low Earth Orbit (LEO) with the launch vehicle. LEO is a large range and so this FOM standardizes the various launch vehicles by specifying 500km LEO |
| Total cost | [$] | The total cost of the launch to include fixed and variable costs |
| Cost per kg | [$/kg of payload to LEO] | The total cost of the launch divided by the amount of payload to 500km LEO |
| Reusability | [Number of reuse cycles] | The number of times a launch vehicle can be reused before a new one must be built |
| Scheduling flexibility | [weeks or months or years] | How quickly the launch vehicle can go from initial talks with customer to launch to LEO. (Sometimes called Responsiveness, it is the duration between the launch window and the notification of its flight parameters - orbit, latitude, date, etc.) |
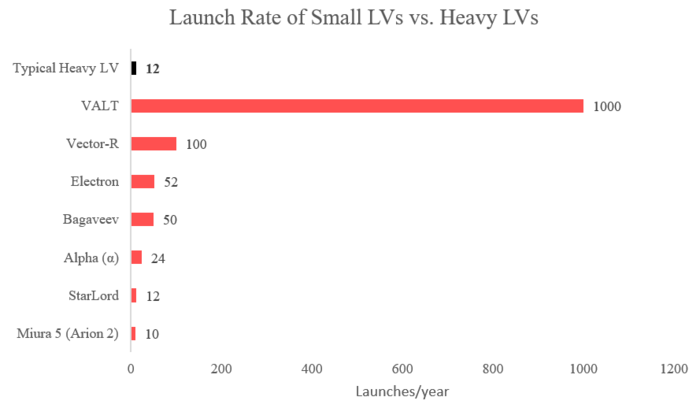
In general, small launcher companies aim for very high launch rates (weekly instead of monthly), high scheduling flexibility (months instead of years), and low launch costs thanks to significant economies of scale enabled by mass production. Some also leverage uncommon launch strategies (balloons, planes, catapults), but here we only include into our scope actual orbital launchers with launching pads on earth or on sea.
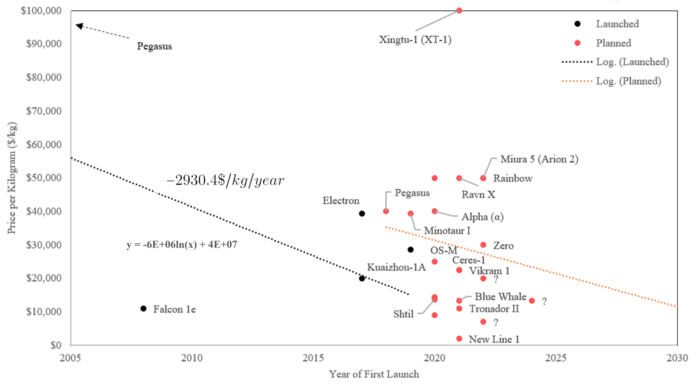
The following plots have been built using a database our team built and plan upgrade regularly throughout time. Main sources of information are SpaceFund.com, Newspace.im and small launcher companies' websites and user guides.
Using a simple linear regression model, we can find a decreasing cost of: $$-2930.4\$/kg/year$$ This means that costs for launch are project to decrease by $2930.40 per year. This is a rough estimate and data is still being collected to make this model more accurate as small launchers are relatively new and data is scarce.
The physics of launchers is governed by the Rocket Equation:
$$\Delta V = v_e \log(\frac{m_0}{m_f})$$
<math> \Delta V </math> is the change of velocity available to the missile
<math> m_0 </math> is the initial wet mass
<math> m_f </math> is the (final) dry mass
<math> v_e </math> is the effective exhaust velocity
Alignment of Strategic Drivers
Positioning of Company versus Competition
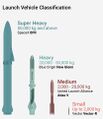
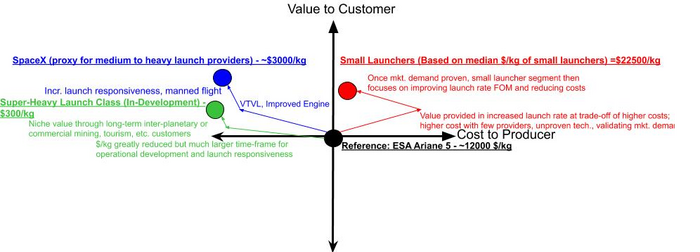
The first graph depicts the positioning of the small launcher market with respect to the medium, heavy, and super-heavy launch markets. Larger launchers, such as SpaceX's Falcon 9 rocket, are able to provider cheaper costs per kilogram with high reliability which explains their positioning as cheaper producers and improved value. Small launchers on the other hand cost more per kilogram than the other launchers but the overall launch cost is lower overall, the launch frequency is likely to be higher because customers do not need to wait for ride-sharing to be sorted out for payloads, and the reliability is supposedly similar although most are as un-proven as the conventional launchers.
The micro- and nano- launch markets are much smaller and unproven so therefore not shown. However, the value of those two markets would be more niche in providing smaller, more specified payloads and thus more expensive with respect to $/kg albeit it at the tradeoff of likely higher launch frequencies and lower overall costs.
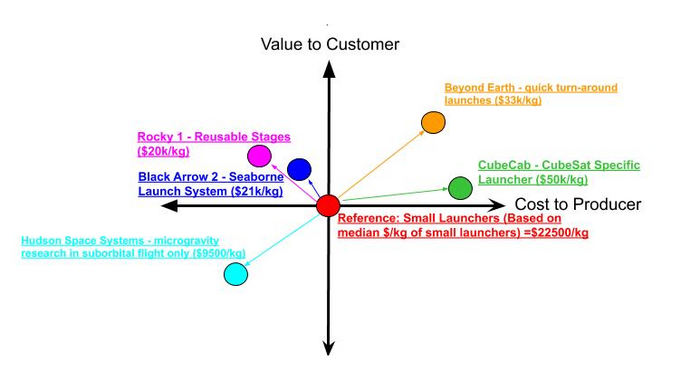
The above graph depicts the positioning of a standard small launch company (based upon the average small launcher cost per kilogram (average frequency of launch is difficult to assume due to low available data but would be a better reference and indicator of value) based on the suggested FOM introduced by small launchers. As seen, various small launch vehicle providers are attempting to bring value through respectively unique means. Some are attempting to introduce reusable stages similar to SpaceX's Falcon 9 to small launchers, others are attempting to narrow in on the niche of cubesats, some are attempting to focus on seaborne launch which reduces the costs of aborting launch and clearing an area/waiting for weather, and so on. Although some competitors are increasing costs in order to accommodate more niche markets while others are pursuing more advanced, riskier technologies to reduce overall costs, all are attempting to differentiate their service from other competitors in order to extract value from their own niche and remain profitable in their own competitive space.
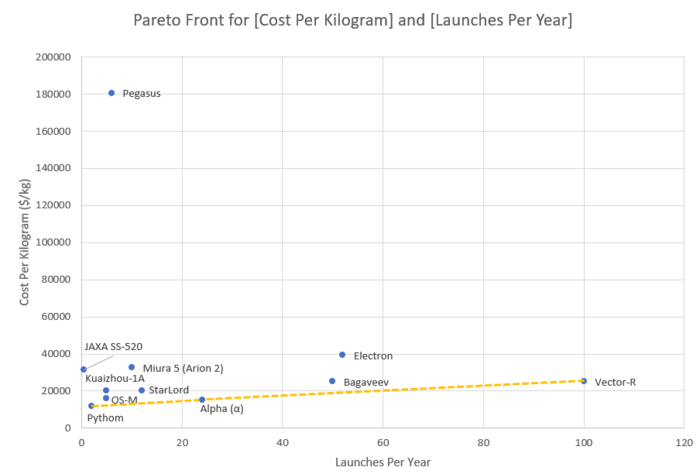
The pareto front below is not based on time but rather cost per kilogram and launches per year (also described as launch frequency/responsiveness). As seen, the Pythom, Alpha, and Vector-R launchers are pareto dominant whereas the other launchers are dominated alternatives. Of note, however, is that many, many launchers (150+) did not have data publicly available on both Figures of Merit and therefore were omitted from the data set. Furthermore, some launchers such as Pythom, are still in the developmental stages are projecting these launch costs and frequencies despite having never operationally proven these figures. Other launchers, some as the SS-520, Pegasus, and Kuaizhou-1A have been operationally proven with several successful launches. Currently, small launch companies are being reached out to manually in order to inquire about projections and more data is being continually added to the set as they respond. The current pareto optimal alternatives are expected to shift as more are added and the model can be improved by differentiating between pareto optimal launchers that are operational and those that are not yet launched. Finally, at $22,500, the reference company above would be pareto dominated by all other small launchers currently on the market. This means that the reference company should focus on both decreasing launch costs and increasing launch frequency.
Technical Model: Morphological Matrix and Tradespace
The *Responsiveness* of SLVs (Small Launch Vehicles) is by far the main differentiator of this market segment. Building such a model for responsiveness (which is based on organizational principles rather than physical principles) is complex and very little data is available at this granularity. For these reasons we decomposed this figure of merits into a sum of components on which we have actual data, or can do an educated guess with limited uncertainty in terms of factors at play and relative magnitudes. We used the SLV databases already mentioned in previous sections, manufacturers' websites, and for data only available for heavy launch vehicles, we scaled them.
For simplicity, we decide to use *lead time* as a proxy for Responsiveness: it is defined as the average duration between the order from the customer and the actual launch provided by the SLV services company. It assumes that a contract already exists between the two sides, but the chronometer starts when the actual orbit parameters, launch date and other specifications are communicated. Delays are very frequent, so we decompose responsiveness in the following way:
Responsiveness (days): $$R = \sum D_{\text{Launch Prep. Phases}} + \sum P_{\text{Delay Likelihood}} \cdot D_{\text{Delay}}$$ $$R = D_{1} + D_{2} + D_{3} + D_{4} + D_{5} + D_{6} + P_L D_{L-Delay} + P_S D_{S-Delay}$$
With (in Days):
S/C mating onto adapter: $$D_{1} = 3 \frac{m}{2000} $$ S/C mating into launcher: $$D_{2} = 5 \frac{m}{2000}$$ Fairing installation $$D_{3} = 1 $$ Launchpad preparation: $$D_{4} = 7 + 3 N + 2 S$$ S/C-Launcher Mission definition (trajectory, perf...): $$D_{5} = 15 - \frac{N}{2} - \frac{3}{2} S$$ Fuel system of main stage: $D_{6} = 2 $ for SRMs (solid rocket motors) ; $D_{6} = 6 $ for liquid rocket engines
Delays:
- Launcher
Likelihood: $$P_L= 0.3*\frac{m}{2000} + P_1 + P_2 $$ with <math> P_1 = 0.05 </math> if reused launcher (0 otherwise) and $P_2 = 0.1$ for liquid rocket engines (0 otherwise). $$D_{L-Delay} = 10$$
- Satellite/Spacecraft S/C
Likelihood: $$P_S= 0.05*\frac{m}{2000} $$ $$D_{L-Delay} = 20$$
Parameters: m payload mass capacity (mass of the spacecraft, S/C) 0<m<=2000kg N number of launchpad sites available (hypothesis: optimized spreading among the conventional inclination values used for LEO missions). 0<N<=8 S number of rocket stages 0<S<=3
“𝛿0” Disposable vs reused launcher main stage “𝛿1” Propellant type for main stage (solid vs liquid)
Comments: Phases that can be conducted in parallel of other “constraining” tasks (i.e. on the critical path of the supply chain) have been included in phases done in series. N is a variable that describes the ability of the company to launch from different sites at different inclinations, whether it is a fixed launchpad or a movable one (the more launchpad sites available, the easier the mission definition phase, the shorter the wait for an available site, but the less ready to go)
$$\Delta V = \text{Isp} \cdot g_0 \log (R)$$
$$ \frac{\partial \Delta V}{\partial \text{Isp}} = g_0 \log (R)$$
$$ \frac{\partial \Delta V}{\partial R} = \frac{\txt{Isp} \cdot g_0 }{R}$$
$$ \frac{Isp_0}{\Delta V_0} g_0 \log (R_0) = 0.99$$
$$ \frac{R_0}{\Delta V_0} \frac{\txt{Isp_0} \cdot g_0 }{R_0} = 0.43 $$
