Difference between revisions of "Laser Confined Nuclear Fusion"
| Line 63: | Line 63: | ||
As a duopoly, both NIF and LMJ exhibit monopoly elements as the only firms with the ability to conduct both High-Energy Density (HED, typical for national nuclear security development) and fusion experiments. Each offer a unique product in terms of the parameters of the experiments such as laser power, temporal pulse shape, diagnostics, and target design resources. They are unique in that they are run by two governments, each with a contingent of loyal facility users in the queue hoping to verify their physics models. NIF and LMJ appear to be exhibiting behavior consistent with both the Cournot’s Model and the Bertrand’s Model [11], as firms that definitely respond to each other’s moves (Bertrand model) but not likely to reach a Nash Equilibrium due to the lack of predictable best response functions. This industry is in its infancy in terms of demonstrating fusion viability and focuses mainly on exploring alternative methods of creating a fusion environment rather than solely focusing on responding to competing partner “moves”. | As a duopoly, both NIF and LMJ exhibit monopoly elements as the only firms with the ability to conduct both High-Energy Density (HED, typical for national nuclear security development) and fusion experiments. Each offer a unique product in terms of the parameters of the experiments such as laser power, temporal pulse shape, diagnostics, and target design resources. They are unique in that they are run by two governments, each with a contingent of loyal facility users in the queue hoping to verify their physics models. NIF and LMJ appear to be exhibiting behavior consistent with both the Cournot’s Model and the Bertrand’s Model [11], as firms that definitely respond to each other’s moves (Bertrand model) but not likely to reach a Nash Equilibrium due to the lack of predictable best response functions. This industry is in its infancy in terms of demonstrating fusion viability and focuses mainly on exploring alternative methods of creating a fusion environment rather than solely focusing on responding to competing partner “moves”.<br> | ||
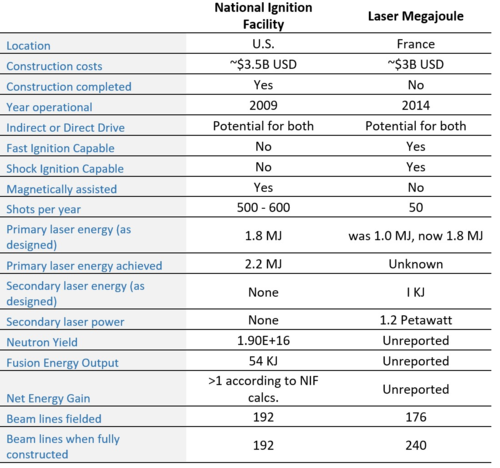
Table 3.1: NIF and LMJ Facilities at a glance | |||
'''Table 3.1: NIF and LMJ Facilities at a glance'''<br> | |||
[[File:Team4-Comp-1.png|500px]] | [[File:Team4-Comp-1.png|500px]] | ||
| Line 82: | Line 84: | ||
A2- Shorter term venture of either improving the optics damage threshold or living with the costs associated with operating the laser at higher fluences to reach greater energy levels. | A2- Shorter term venture of either improving the optics damage threshold or living with the costs associated with operating the laser at higher fluences to reach greater energy levels. | ||
[[File:Team4-Comp-2.png]] | [[File:Team4-Comp-2.png]]<br> | ||
Figure 3.1: Potential tradespace for a 2-player game along a two-dimensional Pareto Front using Neutron Yield and Laser Energy between NIF and LMJ [8,9,10] | |||
'''Figure 3.1: Potential tradespace for a 2-player game along a two-dimensional Pareto Front using Neutron Yield and Laser Energy between NIF and LMJ [8,9,10] | |||
''' | |||
==Technical Model== | ==Technical Model== | ||
Revision as of 15:09, 25 November 2020
Technology Roadmap Sections and Deliverables
- 2ICF - Laser Confined Nuclear Fusion
Roadmap Overview
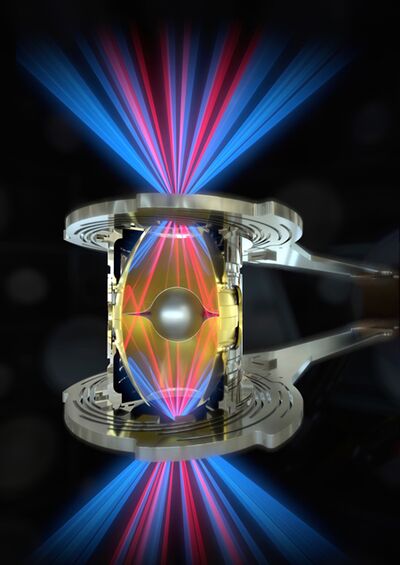
The working principle and architecture of Laser Confined Nuclear Fusion is shown in the schematic below.
Nuclear fusion power generation fundamentally consists of fusing atoms to form heavier ones with a release of energy through neutrons. One of the main technology branches for demonstrating fusion power is Inertial Confinement Fusion, ICF which involves rapidly compressing a D-T (Deuterium-Tritium) fueled target pellet using some of the world’s most powerful lasers. The National Ignition Facility, at LLNL employs 192 UV laser beams at ~2MJ to converge on a gold cylinder, the size of a dime to generate x-rays and accelerate the fuel radially inward in less than 1 billionth to produce helium and high energy neutrons that could be captured to create a future energy source.
Design Structure Matrix (DSM) Allocation
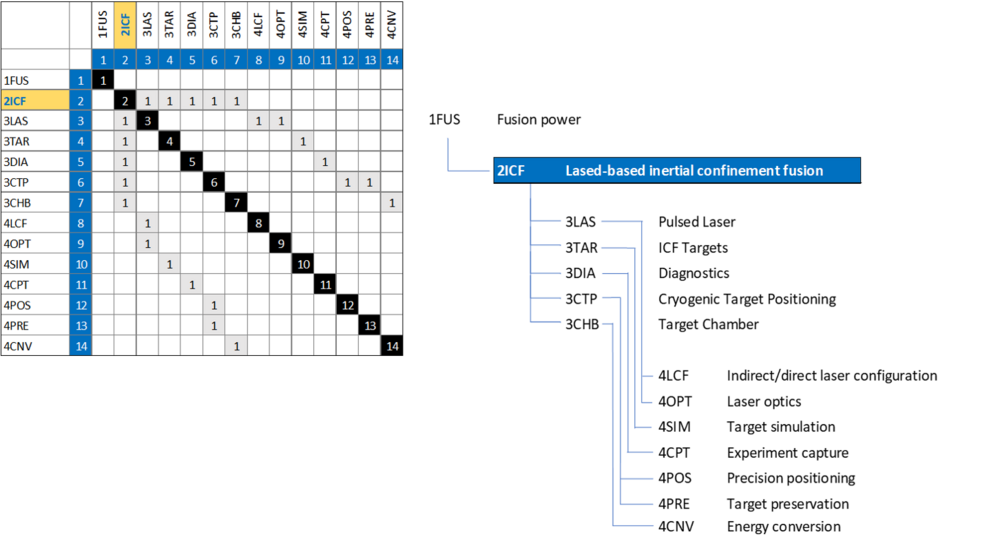
The 2-ICF tree shows us that Laser Confined Nuclear Fusion is part of larger global Nuclear Fusion Power initiative to harness fusion power. The DSM and tree both show that 2-ICF requires the following technologies at the subsystem level 3: 3LAS Laser, 3TAR ICF Targets, 3DIA Diagnostics, 3CTP Cryogenic Target Positioning, and 3CHB Target Chamber. Each level 3 subsystem also require enabling technologies shown as level 4 systems.
Roadmap Model using OPM
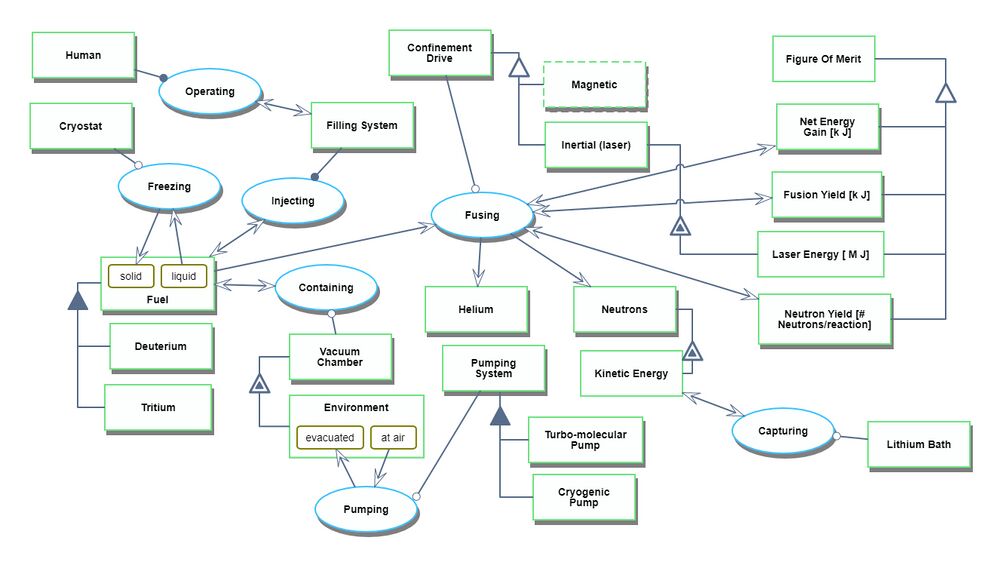
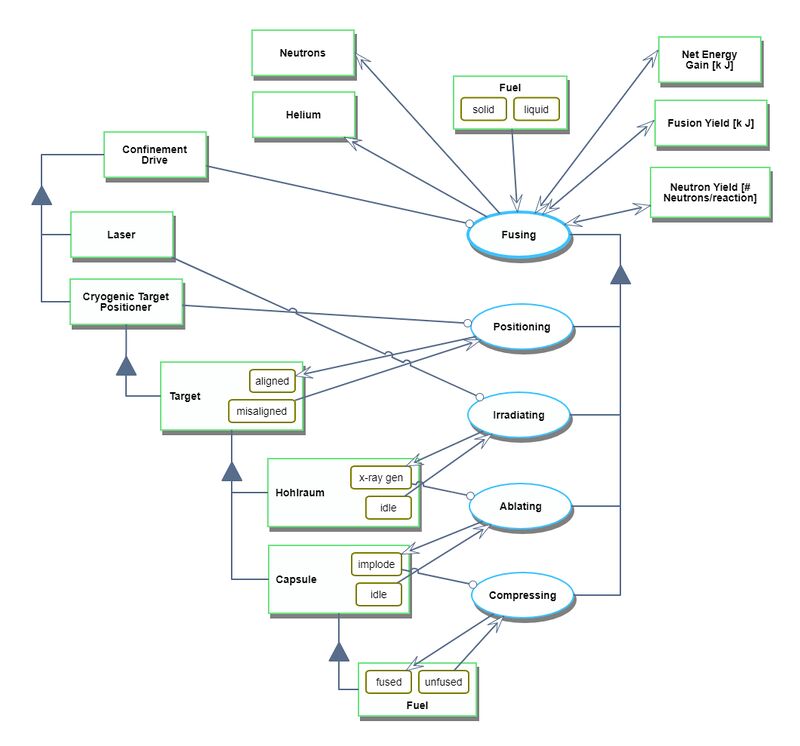
The Object-Process-Diagram (OPD) of the 2ICF Laser Confined Nuclear Fusion is provided in the figure below. This diagram captures the main object of the roadmap, its various processes and instrument objects, and its characterization by Figures of Merit (FOMs). The Fusing Process is unfolded to show sub-processes and their instrument objects.
Unfolding the Fusing Process at level SD1
An Object-Process-Language (OPL) description of the roadmap scope is auto-generated and given below. It reflects the same content as the previous figure, but in a formal natural language.
Figures of Merit
The table below shows a list of FOMs by which Laser Confined Nuclear Fusion, LCNF can be assessed. FOMs on this list related specifically to fusion reactions, such as neutron and fusion yield are similar to other confined fusion experiments. For LCNF, the key FOMs are experiment implosion velocity, laser energy and neutron yield. Fusion yield is intrinsically related to neutron yield.
Important FOMs such as implosion velocity and ITFX can be calculated from the equations in the table below. However, an understanding of neutron yield and thus fusion yield is found through both simulations and experiments in LCNF facilities.
Over the last 50 years, development of LCNF facilities enabled increases in laser energies (delivered to D-T fuelled targets) by 5 orders of magnitude. The National Ignition Facility, NIF at LLNL contains the world's most powerful laser.
Alignment with Company Strategic Drivers
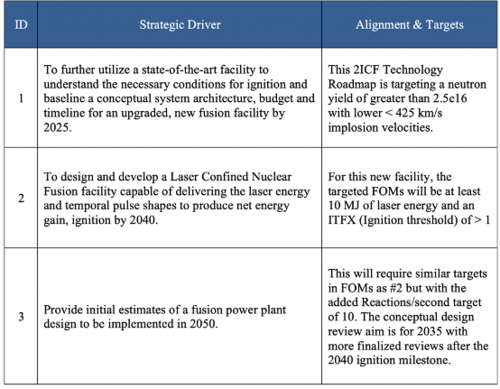
Our “company” is a government contractor that is looking to improve near term efficiencies and gains in Laser Confined Nuclear Fusion as well as develop the next generation world-class laser facility. This will not only aid in further development of harnessing fusion as an alternative renewable energy source but also allow for a suite of improved quality experiments for stockpile stewardship. The table below shows the three main strategic drivers and the necessary alignment of the 2ICF technology roadmap with them.
Positioning of Company vs. Competition
As mentioned earlier, inertial confinement fusion and magnetic confined fusion are primary branches of nuclear fusion research. In inertial confinement fusion (ICF) devices, high-powered, high-energy laser systems are used to drive the fusion reactions are typically so costly to design, build, and maintain that ICF devices are typically government funded ventures. The three most prominent devices/facilities are NIF, LMJ, and SG-III. SG-III, consisting of only a fraction of the beam lines and energy delivery capabilities of its 2 industry competitors, was designed to study fusion parameters, not to achieve net fusion gain. Therefore, in this technology-intensive market, NIF and LMJ can be considered a competitive duopoly as the only 2 devices capable of performing experiments with the possibility of achieving ignition.
As a duopoly, both NIF and LMJ exhibit monopoly elements as the only firms with the ability to conduct both High-Energy Density (HED, typical for national nuclear security development) and fusion experiments. Each offer a unique product in terms of the parameters of the experiments such as laser power, temporal pulse shape, diagnostics, and target design resources. They are unique in that they are run by two governments, each with a contingent of loyal facility users in the queue hoping to verify their physics models. NIF and LMJ appear to be exhibiting behavior consistent with both the Cournot’s Model and the Bertrand’s Model [11], as firms that definitely respond to each other’s moves (Bertrand model) but not likely to reach a Nash Equilibrium due to the lack of predictable best response functions. This industry is in its infancy in terms of demonstrating fusion viability and focuses mainly on exploring alternative methods of creating a fusion environment rather than solely focusing on responding to competing partner “moves”.
Table 3.1: NIF and LMJ Facilities at a glance
Although NIF and LMJ do not seemingly engage in sequential game play, they do appear to actively respond to each other’s achievements or advancements with initiatives of their own. When LMJ was first announced, the system was designed to reach 1MJ (starting point B-LMJ shown in Figure 3.1). After NIF attained their energy goal of 1.8MJ (A-NIF in Figure 3.1) but did not reach their neutron yield expectations, LMJ increased their energy goal to 1.5MJ (B1 point shown in Figure 3.1). NIF then pushed the boundaries of their laser driver up to the optics damage threshold to produce 2.2 MJ. LMJ likely realized that for them to be seen by their supporters as a leader in this industry, they announced that their design goals are now 1.8MJ (B2 point in Figure 3.1). [8,9,10]
LMJ then announced the addition of a Petawatt laser to supplement the laser driver that positions them to attain the B2 point which would dominate the A-NIF point (current NIF position). In response to LMJ’s secondary laser, NIF is exploring 2 strategy options:
A1- Longer term venture of improving target design inefficiencies (introducing magnetically assisted devices) to raise neutron yield while understanding that the laser driver can only produce so much energy before optic damage is cost prohibitive
A2- Shorter term venture of either improving the optics damage threshold or living with the costs associated with operating the laser at higher fluences to reach greater energy levels.
Figure 3.1: Potential tradespace for a 2-player game along a two-dimensional Pareto Front using Neutron Yield and Laser Energy between NIF and LMJ [8,9,10]
Technical Model
In order to assess the feasibility of technical targets at the level of the 2ICF roadmap it is necessary to develop a technical model. In order to understand important design decision variables for Laser Confined Nuclear Fusion, research was conducted. We found from data that there are at least seven key variables that must be considered. The table below shows these along with the unique choices for each.
The figure below was created to better explain each of decision variables in pictorial form. There are 2 variables for the laser system. These are the UV light energy delivered to the target and the temporal shape at which this energy is delivered. A further two variables pertain to the Hohlraum structure in terms of size (scale) and design shape. The Hohlraum is utilized in indirect drive laser confined nuclear fusion experiments to covert the UV light into x-rays that compress the fuel capsule. The remaining three variables cover the capsule radius, material, and a variable for the D-T (Deuterium-Tritium) fuel ice-layer known as the K-factor. This factor provides a normalized number for the summation of all defects and sphericity of the ice layer. It essentially indicates a fuel quality with 1 being optimal.
As the National Ignition Facility, NIF is at the forefront of Laser Confined Nuclear Fusion, the subsequent data gathered is all from NIF. No other facility is currently able to produce anywhere near the laser energies and neutron yields. The table below shows three experiments conducted over the last 7 years, important decision variables and the resulting neutron yield and implosion velocity FOMs. These are colored keyed such that they relate back to the variables shown in morphological matrix.
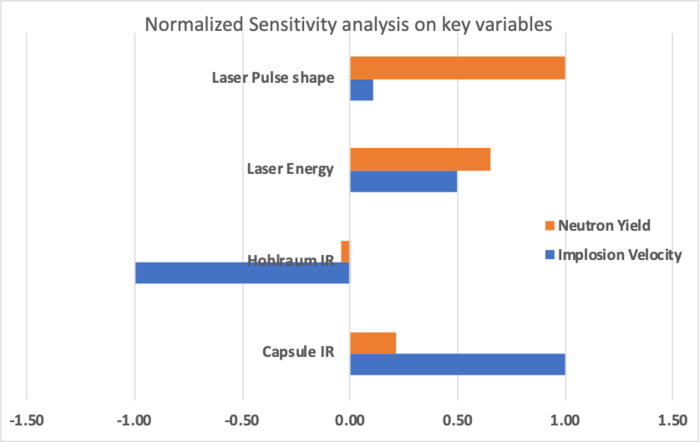
Implosion velocity and neutron yield are the two FOMs that were explored in a sensitivity analysis. To assess the former FOM, partial derivatives of the velocity implosion were calculated with respect to the capsule inner radius, hohlraum inner radius and laser energy. From these partial derivative equations, we can calculate the change in implosion velocity from unit changes of each variable. It is important to note that the NIF experiment, N180128 was used as the benchmark. This experiment had an implosion velocity of 425 km/s and neutron yield of 1.8e16. When understanding the neutron yield sensitivity to these same four parameters (above), experimental data gathered from NIF over the last 10 years had to be used. The plot below shows the sensitivity results for implosion velocity and neutron yield with respect to four chosen decision variables.
Financial Model
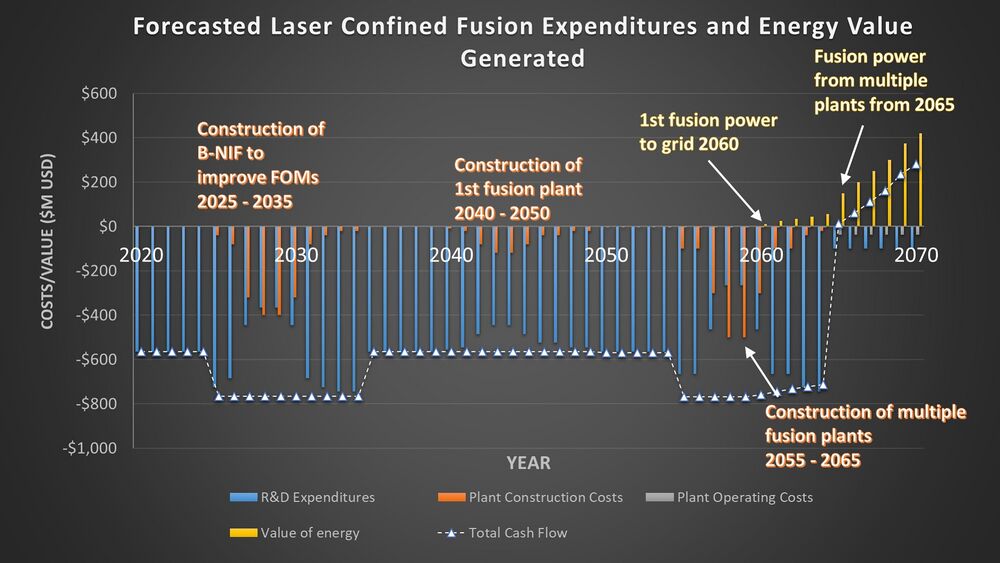
An analysis was conducted to understand the financial prospects of high-gain inertial fusion power highlighting the extensive investment required and the eventual value of energy produced. Since the project is federally funded, and does not generate sales or income, the analysis presented forecasts a timeline where the project begins to generate a “profit” as the value of the energy produced exceeds project costs. Laser confined fusion technology is in early development where current FOMs need to see significant improvement for the project to begin construction of fusion power plants. Moreover, most of the enabling fusion power plant technologies such as neutron energy capture, low-cost target fabrication, and high repetition rate laser drivers are at low readiness levels. The forecast shown below represents a future scenario where fusion FOM levels improve significantly from 2020 - 2035 and federal funds begin to move towards the development of a fusion plant in 2035.
Future Scenario
2020 – 2035 Significant improvements achieved showing energy gains of 1000 prompting push for fusion plant development using R&D Expenditures
2040 – 2050 Construction of 1st fusion plant with significant R&D Expenditures improving fusion power plant technologies
2050 – 2055 Significant use of R&D Expenditures to refine the fusion plant in preparation for demonstration of power to the grid
2055 – 2060 Construction of multiple fusion power plants based on lessons learned from 1st fusion plant
2060 – First power to the grid achieved
2065 – Significant value from energy reached prompting end of project and reduction in overall federal funds for research
Cost Assumptions:
• R&D Expenditures – U.S. laser confined fusion research budget currently at ~$565M (FY’20) that fluctuates based on construction projects and perception of need
• Plant Construction Costs – Anticipated future construction costs based on current power plant costs, ~$1,500/kWe (USD)
• Plant Operating Costs – Anticipated future operating cost based on current nuclear power plant operating costs of ~$20/kWe-yr (USD)
Value of Energy Assumptions:
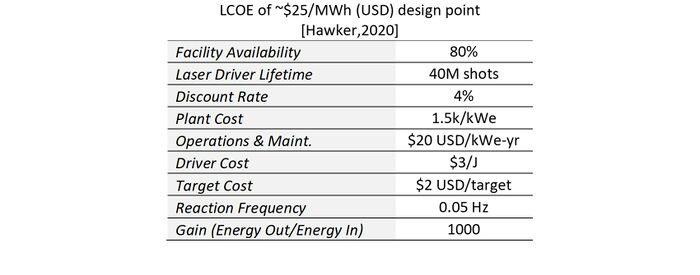
While fusion power may offer many benefits to society, its levelized cost of electricity (LCOE) may drive future adoption. In an optimization study performed by Hawker [Hawker,2020], an LCOE of less than $25/MWh – the price point needed to compete with other renewable sources of energy – could be attained with the following parameters:
• 1st Fusion Plant – 1.2M reactions/yr, 1.4E6 MWh/yr, $25/MWh
• Multiple Fusion Plants – Scaling of the 1st Fusion Plant based on redirected funds to construct multiple plants from 2055 - 2065
List of R&T Projects and Prototypes
Laser confined fusion projects include:
- Laser driver power – Increasing the laser drive power enables new and promising experimental shot configurations. To increase the laser power delivered to the target, a number of projects aim to improve optics related FOMs. One FOM limiting the laser power is the optic damage threshold in J/cm2. These projects include exploration of optics conditioning methods, improving surface quality, improving optical material purity, and management of scattered light to significantly improve the overall damage threshold to allow for higher fluences of UV laser light.
- Magnetically assisted drive –
- Target optimization – Target design consists of many variables thought to be sensitive to fusion yield FOMs. Modeling has shown that one design variable in particular that can have a profound effect is the Hohlraum shape. A number of promising shape candidates are being modeled and explored including some resembling rugbies. Since laser power is directed to the Hohlraum inner surfaces, these new geometries offer a way to manipulate the plasma generated and imparted to the fuel capsule.
- Diagnostics improvements –
Key Publications, Presentations and Patents
For the patent analysis, we initially conducted a search using the U.S. Trademark and Patent Office search application but struggled to find international fusion technology patents such as those related the large-scale ITER (originally the International Thermonuclear Experimental Reactor) fusion facility development effort [4]. Ultimately, we performed our search and analysis using the World Intellectual Property Organization’s (WIPO) international patent database to better understand the patent landscape for the broader nuclear fusion technology field (as opposed to our more specific laser-confined variant).
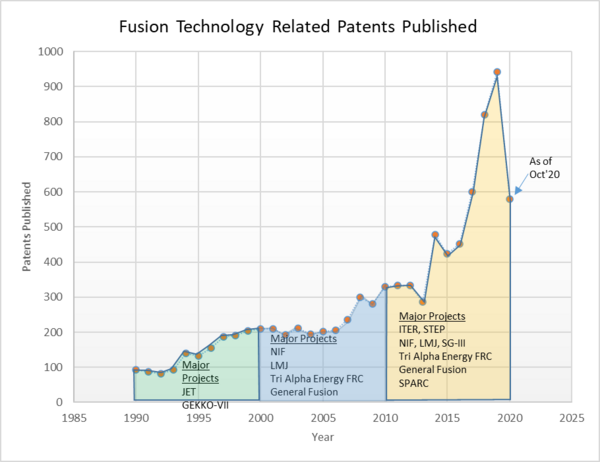
A Boolean search using “AND” phrases such as: nuclear fusion, confined fusion, and fusion reactor, yielded 9,181 published patents in the last 30 years (1990 – 2020). To better understand the technological interest and progress in the field, we charted the patents published by year. The patents published steadily increases from 1990 – 2010 and can perhaps be attributed to the increase in worldwide fusion research investments as it becomes more apparent that the world’s future energy needs may exceed the existing fossil-fuel based infrastructure.
Figure 2.1: Fusion technology related patents published over the past 30 years, compiled using the WIPO international IP database search application.
In 2016, the U.S. based Advanced Research Projects Agency – Energy (ARPA-E) commissioned a nuclear fusion technology global IP landscape study that helps to validate our search results. When comparing Figure 2.1 and Figure 2.2, the steady increase trend from 1985 to 2013 are similar in both plots but our IP analysis (Figure 2.1) reports roughly twice the number of patents. This significant deviation is likely attributed to the variation in parameters (and definition) used to identify “fusion technologies”. The key takeaway however is that the fusion technology IP trend indicated by both figures indicate that this field is undergoing significant technological growth.
iRunway’s report in 2016 postulates that magnetic confinement and inertial confinement methods dominate nuclear fusion technology patenting activity and reports that the United States leads the IP space, holding the most fusion technology IP assets (1982). As shown in Figure 2.3, a significant cluster of IP assets are collectively held by European countries as well.
Figure 2.3: Geographical ownership of nuclear fusion technology assets globally as reported by iRunway in 2016 for ARPA-E.[5]
Two of the more interesting patents we reviewed involve the design of a NIF-based fusion-fission power plant (US 9,171,646 B2 [6]) and the design of magnetically assisted targets (US 10,134,491 B2 [7]) both of which belong to the Lawrence Livermore National Laboratory. Curiously, we did not find a patent claiming the design of the laser-based fusion reactor (reactor to prove efficacy of fusion power, not the power generating plant). The lack of a design-protecting patent may be why the LMJ facility in France and the Shenguang-III facility in China closely resemble the physical architecture of the NIF.
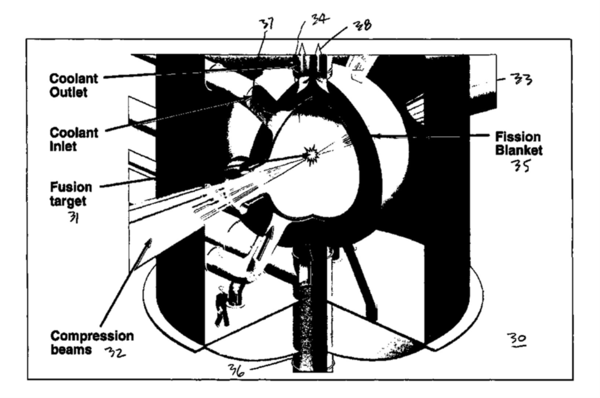
The “Control of A Laser Inertial Confinement Fusion-Fission Power Plant” patent depicted in the schematic shown in Figure 2.4 drew our attention for its forward-looking mentality as the vehicle to eventually extract energy from fusion reactions based on learnings from NIF experiments. The patent itself describes the fusion plant driver (laser-based), reaction outputs (fusion neutrons), an energy collecting fission blanket, and a coolant system that transfers the energy from the fission blanket as heat. This may be one of just a few large-scale designs protected for a laser-based confined fusion power plant. Conversely, some ITER member nations are already planning for Tokamak-based fusion power plants with the expectation that ITER will provide the technical knowhow.
Figure 2.4: U.S. Patent claiming the design of a nuclear fusion power plant that used lasers for compression and a fission blanket to capture energy. [6]
To dive deeper into the laser confined fusion technology branch (our technology roadmap topic) within the broader fusion technology landscape, we reviewed a paper recently published in 2019 by the International Atomic Energy Agency entitled “Progress of indirect drive inertial confinement fusion in the United States” that provides an update to U.S. based ICF development. To learn more about the ICF competitive landscape, we reviewed a paper describing LMJ and the PETawatt Aquitaine Laser (PETAL, a multi-Petawatt beam coupled to LMJ [8]) laser’s status entitled "The Laser Mega-Joule: LMJ &PETAL status and Program Overview”. NIF and LMJ (including PETAL) are known as two of the premier ICF research facilities in the world. An article published in Science Magazine in 2015 explores the differences between the 2 facilities [9].
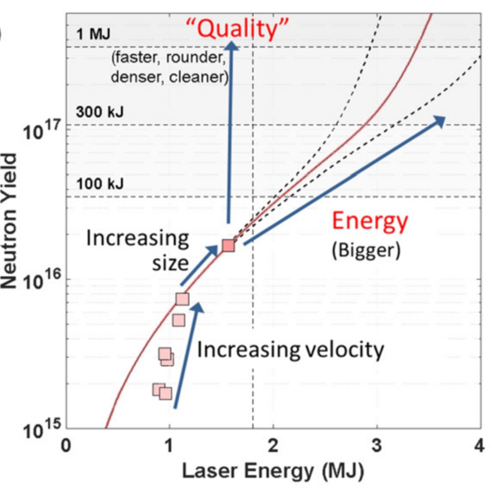
Figure 2.6a: Notional relationship between laser energy and neutron yield and the expected curve changes due to capsule upsizing.
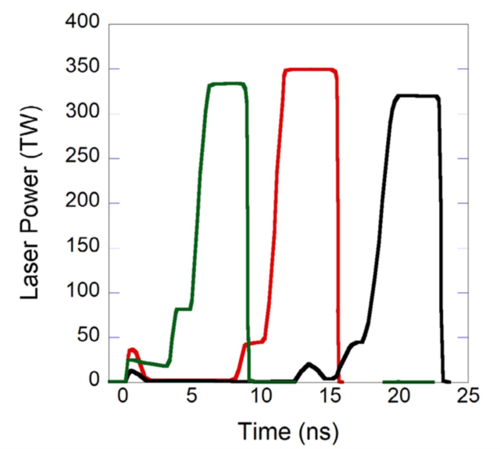
NIF has been operational for over a decade now and is known as one of the most energetic laser systems capable of producing greater than 2MJ peak during ICF shot operations. Designed for 1.8MJ, the facility expected to reach ignition in 2013 but did not reach that ambitious goal due to unexpected target compression uniformity issues. Since then, the focus has been to better understand the efficacy of the NIF to achieve ignition by exploring several design variables that are thought to be sensitive to one of the key objectives – neutron yield [10]. Among the variables considered are: Hohlraum (cylindrical shell used to produced x-rays when irradiated) geometry, capsule (containment for D-T fuel) size, capsule structural support and fill devices, and lastly, the laser output power and temporal beam shape directed to the Hohlraum. Modeling results shown in Figure 2.6 attempt to predict the relationship between laser energy input and neutron yield and the change in the curve when the capsule is scaled up in size.
Figure 2.6b:Temporal beam shape design variable considerations [10]
Technology Strategy Statement
A technology roadmap should conclude and be summarized by both a written statement that summarizes the technology strategy coming out of the roadmap as well as a graphic that shows the key R&D investments, targets and a vision for this technology (and associated product or service) over time. For the 2SEA roadmap the statement could read as follows and is displayed in an Arrow Chart:
Our target is to develop a new solar-powered and electrically-driven UAV as a HAPS service platform with an Entry-into-Service date of 2030. To achieve the target of an endurance of 500 days and useful payload of 10 kg we will invest in two R&D projects. The first is a flight demonstrator with a first flight by 2027 to demonstrate a full-year aloft (365 days) at an equatorial latitude with a payload of 10 kg. The second project is an accelerated development of Li-S batteries with our partner XYZ with a target lifetime performance of 500 charge-discharge cycles by 2027. This is an enabling technology to reach our 2030 technical and business targets.
