Inventory Management System
Technology Roadmap
Roadmap Overview
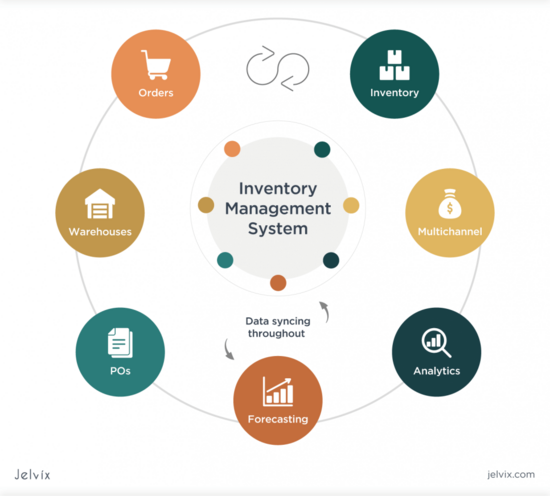
Inventory management system is a critical component of business operations' supply chain management that ensures efficient flows of materials and products from vendors to customers.
Key Goals of the SCM – inventory management system are:
- Providing timely, complete, and accurate inventory levels to managements
- Minimizing carrying costs while ensuring product availability.
- Reducing stockouts and overstock situations.
- Enhancing supply chain visibility and responsiveness.
- Streamlining operations and reducing inefficiencies.
- Lowering costs while maintaining service levels.
- Meeting customer demand accurately and on time.
- Adapting to changes in demand, supply, and market conditions.
Effective management systems provide the right products at the right time and place to meet growing customer demand. It is a critical aspect of modern business operations and plays a crucial role in achieving profitability and customer satisfaction.
*image-source - https://jelvix.com/blog/automated-inventory-management-system
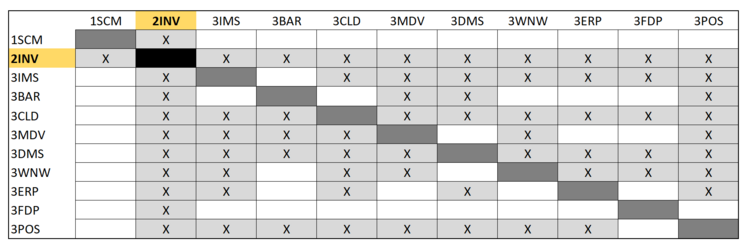
Design Structure Matrix (DSM) Allocation
DSM of the Inventory Management System:
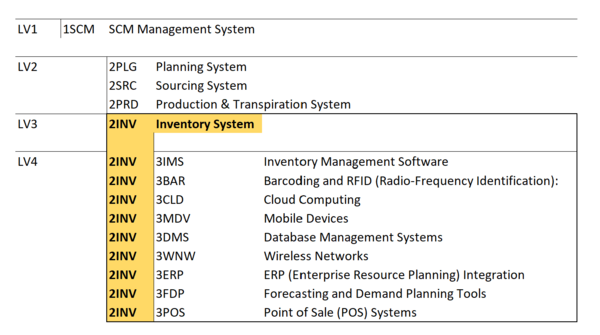
The tree structure of the Inventory Management System.
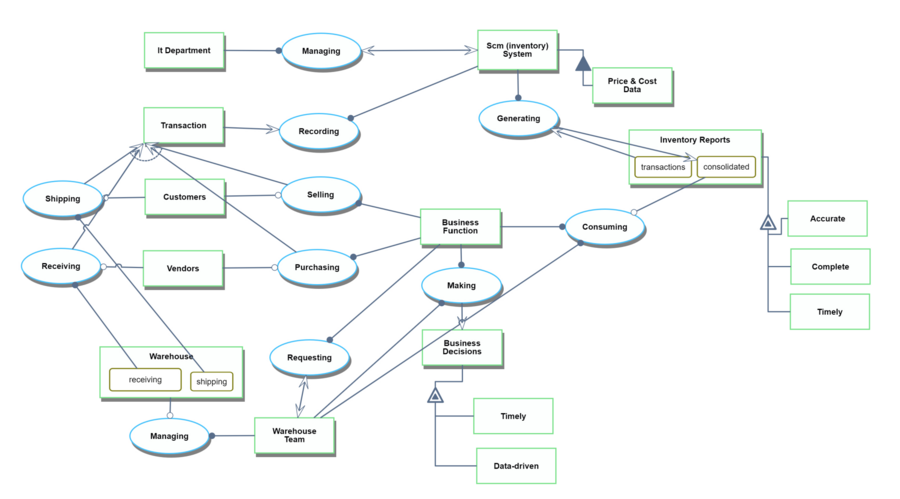
Object Process Model (OPM)
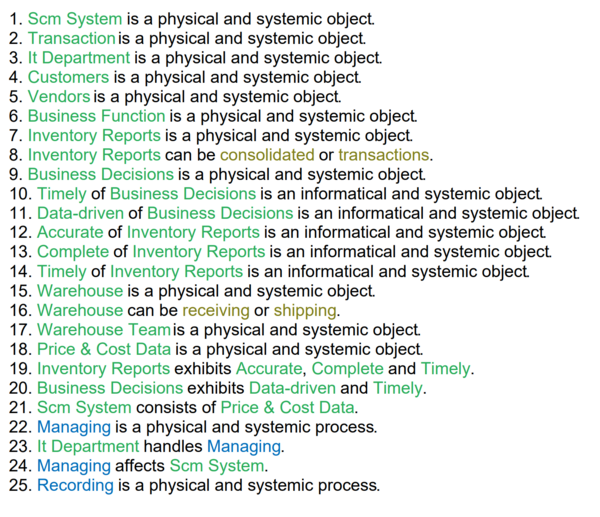
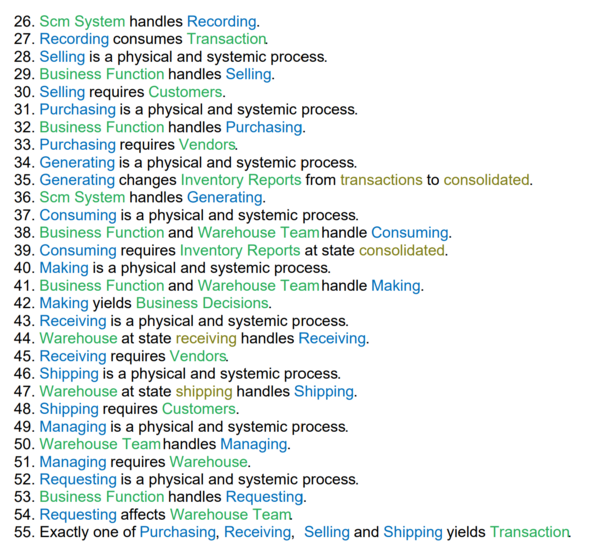
This OPM represents the Inventory Management System:
Figures of Merit (FoM)
The table below show a list of FOMs by which can assess an Inventory Management System technology:
Examples of FOM performance
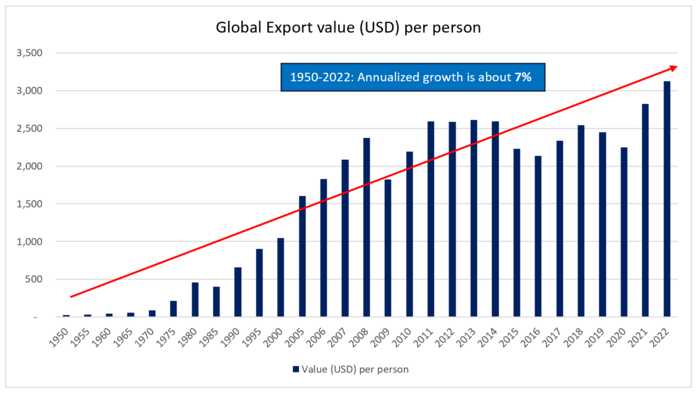
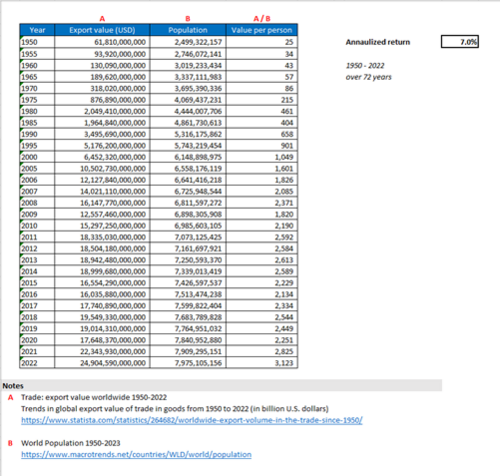
Over the last 52 years, inventory management system was improved by about 7% annualized growth based on the FoM trend indicated below:
This is an indirect approach to track technological progress as there is only limited data available related to inventory variances, time to report, % automation, etc. This information is company specific and not generally publicly available. As such, we selected the Total trade (export) value (in USD) per person with two assumptions: (1) all reported “Trade (export) value” were processed and consolidated using supply chain management systems – included in the figure means that the transactions were recorded and processed; and (2) improvements in the system can be represented with fewer resources (people) needed to process and consolidate the same amount of data. Said differently, technological progress and rate of improvement can be supported by one person processing more transaction volumes. Note that year-over-year export values can be influenced by various economic statuses.
Company Strategic Objectives
We identified strategic objectives that can stand the test of time. We want our clients to understand that we are constant, unchanging, something they can depend on. As technology improves, we can change the respective FOM and targets, without changing our strategic objectives. The table below shows our strategic objectives:
| Strategic Objective | Alignment and Targets |
|---|---|
| An efficient payment system that processes and settles transactions in near real-time. | Currently we have a transaction settlement period of 1 day and aim to decrease this to 90 seconds. |
| Our clients trust us to process their transactions in a safe and secure manner where they do not lose money. | We aim to maintain System downtime per year to less than 480s (i.e. 8 hours). In the next year we will improve our fraud prevention ratio (by at least 0.5%) and machine learning accuracy (by at least 5%) whilst maintaining or decreasing our cost base. |
| Our clients can make payments to anyone, anywhere. | We continue to grow the number of payments we process pa to more than 1bn, servicing more than 750k individual and 10k business clients in 76 countries. Our goal is to process 1% of all payments made as reported by the Bank of International Settlements. |
Positioning of Company vs. Competition
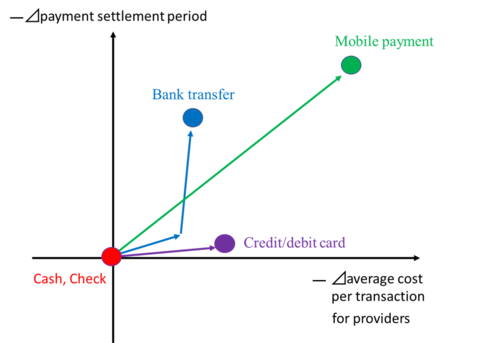
First, the following vector chart shows the competitive situation among different types of payment. The mobile payment has improved both the average cost per transaction and the payment settlement period. When it comes to a bank transfer, it gradually improved productivity, but recently banks offered RTP network, a faster clearing system in the US, so it has shortened the payment settlement period. Credit/ debit card has improved average cost per transaction by raising the precision of fraud detection.
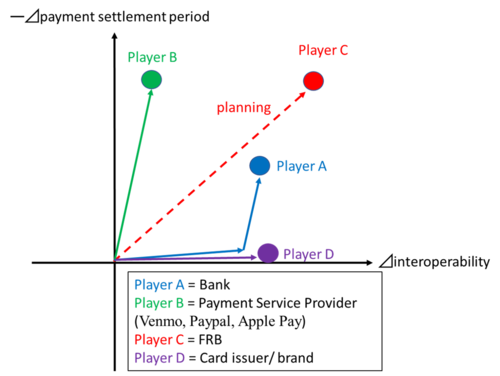
Second, the following vector chart shows the competitive situation among different companies of payment services. Here, we compare the payment settlement period and interoperability. Interoperability is related to cost because it takes money and time to get the system interoperable with other systems or services. Player C announced that it would offer a real-time payment system for everyone, including small commercial banks that are sometimes difficult to access the interbank system because of the cost level. Player A launched a faster clearing system to compete with it. Player B offers faster payment services without interoperability with other payments. Player C has extended the acceptance of merchants where users can use their payment.
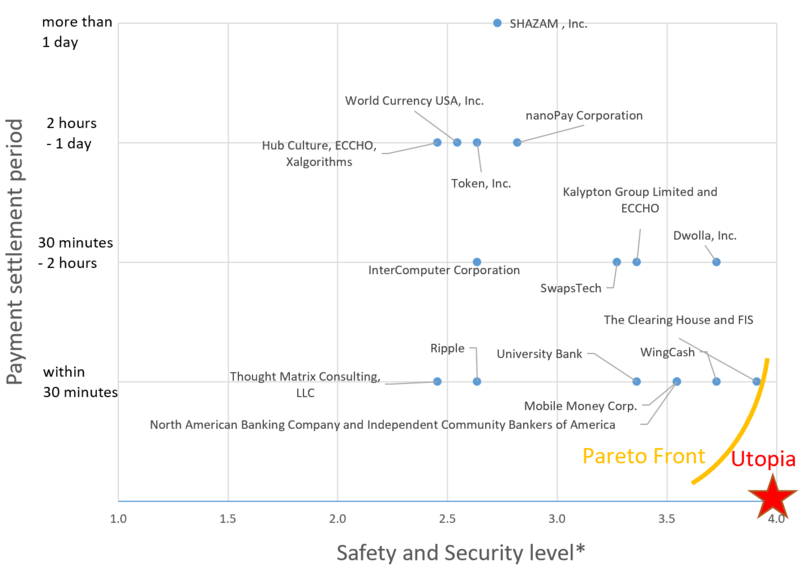
The following figure shows the trade space of the proposals for FedNow. In 2016, the Faster Payments Task Force asked for proposals of FedNow, and more than 30 companies offered the proposals. The figure shows 16 open cases of them. Due to data limitation, we used “Safety and Security level*” as the alternative for the FOM of Safety & Security, Sustainability ratio.
* We calculated “Safety and Security level” as the average level of assessment results for the following assessment criteria.
Assessment criteria:
S.1 Risk Management / S.2 Payer Authorization / S.3 Payment Finality / S.4 Settlement Approach / S.5 Handling Disputed Payments / S.6 Fraud Information Sharing / S.7 Security Controls / S.8 Resiliency / S.9 End-User Data Protection / S.10 End-User/Provider Authentication / S.11 Participation Requirements (https://fasterpaymentstaskforce.org/effectiveness-criteria-and-solution-proposals/)
The number of levels is defined as follows.
4: Very Effective / 3: Effective / 2: Somewhat Effective / 1: Not Effective
