Energy Storage via Battery
Technology Roadmap Sections and Deliverables
Our chosen Technology is that of electricity storage via battery for the purpose of vehicle mobility. We will refer to it within our descriptions as "battery" This is a level 3 technology. It serves the major subsystems found in electric vehicles
Roadmap Overview
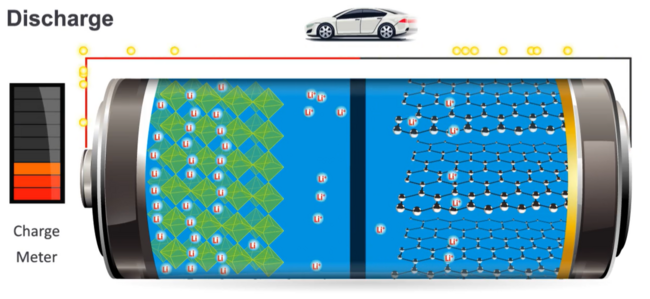
The working principle and architecture of an electrical battery are depicted in the below.
An electrical battery can store and use energy by chemical reaction. It is composed of an anode (-), a cathode (+), the electrolyte, and separator. The chemical reaction is a redox reaction caused by an electrical difference between the anode and the cathode. That is, electrons are expelled from the anode to the cathode via an external circuit and metal ion in the electrolyte receives the electrons on the cathode. This redox reaction lasts until electrical equilibrium. Although the primary battery is designed to be used once and discarded, the secondary battery can be recharged with electricity and reused. First secondary batteries based on Ni/Cd and Pd-acid were produced around 1900. After that, Ni/Zn battery which showed higher specific density appeared in the 1950s. In 1990, Lithium-ion battery (LIB) which is a major rechargeable battery today was released. The capabilities of LIB such as specific density, volumetric density, and cycle durability have improved more and more by developing new materials and the energy price is going down. These trends contribute to the growing availability of Electric vehicles.
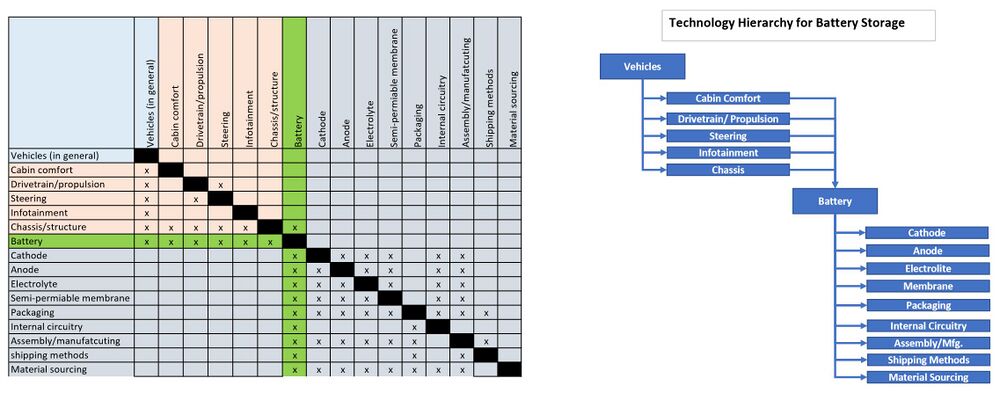
Design Structure Matrix (DSM) Allocation
Our technology of interest is identified in the DSM above with green highlighting. it is portrayed in the context of the consuming technology of interest, electric vehicles, where we identified the typical consuming technology systems for reference. The diagram on the right is a dependency tree that has been extracted from the DSM. The battery storage technology consumes technology related to battery chemistry, including cathode, anode, catalyst, and semi-permeable membrane technologies. Battery technology also consumes technology related to the design of the shipping, manufacturing, material supply chain, and internal circuitry technologies
Roadmap Model using OPM
We provide an Object-Process-Diagram (OPD) of the Battery technology in the figure below. This diagrams captures the main object of the technology (Battery), the value-generating processes and different instruments associated with their characterization by Figures of Merit (FoM).
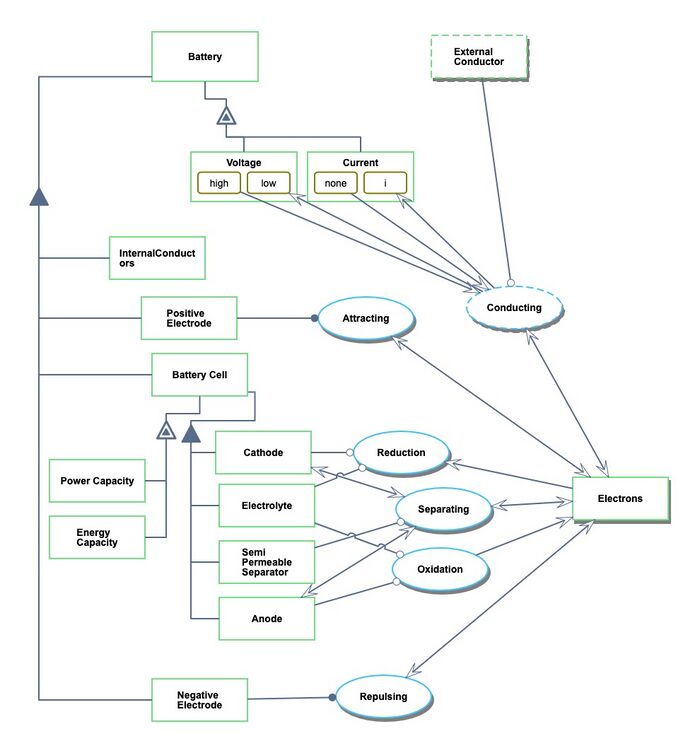
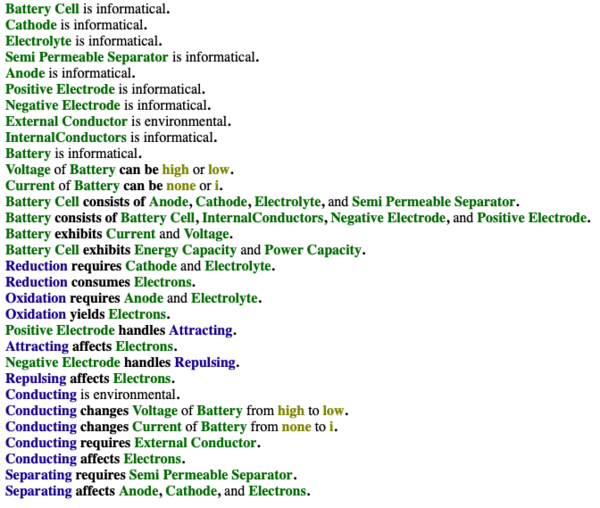
An Object-Process-Language (OPL) description of the roadmap scope is auto-generated and given below. It reflects the same content as the previous figure, but in a formal natural language.
Figures of Merit
We identify several Figures of Merit (FOMs) for the energy storage via battery technology:
- Energy density: Wh/kg
- Power Capacity cost ($/W)
- Energy Capacity cost ($/Wh)
Additional figures of merit for rechargeable battery are typically:
- Energy efficiency rate (%), energy stored / energy used to charge
- Power efficiency rate (%), power delivered / power used to charge
- Cycle life (cycles)
- Max depth discharge (%)
- quantity or rare materials needed (kg), as a potential constraint for scalability
Note: basic reminders (as we rediscovered them) about the units and relationships:
- we used traditional units of power and energy for electricity, yet in order to compare across different energy storage technologies, a reminder that Wh is a unit equivalent to J.
- Electric power: P = V * I where V is the electric potential (volts, V) and I the current (Ampere, Amp). Battery’s capacity is the amount of current that can be delivered in one hour (in Amp*h). The energy capacity is then the battery’s voltage multiplied by its current capacity.
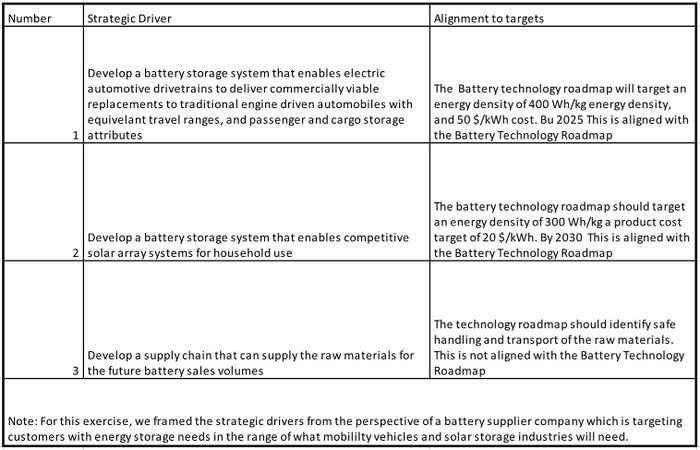
Alignment to Strategic Drivers
Positioning of Company vs. Competition
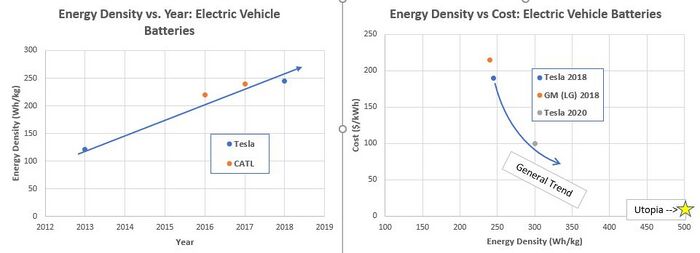
The Chart on the left shows energy density of several electric vehicle batteries from several manufacturers over time. The chart on the right compares the energy density to cost for three examples that we were able to acquire data for. In general, Lithium Ion technologies seem to be improving energy density at a rate of about 5% per year and improving in cost at a rate of about 20% per year. CATL, another leading battery manufacturer for electric vehicles, has roadmap diagrams citing energy densities at 400 Wh/kg at around 2020. A posting discussing a "Dry Battery Electrode" technology which was purchased by Tesla speaks of allowing the current 300 Wh/kg batteries and improving them to about 500 Wh/kg. Pricing data and were not available with this article, but the author was speculating at a timeframe for deployment of about 2021.
