User talk:SAF Brazil
Roadmap Creators: Gabriel Ruscalleda, Emilia Ospina Arango and Dawit Dagnaw
Time Stamp: Updated 10 October 2024
Technology Roadmap Sections and Deliverables
Our technology roadmap identifier is shown as:
- 2BSSAF - Brazil Solution - Sustainable Aviation Fuel
This indicates that we are dealing with a “level 2” roadmap at the product level, where “level 1” would indicate a market level roadmap, "level 2" would indicate our SAF Production and “level 3” or “level 4” would indicate an individual technology roadmap.
Roadmap Overview
Sustainable aviation fuel (SAF) offers a promising solution for reducing the aviation industry’s carbon footprint, but scaling its production to meet global demand presents significant challenges. Brazil is often referred to as the “Saudi Arabia of sustainable fuels” due to its significant potential and advancements in renewable energy.
This roadmap explores the dilemma of SAF scalability, focusing on two critical aspects: availability and affordability. The feedstock supply and production capacity is analyzed within the country, and innovative strategies are proposed to enhance scalability. Additionally, economic competitiveness of SAF will be evaluated and compared to conventional jet fuel, considering factors such as production costs, market incentives, and policy support in Brazil.
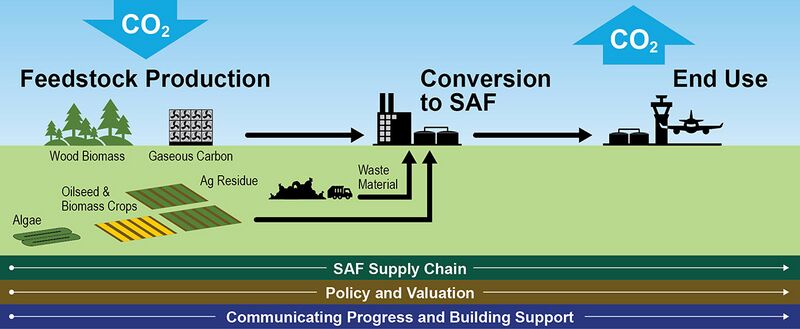
The figure below contains graphic representation of the SAF supply chain from the SAF Grand Challenge Roadmap
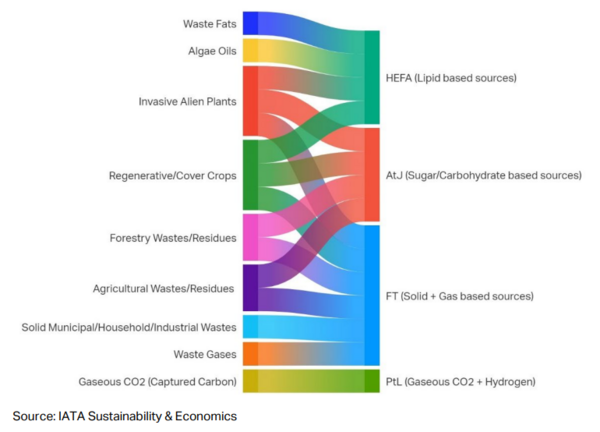
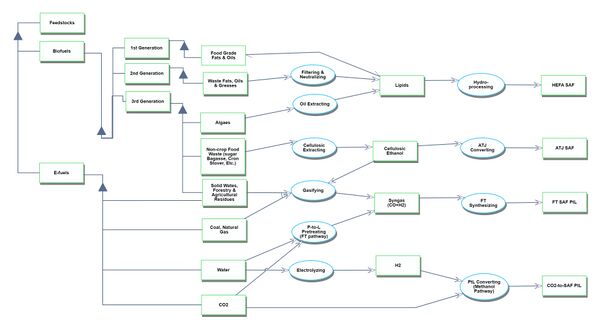
Sustainable Aviation Fuel (SAF) can be produced through various technological pathways using diverse feedstock combinations, resulting in different types of SAF. Currently, more than 11 production pathways and multiple feedstocks are under active research, with new methods and potential materials expected to emerge in the coming years. Several pathways have successfully produced drop-in fuels that meet quality standards and are compatible with existing aircraft, airplane systems, and pipeline infrastructure. Although successful test flights have been conducted using 100% SAF (neat SAF), current usage primarily involves blending SAF with conventional jet fuel in varying proportions, partly due to supply constraints. The aviation industry continues to explore and refine SAF production methods, focusing on expanding viable feedstocks, improving production efficiency, and increasing SAF yield and quality. For a comprehensive understanding of feedstocks and their associated pathways, refer to the illustration provided below.
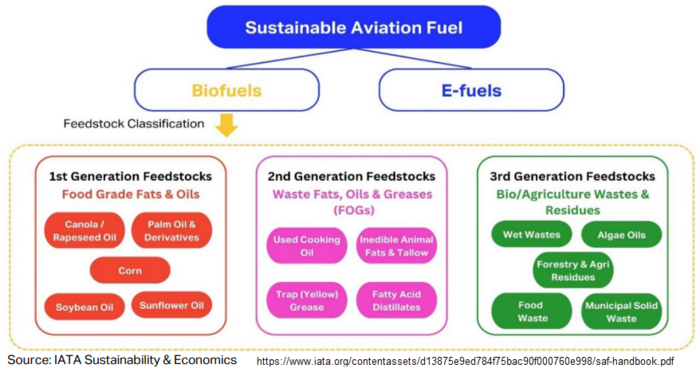
Three generations of feedstocks are defined on the IATA SAF Handbook based on their usage chronology, emission reduction potential, sustainability criteria, environmental impact, and availability:
1. First Generation (1G): Includes food-grade fats and oils like canola, palm, and soybean. While technologically mature and commercially scalable, they pose sustainability issues such as competing with food supply and high land usage.
2. Second Generation (2G): Comprises waste fats, oils, and greases (FOGs) like used cooking oil and inedible animal fats. These are more sustainable than 1G due to higher emission reduction and no additional land usage, but are more expensive due to limited supply.
3. Third Generation (3G): Encompasses biological/agricultural wastes and energy crops from degraded land, including municipal solid waste, forestry residues, and algae oils. They offer the most positive environmental impact and cost benefits but require advanced processing technologies.
Design Structure Matrix (DSM) Allocation
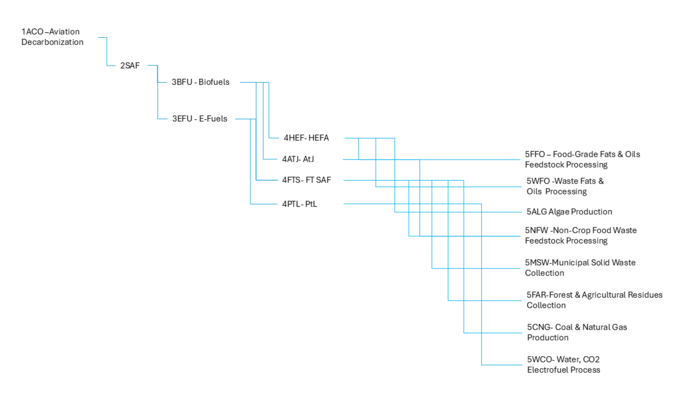
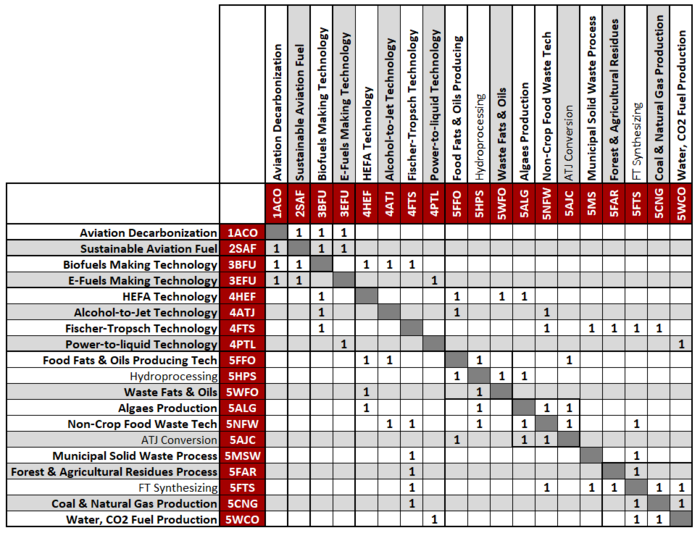
The tree below shows the relationship between other technologies related to the SAF. It is focus on the enabling technologies to SAF, considering key feedstocks and processes. Starting from our main goal to decarbonize aviation (1ACO), 2SAF plays an important role and can be decomposed in multiple technologies. Focusing on feedstock classification, SAF can be made out of two main technologies including Biofuels (3BFU) making technologies and e-fuels (3FU) making technologies such as 4HEF, 4ATJ, 4FTS and 4PTL. These technologies possess a dependency with specific feedstock technologies and processes such as 5FFO, 5HPS, 5WFO, 5ALG, 5NFW, 5AJC, 5MSW, 5FAR, 5CNG and 5WCO.
The DSM below shows the connections of SAF to Level 3, 4 and 5 technologies. These connections will be presented in more detailed in the next section using Object-Process-Model (OPM).
Roadmap Model using OPM
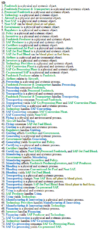
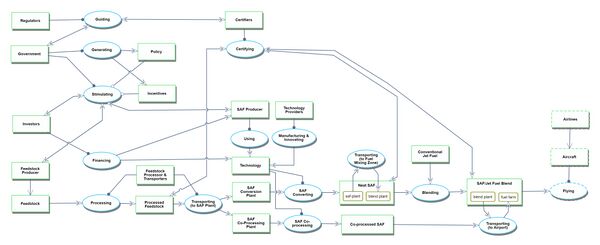
The Object-Process-Model (OPM) of the 2BSSAF - Brazil Solution - Sustainable Aviation Fuel roadmap is presented in the figures with the Object-Process-Language (OPL) below. The OPM was divided in two OPMs: Level 1 and Level 2. Level 1 focuses on the main stakeholders including the Feedstock Producer, Fuel Producers, Government (policy, guidelines, sponsorship), Regulators and Certifiers while Level 2 focuses on the feedstocks and SAF making technologies.
Level 1 OPM
Level 2 OPM
Figures of Merit
The table below shows a list of FOMs focus on productivity, scalability, accessibility & cost of pathways for evaluation of SAF’s production ecosystem.
| Category | Figure of Merit | Units | Description |
|---|---|---|---|
| Competitiveness | SAF unit cost | [USD/MJ] | Market cost of SAF per unit of volume or energy |
| Cost per reduced ton | [USD / tCO2e] | Incremental cost per ton of carbon equivalent reduced vs CAF | |
| Investment potential | [USD / tCO2e] | Financing opportunity per potential unit output of technology | |
| Installation cost per unit | [USD / Vol] | Cost of deploying SAF production infrastructure relative to capability | |
| Efficiency | Energy efficiency | [%] | Energy input to produce SAF vs energy output in SAF |
| Productivity | Feedstock crop yield | [Ton / ha] | Crop yield in volume produced per unit area |
| Feedstock availability | [Ton / year] | Crop availability in volume produced per year | |
| SAF conversion yield | [%] | SAF produced with relation to total refinery biofuel production | |
| Performance | Energy density | [MJ/Vol] | Energy content per unit volume of fuel |
| Blend ratio of pathway/feedstock | [%] | Volume SAF relative to total volume of fuel after blend | |
| Fuel consumption | [Vol/Time] | Fuel consumed per hour of flight to compare SAF vs CAF | |
| Sustainability | Carbon savings potential | [tCO2e / MJ] | Potential reduction in emissions for use of SAF vs CAF as baseline |
| Carbon emissions | [tCO2e / MJ] | Life-cycle carbon equivalent emissions to generate unit of fuel | |
| Emission reduction factor | [%] | Percentage reduction per equivalent unit of use of SAF |
Alignment with Company Strategic Drivers
Positioning of Company vs. Competition
Technical Model
Financial Model
List of R&D Projects
Key Publications, Presentations and Patents
Technology Strategy Statement
References
[1] U.S. Department of Energy, U.S. Department of Transportation, U.S. Department of Agriculture, and U.S. Environmental Protection Agency. 2022. SAF Grand Challenge Roadmap: Flight Plan for Sustainable Aviation Fuel. Washington, D.C.: U.S. Department of Energy. https://www.energy.gov/sites/default/files/2022-09/beto-saf-gc-roadmap-report-sept-2022.pdf
[2] SAF Handbook, International Air Transport Association, https://www.iata.org/contentassets/d13875e9ed784f75bac90f000760e998/saf-handbook.pdf.
