Random Forest in Data Analytics
Technology Roadmap Sections and Deliverables
Unique identifier:
- 3RF-Random Forest
This is a “level 3” roadmap at the technology/capability level (see Fig. 8-5), where “level 1” would indicate a market level roadmap and “level 2” would indicate a product/service level technology roadmap.
Roadmap Overview
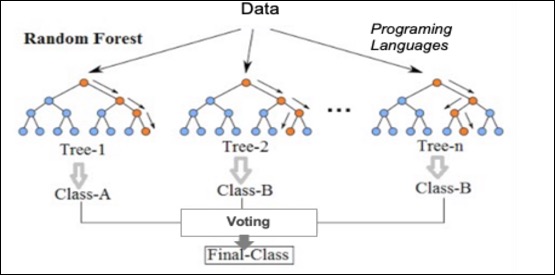
The basic high-level structure of machine learning algorithms is depicted in the figure below:
Random Forest is a classification method/technique that is based on decision trees. Classification problems are a big part of machine learning because it is important to know what classification/group observations are in. There are many classification algorithms used in data analysis such as logistic regression, support vector machine, Bayes classifier, and decision trees. Random forest is near the top of the classifier hierarchy.
Unlike the traditional decision tree classification technique, a random forest classifier grows many decision trees in ways that can address the model. In the traditional decision tree classification, there is an optimal split, which is used to decide if a property is to be true/false. Random forest contains several such trees as a forest that operate as an ensemble and allows users to make several binary splits in the data and establish complex rules for classification. Each tree in the random forest outputs a class prediction and the class with the most votes becomes the model’s prediction. Majority wins. A large population of relatively uncorrelated models operating as a committee will outperform individual constituent models. For a random forest to perform well: (1) there needs to be a signal in the features used to build the random forest model that will show if the model does better than random guessing, and (2) the prediction and errors made by the individual trees have to have low correlations with each other.
Two methods can be used to ensure that each individual tree is not too correlated with the behavior of any other trees in the model:
- Bagging (Bootstrap Aggregation) - Each individual tree randomly samples from the dataset with replacement, resulting in different trees.
- Feature Randomness - Instead of every tree being able to consider every possible feature and pick the one that produces the most separation between the observations in the left and right node, the trees in the random forest can only pick from a random subset of features. This forces more variation amongst the trees in the model, which results in lower correlation across trees and more diversification.
Trees are not only trained on different sets of data, but they also use different features to make decisions.
The Random forest machine learning algorithm is a disruptive technological innovation (a technology that significantly shifts the competition to a new regime where it provides a large improvement on a different FOM than the mainstream product or service) because it is:
- versatile - can do regression or classification tasks; can handle binary, categorical, and numerical features. Data requires little pre-processing (no rescaling or transforming)
- parallelizable - process can be split to multiple machines, which results in significantly faster computation time
- effective for high dimensional data - algorithm breaks down large datasets into smaller subsets
- fast - each tree only uses a subset of features, so the model can use hundreds of features. It is quick to train
- robust - bins outliers and is indifferent to non-linear features
- low bias, moderate variance - each decision tree has a high variance but low bias; all the trees are averaged, so model how low bias and moderate variance
As a result, compared with the traditional way of having one operational model, random forest has extraordinary performance advantages based on the FOMs such as accuracy and efficiency because of the large number of models it can generate in a relatively short period of time. One interesting case of random forest increasing accuracy and efficiency is in the field of investment. In the past, investment decisions relied on specific models built by analysts. Inevitably, there were loose corners due to the reliance on single models. Nowadays, random forest (or machine learning at a larger scale) enables many models to be generated quickly to ensure the creation of a more robust decision-making solution that builds a “forest” of highly diverse "trees". This has significantly changed the industry in terms of efficiency and accuracy. For example, in a research paper by Luckyson Khaidem, et al (2016), the ROC curve shows great accuracy by modeling Apple's stock performance, using Random Forest. The paper also showed the continuous improvement of accuracy when applying machine learning. As a result, random forest/machine learning has significantly changed the way the investment sector operates.
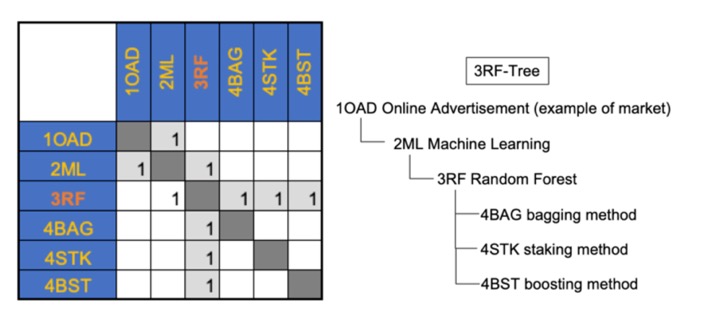
Design Structure Matrix (DSM) Allocation
The 3-RF tree that we can extract from the DSM above shows us that the Random Forest(3RF) is part of a larger data analysis service initiative on Machine Learning (ML), and Machine Learning is also part of a major marketing initiative (here we use online advertising as an example). Random Forest requires the following key enabling technologies at the subsystem level: Bagging (4BAG), Stacking (4STK), and Boosting (4BST). These three are the most common approaches in Random Forest, and are the technologies and resources at level 4.
Roadmap Model using OPM
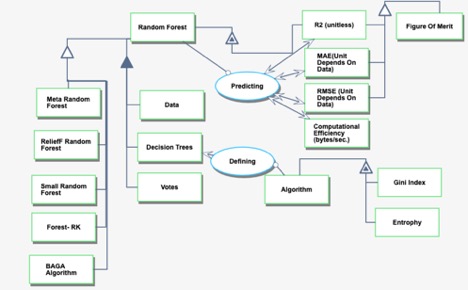
We provide an Object-Process-Diagram (OPD) of the 3RF roadmap in the figure below. This diagram captures the main object of the roadmap (Random Forest), its various instances with a variety of focus, its decomposition into subsystems (data, decision trees, votes), its characterization by Figures of Merit (FOMs) as well as the main processes (defining, predicting).
An Object-Process-Language (OPL) description of the roadmap scope is auto-generated and given below. It reflects the same content as the previous figure, but in a formal natural language.
Figures of Merit
The table below show a list of FOMs by which the Random Forest models can be assessed. The first three are used to assess the accuracy of the model. Among all three, the Root Mean Squared Error (RMSE) is a FoM commonly used to measure the performance of predictive models.Since the errors are squared before they are averaged, the RMSE gives a relatively high weight to larger errors in comparison to other performance measures such as R2 and MAE. To measure prediction, the RMSE should be calculated with out-of-sample data that was not used for model training. From a mathematical standpoint, RMSE can vary between positive infinity and zero. A very high RMSE indicates that the model is very poor at out-of-sample predictions. While an RMSE of zero is theoretically possible, this would indicate perfect prediction and is extremely unlikely in real-world situations.
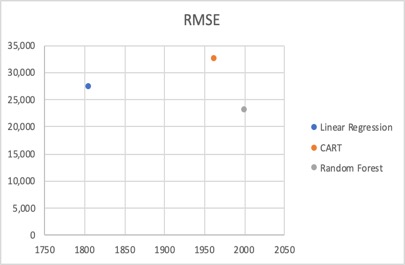
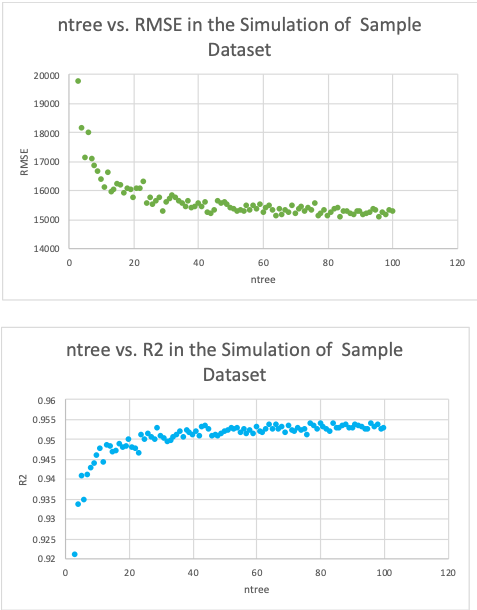
Due to the nature of this technology, it's been challenging to quantify the growth of FOM over time, because it's not only related to the technology itself (algorithm), but also the dataset, as well as parameters selected for modeling, such as number of trees, etc. We've tried to use the same dataset to run three models with optimized parameters, and the chart below shows the difference in RMSE vs. Year.
Random Forest is still being rapidly developed with tremendous efforts from many research groups around the world, to improve its performance. Meanwhile, there are also lots of efforts on the implementation and application space, such as finance, investment, service, high tech, and energy industry, etc.
Alignment with Company Strategic Drivers
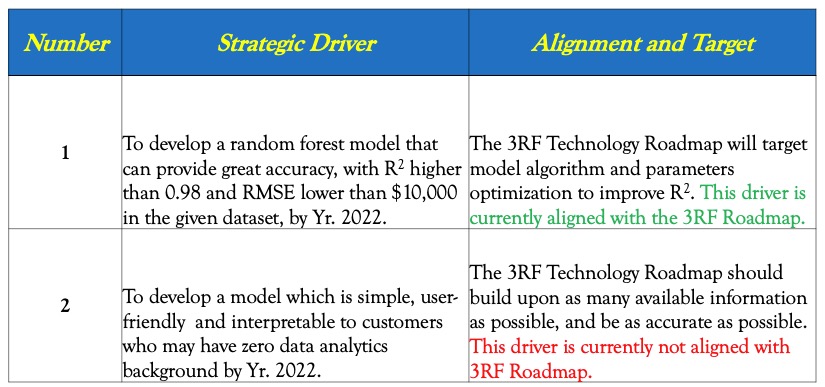
In this section, we've embedded data analytics in real estate industry. Assuming we have a company in which we use random forest to predict housing price (like what Zillow etc. does). The table below shows strategic drivers of our hypothetical company and alignment of the 3RF technology roadmap with it.
The first strategic driver indicates the company aims to improve accuracy of the model, whereas the 3RF roadmap is also optimizing the algorithm and parameters to fine tune the model. As a result, this driver is aligned with 3RF roadmap. The second driver indicates the company is looking for simplicity, and this is not aligned with the current 3RF roadmap. This discrepancy needs immediate attention and be worked to address.
Positioning of Company vs. Competition
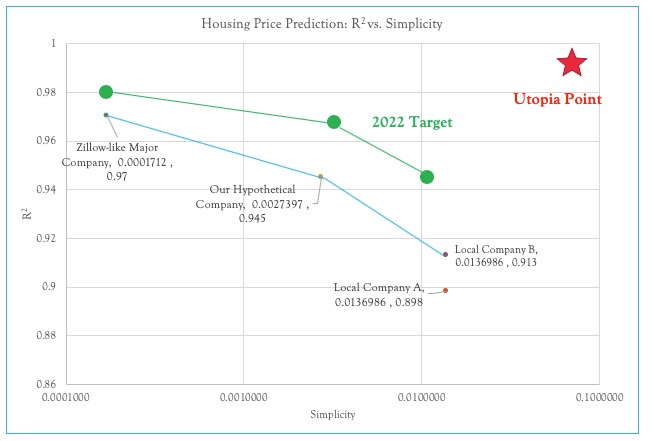
he figure below shows a summary of other real estate companies who also use data analytics to predict housing price.
Zillow-like major company tend to have very high R2, which heavily utilize data analytics in their price prediction model. To have great accuracy, it would include as many variables information as possible, as many observations as possible. This will help to "train" their model to be very smart. Meanwhile, they have scarified simplicity with the many variables, and large number of models built for machine learning purpose. Whereas some local "mom and pop store" would utilize very simple models such as liner regression or CART, of which the accuracy of the model is sacrificed. Right now our hypothetical company is trying to utilize random forest to deliver good accuracy while still maintain certain level of simplicity
The Pareto Front (for this specific dataset) is shown in blue line. It's clear that the local company A (using simple linear regression)is not at the Pareto Front, instead, it would be dominated. The local company B using CART model is as simple, but the accuracy is better. Zillow-like major company and our hypothetical company both are much better in terms of accuracy.
For the target of Yr. 2020, the green line defines the expected Pareto Front at then. Comparing with current performance, the future Pareto Front is expected to improve either accuracy (R2), or simplicity, or both. The company's strategy will determine the direction, and extent of improvement.
Technical Model
An example morphologic matrix is developed for 3RF roadmap in this specific case. The purpose of such a model is to understand all the design vectors, explore the design tradespace and establish what are the active constraints in the system.

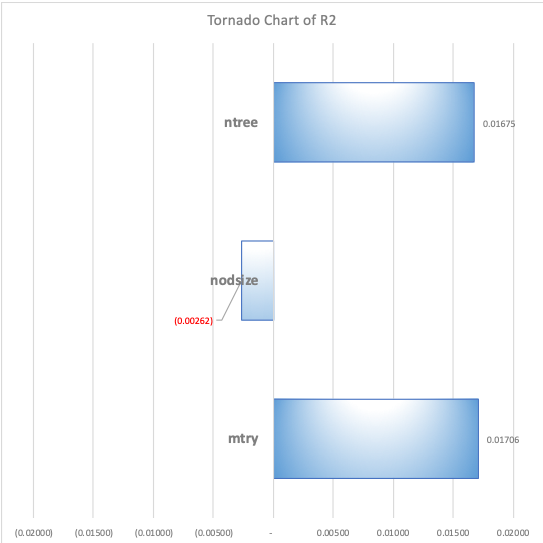
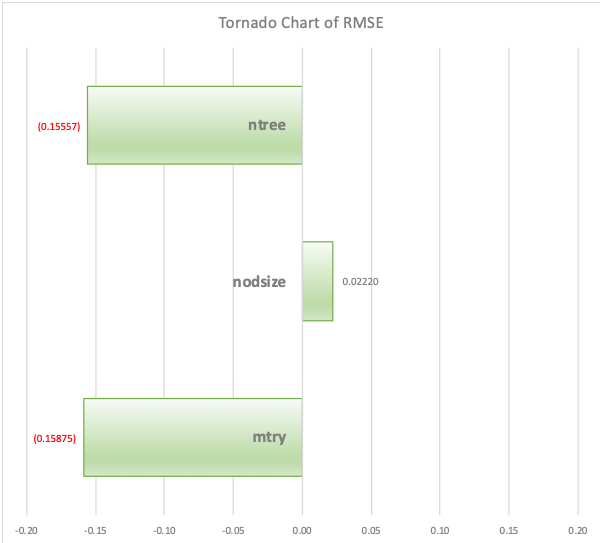
Due to the special nature of this technology, there is no defined equations for the FOM’s. The FOM’s values are impacted by o the model parameters, including ntree, nodsize, mtry (w/o clearly defined mathematical equations or regression equations) • ntree: number of CART trees in the forest • mtry: number of variables examined at each split of the trees • nodesize: minimum number of observations in each terminal node of the trees o the dataset, including all variables and observations As a result, for any given dataset, the expressions of two FOM’s can be expressed in this way: o R2~ f1(ntree, nodsize, mtry) o RMSE~f2(ntree, nodsize, mtry)
