Proton Exchange Membrane (PEM) Electrolyzer Plant at Grid Scale
1. Roadmap Overview This is a technology roadmap for: 3PEM - Proton Exchange Membrane This is a “Level 3” roadmap, indicating that it addresses a technology at the subsystem level. Higher level roadmaps related to this subject would address technology progression at the market level (Hydrogen Supply) and product level (Water Electrolyzer). A short video summary and introduction to this roadmap follows here.
OPM for PEM electrolyzers
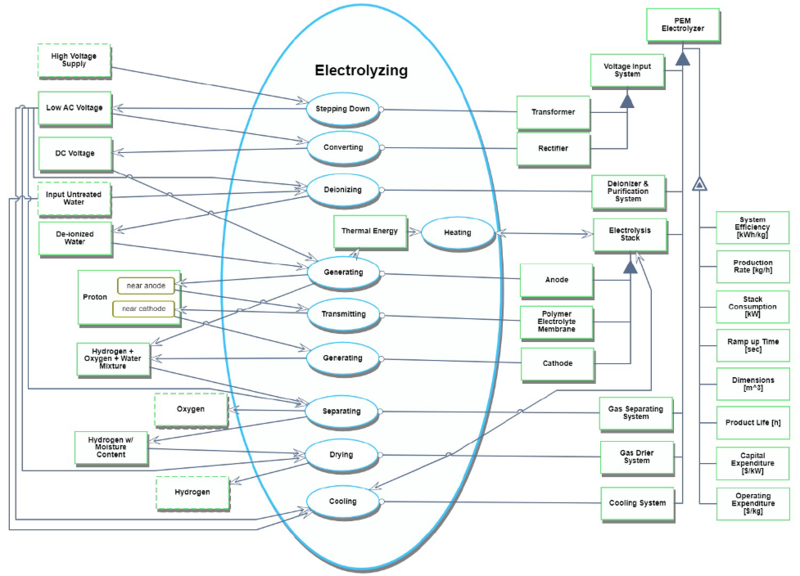
An Object-Process Diagram (OPD) and Object-Process Language (OPL) for PEM electrolyzer plants are as follows.
<OPL of PEM electrolyzer plants>
1. High Voltage Supply is physical and environmental. 2. Low AC Voltage is physical and systemic.
3. DC Voltage is physical and systemic.
4. Input Untreated Water is physical and environmental. 5. De-ionized Water is physical and systemic.
6. Proton is physical and systemic.
7. Proton can be near cathode or near anode.
8. Thermal Energy is physical and systemic.
9. Hydrogen + Oxygen + Water Mixture is physical and systemic. 10. Hydrogen w/ Moisture Content is physical and systemic.
11 Oxygen is physical and environmental.
12. Hydrogen is physical and environmental.
13. Transformer is physical and systemic.
14. Rectifier is physical and systemic.
15. Voltage Input System is physical and systemic.
16. Voltage Input System consists of Rectifier and Transformer. 17. Deionizer & Purification System is physical and systemic. 18. Anode is physical and systemic.
19. Polymer Electrolyte Membrane is physical and systemic. 20. Cathode is physical and systemic.
21. Electrolysis Stack is physical and systemic.
22. Electrolysis Stack consists of Anode, Polymer Electrolyte Membrane and Cathode. 23. Gas Separating System is physical and systemic.
24. Gas Drier System is physical and systemic.
25. Cooling System is physical and systemic.
26. PEM Electrolyzer is physical and systemic.
27. PEM Electrolyzer consists of Voltage Input System, Deionizer & Purification System, Electrolysis Stack, Gas Separating System, Gas Drier System, and Cooling System 28. System Efficiency of PEM Electrolyzer is informatical and systemic.
29. Production Rate of PEM Electrolyzer is informatical and systemic.
30. Stack Consumption of PEM Electrolyzer is informatical and systemic.
31. Ramp up Time of PEM Electrolyzer is informatical and systemic.
32. Dimensions of PEM Electrolyzer is informatical and systemic.
33. Product Life of PEM Electrolyzer is informatical and systemic.
34. Capital Expenditure of PEM Electrolyzer is informatical and systemic.
35. Operating Expenditure of PEM Electrolyzer is informatical and systemic.
36. PEM Electrolyzer exhibits Capital Expenditure, Dimensions, Operating Expenditure, Product Life, Production Rate, Ramp up Time, Stack Consumption and System Efficiency 37. Stepping Down is physical and systemic.
38. Stepping Down requires Transformer.
39. Stepping Down consumes High Voltage Supply.
40. Stepping Down yields Low AC Voltage. 41. Converting is physical and systemic.
42. Converting requires Rectifier.
43. Converting consumes Low AC Voltage. 44. Converting yields DC Voltage
45. Deionizing is physical and systemic.
46. Deionizing requires Deionizer & Purification System.
47. Deionizing consumes Input Untreated Water and Low AC Voltage.
48. Deionizing yields De-ionized Water.
49. Generating is physical and systemic.
50. Generating requires Anode.
51. Generating consumes DC Voltage and De-ionized Water.
52. Generating yields Hydrogen + Oxygen + Water Mixture, Thermal Energy and Proton at state near anode.
53. Heating is physical and systemic.
54. Heating affects Electrolysis Stack.
55. Heating consumes Thermal Energy.
56. Transmitting is physical and systemic.
57. Transmitting changes Proton from near anode to near cathode. 58. Transmitting requires Polymer Electrolyte Membrane.
59. Generating is physical and systemic.
60. Generating requires Cathode.
61. Generating consumes Proton at state near cathode.
62. Generating yields Hydrogen + Oxygen + Water Mixture.
63. Separating is physical and systemic.
64. Separating requires Gas Separating System.
65. Separating consumes Hydrogen + Oxygen + Water Mixture and Low AC Voltage.
66. Separating yields Hydrogen w/ Moisture Content and Oxygen.
67. Drying is physical and systemic.
68. Drying requires Gas Drier System.
69. Drying consumes Hydrogen w/ Moisture Content and Low AC Voltage.
70. Drying yields Hydrogen.
71. Cooling is physical and systemic.
72. Cooling requires Cooling System.
73. Cooling affects Electrolysis Stack.
74. Cooling consumes Input Untreated Water and Low AC Voltage.
75. Electrolyzing is physical and systemic.
76. Electrolyzing zooms into Stepping Down, Converting, Deionizing, Generating, Heating, Transmitting, Generating, Separating, Drying, and Cooling which occur in that time sequence.
FOM of PEM electrolyzer plants
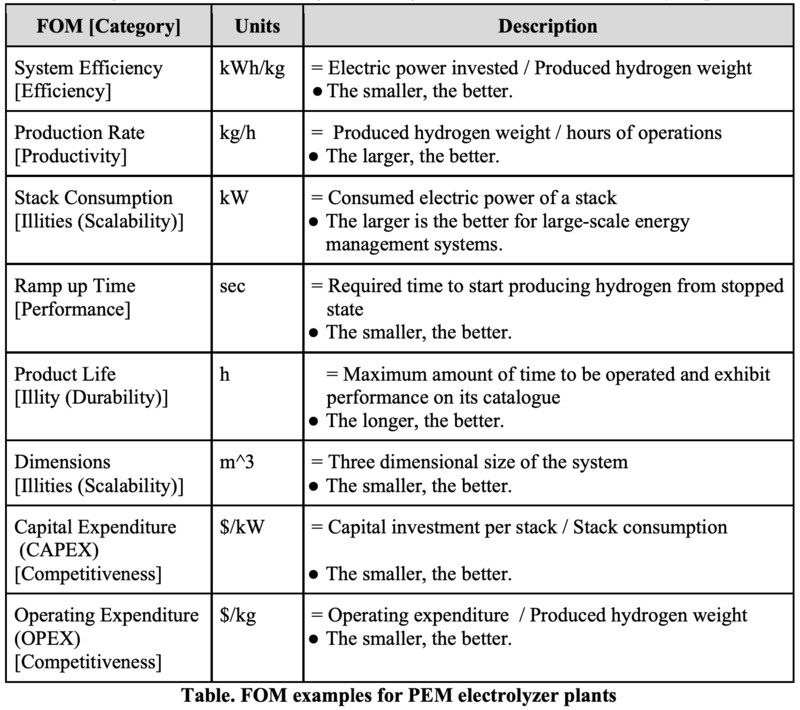
The following table is a list of some significant Figure of Merits for PEM electrolyzer plants.
Estimated CAPEX trends and technological lifecycle of PEM electrolyzers
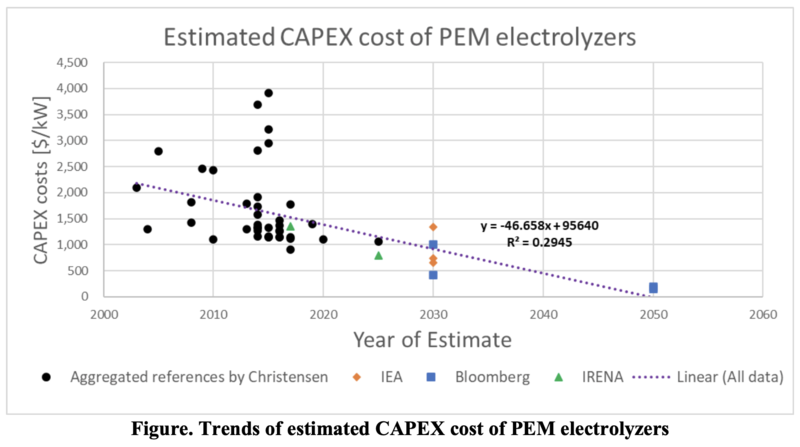
A list of estimated electrolyzer CAPEX costs [2020 $/kW] made by Christensen provides with a wide range of datasets1. The following figure is a plot of PEM electrolyzer CAPEX costs [$/kW] versus year of estimate based on Christensen’s work, reports by IEA2 and Bloomberg3 introduced in his article, and IRENA’s report4.
A linear regression model (a purple dotted line) in the figure derives from all datasets. The average annual rate of estimated CAPEX from 2003 to 2030 decrease is 3.1%.
The reciprocals of CAPEX costs [W/$] is plotted in the following figure. A polynomial regression model (a purple dotted line) in the figure suggests that the lifecycle of PEM electrolyzers is in incubation or takeoff stages along the S-Curve.
1 Adam Christensen, Assessment of Hydrogen Production Costs from Electrolysis: United States and Europe (the International Council on Clean Transportation, 2020), 14-16, 18. %20v2.pdf https://theicct.org/sites/default/files/publications/final_icct2020_assessment_of%20_hydrogen_production_costs %20v2.pdf
2 The Future of Hydrogen (IEA, 2019). https://www.iea.org/reports/the-future-of-hydrogen.
3 Hydrogen: The Economics of Production From Renewables (Bloomberg New Energy Finance., 2019).
4 Hydrogen from Renewable Power – Technology Outlook for the Energy Transition (IRENA, 2018). /media/Files/IRENA/Agency/Publication/2018/Sep/IRENA_Hydrogen_from_renewable_power_2018.pdf https://www.irena.org/- /media/Files/IRENA/Agency/Publication/2018/Sep/IRENA_Hydrogen_from_renewable_power_2018.pdf


