Proton Exchange Membrane (PEM) Electrolyzer Plant at Grid Scale
1. Roadmap Overview This is a technology roadmap for: 3PEM - Proton Exchange Membrane This is a “Level 3” roadmap, indicating that it addresses a technology at the subsystem level. Higher level roadmaps related to this subject would address technology progression at the market level (Hydrogen Supply) and product level (Water Electrolyzer). A short video summary and introduction to this roadmap follows here.
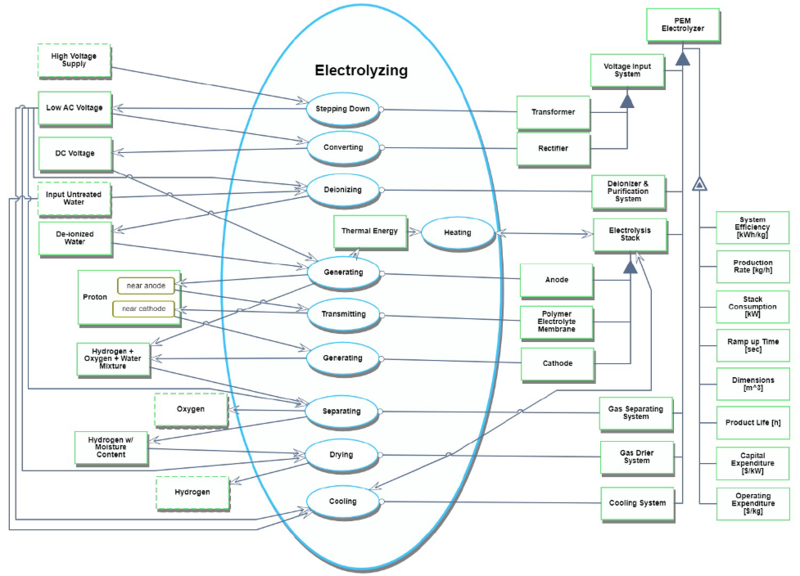
OPM for PEM electrolyzers
An Object-Process Diagram (OPD) and Object-Process Language (OPL) for PEM electrolyzer plants are as follows.
<OPL of PEM electrolyzer plants>
1. High Voltage Supply is physical and environmental. 2. Low AC Voltage is physical and systemic.
3. DC Voltage is physical and systemic.
4. Input Untreated Water is physical and environmental. 5. De-ionized Water is physical and systemic.
6. Proton is physical and systemic.
7. Proton can be near cathode or near anode.
8. Thermal Energy is physical and systemic.
9. Hydrogen + Oxygen + Water Mixture is physical and systemic. 10. Hydrogen w/ Moisture Content is physical and systemic.
11 Oxygen is physical and environmental.
12. Hydrogen is physical and environmental.
13. Transformer is physical and systemic.
14. Rectifier is physical and systemic.
15. Voltage Input System is physical and systemic.
16. Voltage Input System consists of Rectifier and Transformer. 17. Deionizer & Purification System is physical and systemic. 18. Anode is physical and systemic.
19. Polymer Electrolyte Membrane is physical and systemic. 20. Cathode is physical and systemic.
21. Electrolysis Stack is physical and systemic.
22. Electrolysis Stack consists of Anode, Polymer Electrolyte Membrane and Cathode. 23. Gas Separating System is physical and systemic.
24. Gas Drier System is physical and systemic.
25. Cooling System is physical and systemic.
26. PEM Electrolyzer is physical and systemic.
27. PEM Electrolyzer consists of Voltage Input System, Deionizer & Purification System, Electrolysis Stack, Gas Separating System, Gas Drier System, and Cooling System 28. System Efficiency of PEM Electrolyzer is informatical and systemic.
29. Production Rate of PEM Electrolyzer is informatical and systemic.
30. Stack Consumption of PEM Electrolyzer is informatical and systemic.
31. Ramp up Time of PEM Electrolyzer is informatical and systemic.
32. Dimensions of PEM Electrolyzer is informatical and systemic.
33. Product Life of PEM Electrolyzer is informatical and systemic.
34. Capital Expenditure of PEM Electrolyzer is informatical and systemic.
35. Operating Expenditure of PEM Electrolyzer is informatical and systemic.
36. PEM Electrolyzer exhibits Capital Expenditure, Dimensions, Operating Expenditure, Product Life, Production Rate, Ramp up Time, Stack Consumption and System Efficiency 37. Stepping Down is physical and systemic.
38. Stepping Down requires Transformer.
39. Stepping Down consumes High Voltage Supply.
40. Stepping Down yields Low AC Voltage. 41. Converting is physical and systemic.
42. Converting requires Rectifier.
43. Converting consumes Low AC Voltage. 44. Converting yields DC Voltage
45. Deionizing is physical and systemic.
46. Deionizing requires Deionizer & Purification System.
47. Deionizing consumes Input Untreated Water and Low AC Voltage.
48. Deionizing yields De-ionized Water.
49. Generating is physical and systemic.
50. Generating requires Anode.
51. Generating consumes DC Voltage and De-ionized Water.
52. Generating yields Hydrogen + Oxygen + Water Mixture, Thermal Energy and Proton at state near anode.
53. Heating is physical and systemic.
54. Heating affects Electrolysis Stack.
55. Heating consumes Thermal Energy.
56. Transmitting is physical and systemic.
57. Transmitting changes Proton from near anode to near cathode. 58. Transmitting requires Polymer Electrolyte Membrane.
59. Generating is physical and systemic.
60. Generating requires Cathode.
61. Generating consumes Proton at state near cathode.
62. Generating yields Hydrogen + Oxygen + Water Mixture.
63. Separating is physical and systemic.
64. Separating requires Gas Separating System.
65. Separating consumes Hydrogen + Oxygen + Water Mixture and Low AC Voltage.
66. Separating yields Hydrogen w/ Moisture Content and Oxygen.
67. Drying is physical and systemic.
68. Drying requires Gas Drier System.
69. Drying consumes Hydrogen w/ Moisture Content and Low AC Voltage.
70. Drying yields Hydrogen.
71. Cooling is physical and systemic.
72. Cooling requires Cooling System.
73. Cooling affects Electrolysis Stack.
74. Cooling consumes Input Untreated Water and Low AC Voltage.
75. Electrolyzing is physical and systemic.
76. Electrolyzing zooms into Stepping Down, Converting, Deionizing, Generating, Heating, Transmitting, Generating, Separating, Drying, and Cooling which occur in that time sequence.
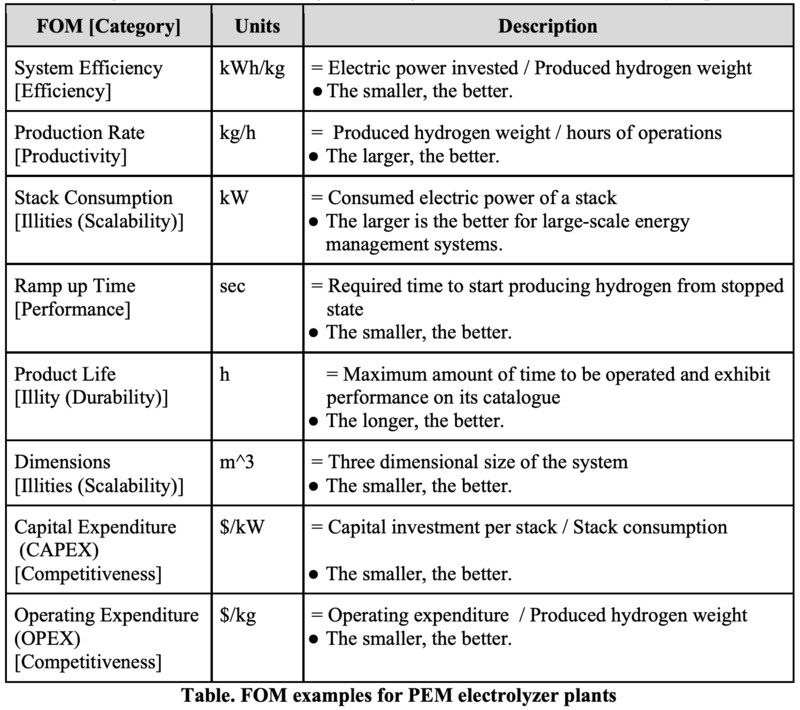
FOM of PEM electrolyzer plants
The following table is a list of some significant Figure of Merits for PEM electrolyzer plants.
Estimated CAPEX trends and technological lifecycle of PEM electrolyzers
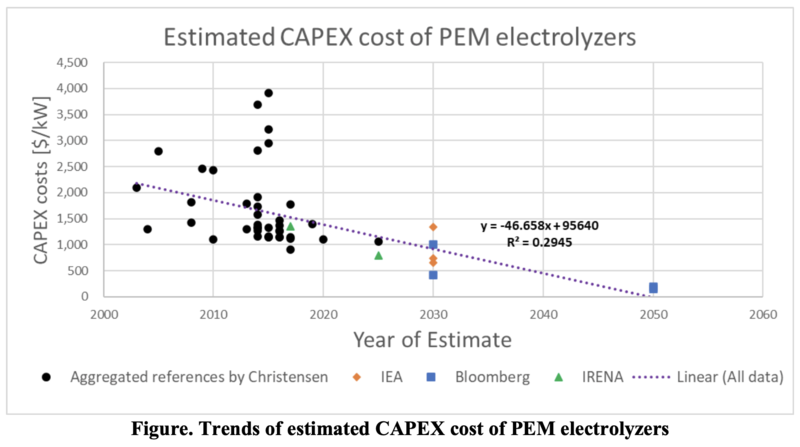
A list of estimated electrolyzer CAPEX costs [2020 $/kW] made by Christensen provides with a wide range of datasets1. The following figure is a plot of PEM electrolyzer CAPEX costs [$/kW] versus year of estimate based on Christensen’s work, reports by IEA2 and Bloomberg3 introduced in his article, and IRENA’s report4.
A linear regression model (a purple dotted line) in the figure derives from all datasets. The average annual rate of estimated CAPEX from 2003 to 2030 decrease is 3.1%.
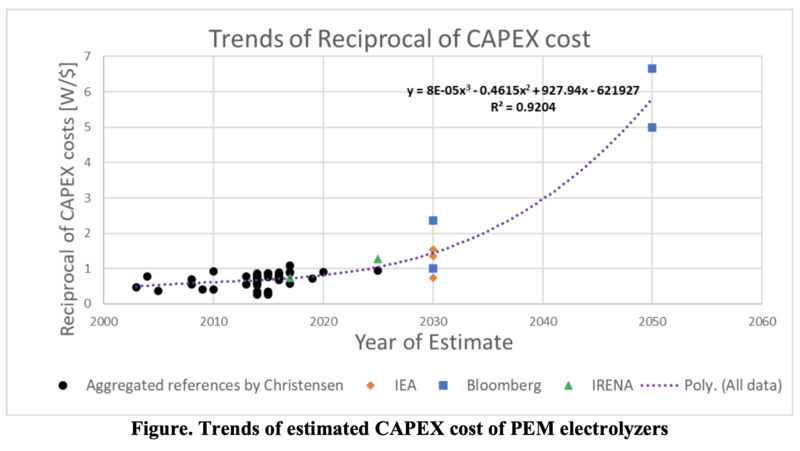
The reciprocals of CAPEX costs [W/$] is plotted in the following figure. A polynomial regression model (a purple dotted line) in the figure suggests that the lifecycle of PEM electrolyzers is in incubation or takeoff stages along the S-Curve.
1 Adam Christensen, Assessment of Hydrogen Production Costs from Electrolysis: United States and Europe (the International Council on Clean Transportation, 2020), 14-16, 18. %20v2.pdf https://theicct.org/sites/default/files/publications/final_icct2020_assessment_of%20_hydrogen_production_costs %20v2.pdf
2 The Future of Hydrogen (IEA, 2019). https://www.iea.org/reports/the-future-of-hydrogen.
3 Hydrogen: The Economics of Production From Renewables (Bloomberg New Energy Finance., 2019).
4 Hydrogen from Renewable Power – Technology Outlook for the Energy Transition (IRENA, 2018). /media/Files/IRENA/Agency/Publication/2018/Sep/IRENA_Hydrogen_from_renewable_power_2018.pdf https://www.irena.org/- /media/Files/IRENA/Agency/Publication/2018/Sep/IRENA_Hydrogen_from_renewable_power_2018.pdf
Publications and patent analysis
For this exercise, we selected two key areas of investigation: (1) Electrolysis chemistry and (2) Power conversion systems for electrolyzers (3) Loading following controls for renewable energy resource integration. For each topic we review key patents and publications and selected a 1-2 to highlight for each topic.
Relevant Topic 1: Electrolysis Chemistry
Paper: Membrane-Based Electrolysis for Hydrogen Production: A Review Citation: Ahmad Kamaroddin, M.F.; Sabli, N.; Tuan Abdullah, T.A.; Siajam, S.I.; Abdullah, L.C.; Abdul Jalil, A.; Ahmad, A. Membrane-Based Electrolysis for Hydrogen Production: A Review. Membranes 2021, 11, 810. https://doi.org/10.3390/membranes11110810
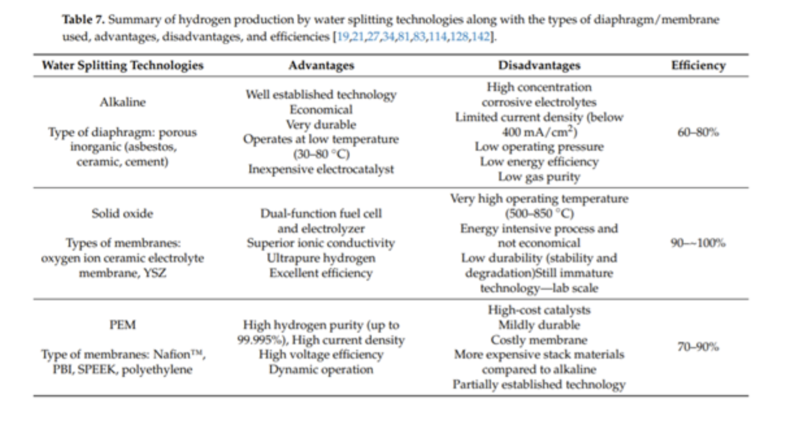
Why relevant: This paper takes a lens on the different types of electrolysis technologies with a review into the maturity, performance specs, membrane costs and other stack component elements. There are many types of electrolysis chemistries out there – with the two most mature popular between the alkaline and proton exchange membrane chemistries but it important to understand the advantages & disadvantages of each as well as the emerging chemistries too because all are being commercialized in the market today.
Paper overview and takeaways:
This paper reviews multiple membranes that separate the H2 from water molecules – from tried and true ones like Nafion to newer membranes like PBI and SPEEK that offer higher operational temperate ranges and other benefits.
Summary of electrolysis chemistries from paper (just 3 of the most popular – more listed the full paper)
Patent: Flow cell systems, flow cell batteries, and hydrogen production processes
(In application process)
Patent Number: USPTO: 11,050,076 - Link here
Overview: Patent covers a generic design for a flow cell system for producing hydrogen through electrolysis. It was filed in January 2016 and is pending approval Why important: This patent is the design that all fuels cells – basic to industry-leading follows and there is a patent application in for it. The design is free online to all to see and develop off of – which helps the burgeoning and increasingly competitive hydrogen fuel cell industry. Figure of system from patent application:
Relevant Topic 2: Power Conversion Systems for Electrolyzers
Paper: AC-DC Converters for Electrolyzer Applications: State of the Art and Future Challenges Citation: Yodwong, B.; Guilbert, D.; Phattanasak, M.; Kaewmanee, W.; Hinaje, M.; Vitale, G. AC-DC Converters for Electrolyzer Applications: State of the Art and Future Challenges. Electronics 2020, 9, 912. https://doi.org/10.3390/electronics9060912
Why relevant:
Power Conversion from AC/DC from renewable or grid sources to power electolyzer plants currently makes up around 30% of total system costs – the single largest cost bucket (NREL Cost Manufacturing, 2020). Whoever figures out how to get the power conversion component prices down, will likely also win the grid-scale electrolyzer competition because it is a $/kW competition. AC/DC Conversion has always existed but stepping down high voltage AC power to DC lower voltage compatible with electrolyzer systems and doing so in an efficient way (minimal losses), is very expensive today. Efficiency as well as cost-effectiveness is key because electricity prices are an expensive input for green hydrogen productive, so the fewer losses from the rate power load, the better the system-wide efficiency is.
We are interested in grid-scale systems that run at high-current & output so we pay special attention to the parts of this part to suggest best power conversion designs for systems of these types.
Paper overview and takeaways:
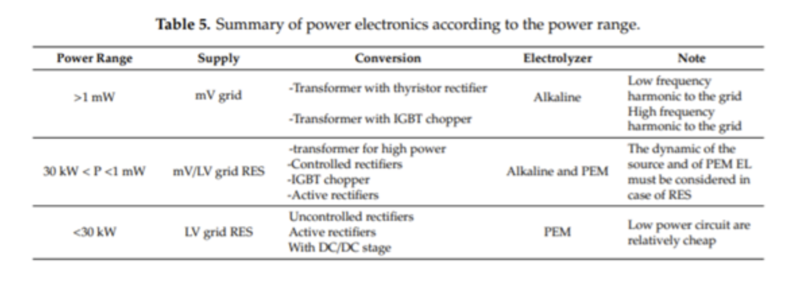
This paper goes over different designs for the AC/DC rectifiers. Thyristor-based rectifiers are used for high-current applications and furthermore DC choppers + buck converters are used to step down the DC current even further to the system required voltage.
Recommendations by type of system from paper:
Relevant Topic 3: Load following and renewable resource management Patent: Load-following fuel cell system with energy storage
(approved and published)
Patent Number: USPTO: 10,573,907- Link here
Overview: Patent covers a design of a fuel that is designed to run intermittently to match the loads of renewables generation. It goes over adjustments to enable a fuel cell to ramp up and down quickly and with out much degradation or loss in performance
Why relevant: Green hydrogen must be produced with renewable electricity, otherwise it is not green. This is tricky because most electrical grids are still made from carbon sources and so simply plugging in an electrolyzer system to the grid does not work. Solar and wind are the mst abundant sources of renewables but they are intermittent and so fuel cells need to be able to turn on and off accordingly to be able to truly be able to claim “green-ness” and also to maximize capacity factor.
Technical Model
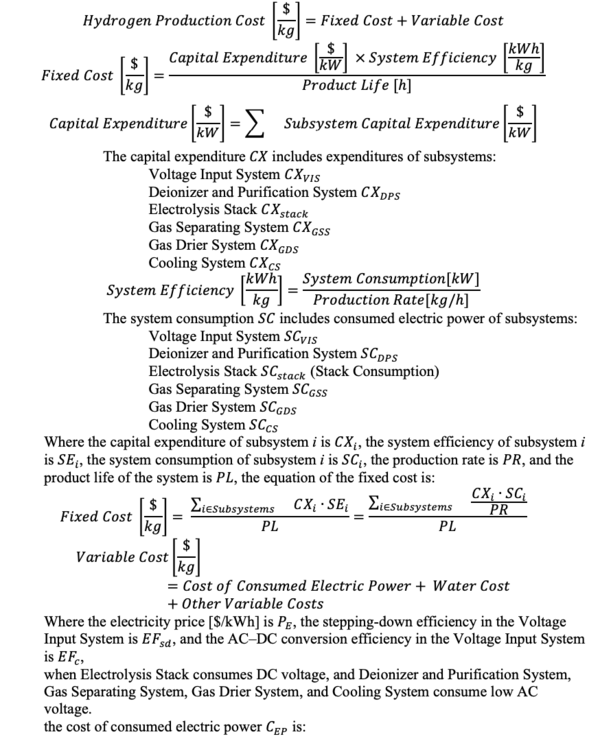
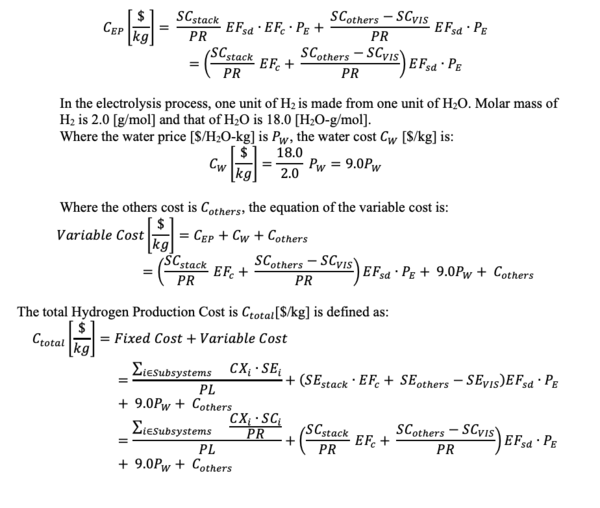
Based on the Object-Process Diagram, we developed the hydrogen production cost model of PEM electrolyzer plants. The hydrogen production cost is defined as follows.
Where the electricity price [$/kWh] is 𝑃 , the stepping-down efficiency in the Voltage 4
Input System is 𝐸𝐹 , and the AC–DC conversion efficiency in the Voltage Input System
is 𝐸𝐹 ,
when Electrolysis Stack consumes DC voltage, and Deionizer and Purification System, Gas Separating System, Gas Drier System, and Cooling System consume low AC voltage. the cost of consumed electric power 𝐶4% is:
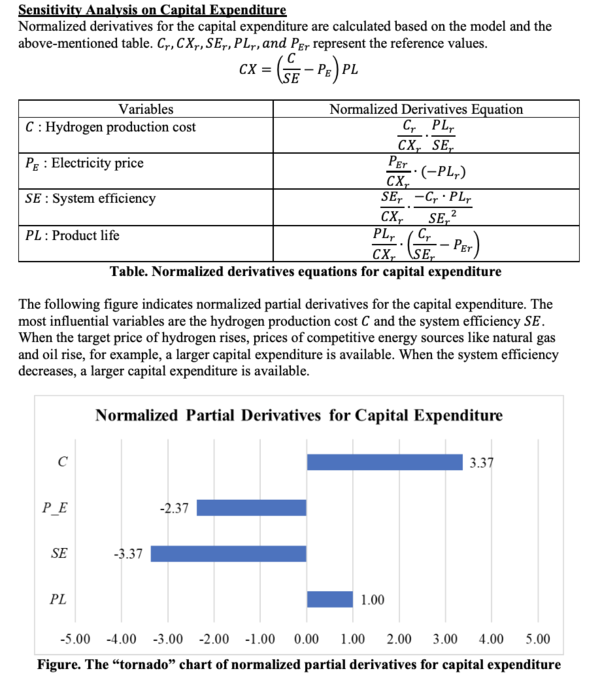
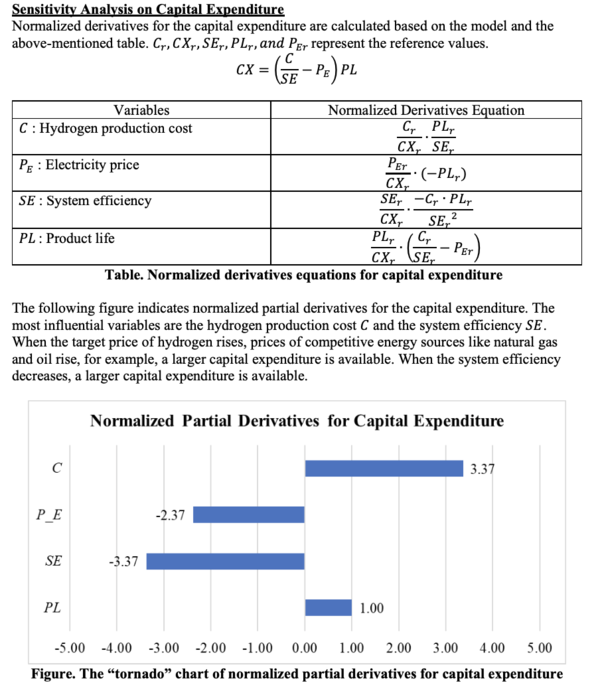
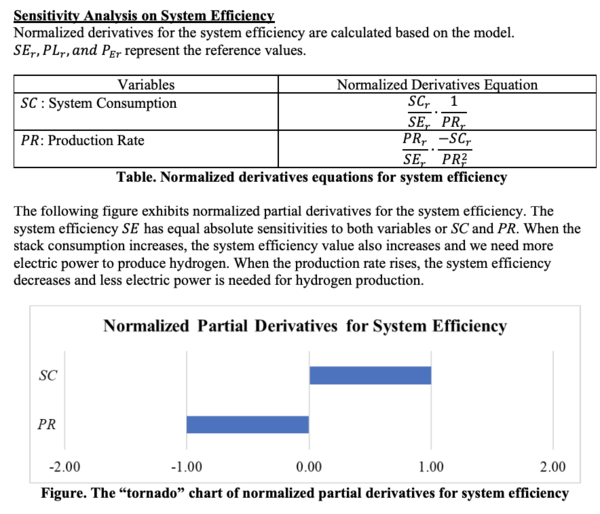
Sensitivity Analysis
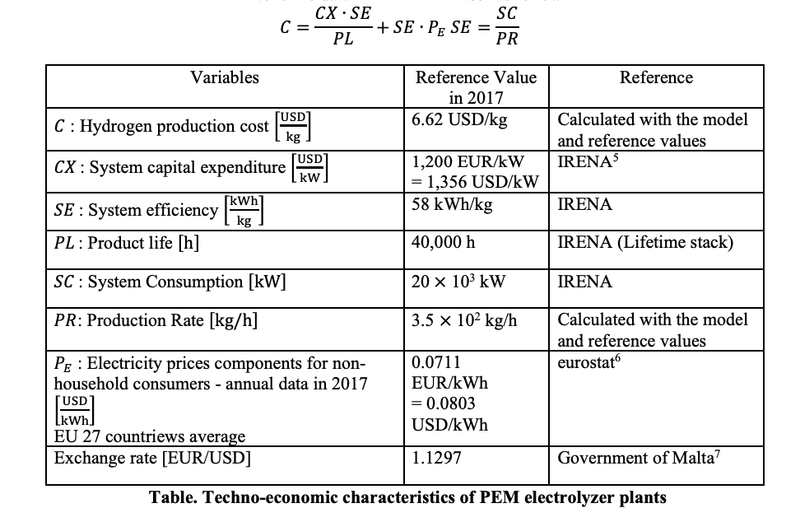
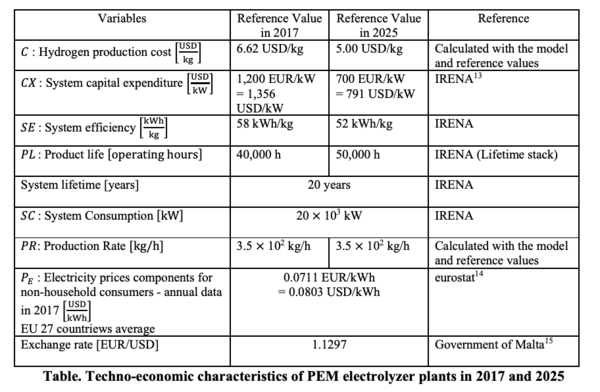
Simplified Technology Model and Reference Value We implement the sensitivity analysis with the reference data of the International Renewable Energy Agency (IRENA). Due to the data limitation, we use the following simplified cost model.
6 https://ec.europa.eu/eurostat/databrowser/view/nrg_pc_205_c/default/table?lang=en
7 https://cfr.gov.mt/en/News/Pages/2018/2017-annual-average-exchange-rates-of-the-Euro.aspx
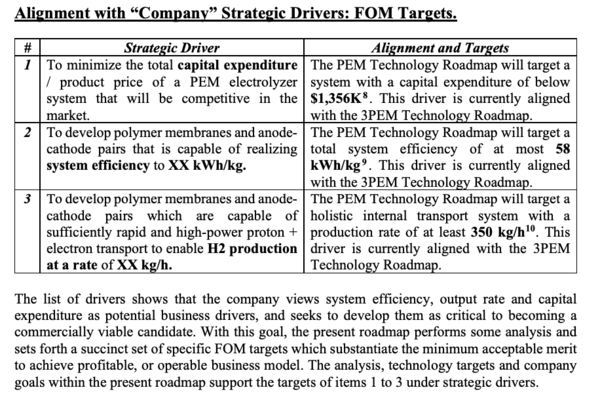
The list of drivers shows that the company views system efficiency, output rate and capital expenditure as potential business drivers, and seeks to develop them as critical to becoming a commercially viable candidate. With this goal, the present roadmap performs some analysis and sets forth a succinct set of specific FOM targets which substantiate the minimum acceptable merit to achieve profitable, or operable business model. The analysis, technology targets and company goals within the present roadmap support the targets of items 1 to 3 under strategic drivers.
8 2017 status number appeared on the IRENA’s report. /media/Files/IRENA/Agency/Publication/2018/Sep/IRENA_Hydrogen_from_renewable_power_2018.pdf https://www.irena.org/- /media/Files/IRENA/Agency/Publication/2018/Sep/IRENA_Hydrogen_from_renewable_power_2018.pdf
9 The same as footnote 4.
10 Calculated with our technology model and reference values in the IRENA’s report.
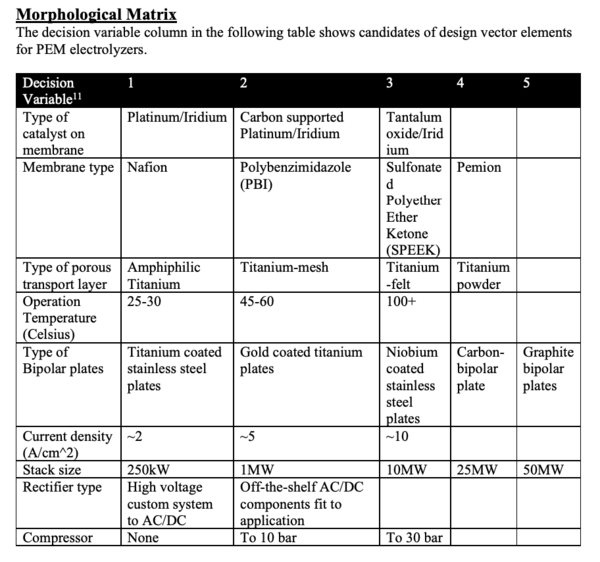
Morphological Matrix
The decision variable column in the following table shows candidates of design vector elements for PEM electrolyzers.
[11 cf. https://www.nrel.gov/docs/fy19osti/72740.pdf https://www.nrel.gov/docs/fy19osti/72740.pdf]
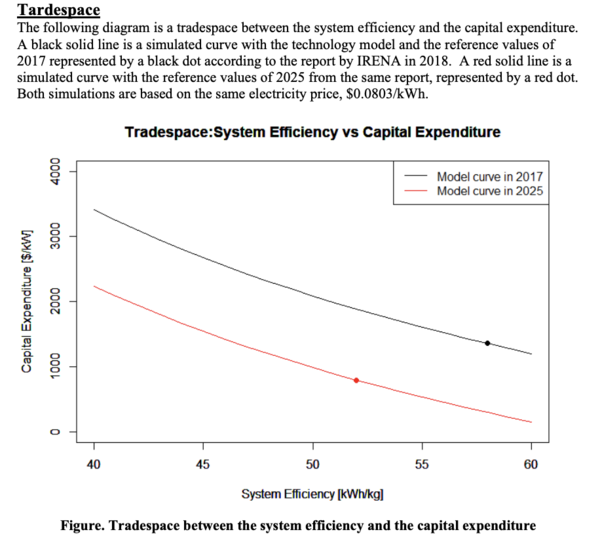
Tardespace
The following diagram is a tradespace between the system efficiency and the capital expenditure. A black solid line is a simulated curve with the technology model and the reference values of 2017 represented by a black dot according to the report by IRENA in 2018. A red solid line is a simulated curve with the reference values of 2025 from the same report, represented by a red dot. Both simulations are based on the same electricity price, $0.0803/kWh.
Financial Model
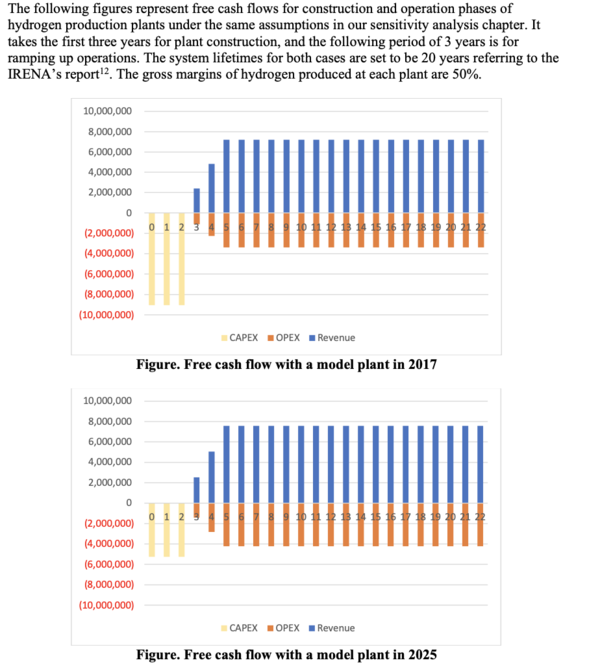
Free cash flow
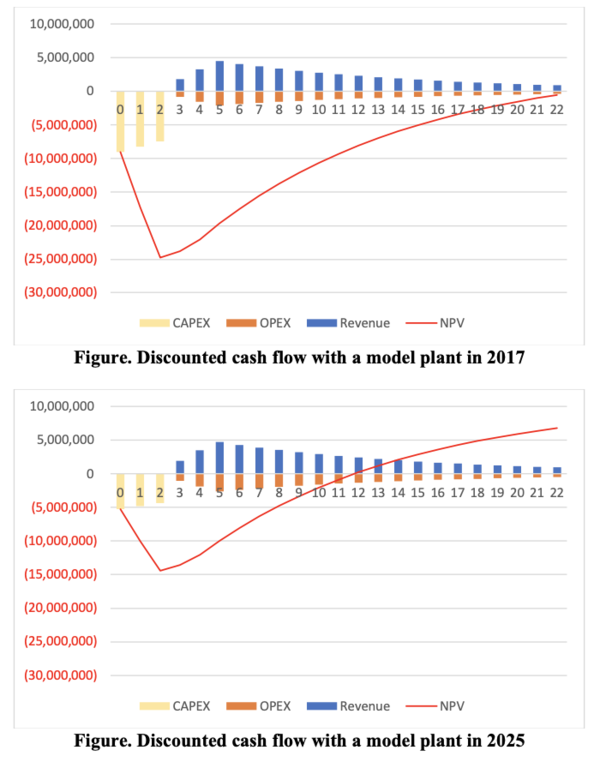
The following figures represent free cash flows for construction and operation phases of hydrogen production plants under the same assumptions in our sensitivity analysis chapter. It takes the first three years for plant construction, and the following period of 3 years is for ramping up operations. The system lifetimes for both cases are set to be 20 years referring to the IRENA’s report12. The gross margins of hydrogen produced at each plant are 50%.
[12 https://www.irena.org/-/media/Files/IRENA/Agency/Publication/2018/Sep/IRENA_Hydrogen_from_renewable_power_2018.pdf 12 https://www.irena.org/-/media/Files/IRENA/Agency/Publication/2018/Sep/IRENA_Hydrogen_from_renewable_power_2018.pdf]
Discounted cash flow and NPV
The following figures show NPV analyses for model plants in 2017 and 2025 based on the abovementioned free cash flows and a discount rate of 10%. Due to the improvement of capital expenditures per system, the model plant in 2025 exhibits a shallower J curve than that in 2017. Updated system efficiency and product life also contribute to a better DCF with the plant model in 2025.
13 https://www.irena.org/-/media/Files/IRENA/Agency/Publication/2018/Sep/IRENA_Hydrogen_from_renewable_power_2018.pdf 14 https://ec.europa.eu/eurostat/databrowser/view/nrg_pc_205_c/default/table?lang=en 15 https://cfr.gov.mt/en/News/Pages/2018/2017-annual-average-exchange-rates-of-the-Euro.aspx
Example of potential use cases: alternative energy medium against LNG
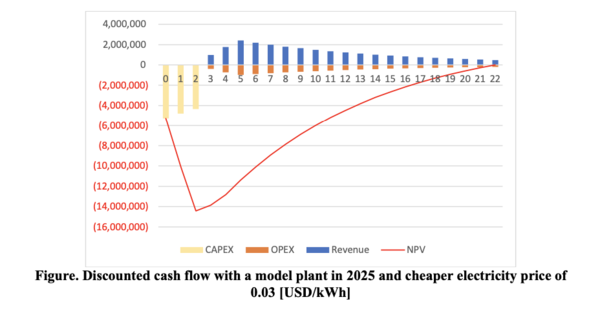
Hydrogen-producing plants have the potentials to be competitive against liquefied natural gas (LNG) supply chain, which is a low-emission fossil fuel with adjustable power plants, especially in Asia. One of the conditions is inexpensive electricity from renewable energy sources, and another is the high price of LNG. According to the International Energy Agency’s report in 2020, the electricity price of 0.03 [USD/kWh] seems to be real16. The LNG price in Asia skyrocketed to over 40 [USD/MMBtu] in October 202117. Our technical and financial models based on references in 2025 realize a competitive hydrogen price of 33.5 [MMBtu](3.82
16 https://www.carbonbrief.org/solar-is-now-cheapest-electricity-in-history-confirms-iea
[USD/kg]) and NPV of almost 0 [USD] with the electricity price of 0.03 [USD/kWh], the discount rate of 10%, and the hydrogen gross margin of 60.3%. Though it is necessary to consider the cost of its whole supply chain for a holistic comparison, hydrogen seems to be a promising alternative energy medium in the near future.
List of R&D Projects
Technology Strategy Statement
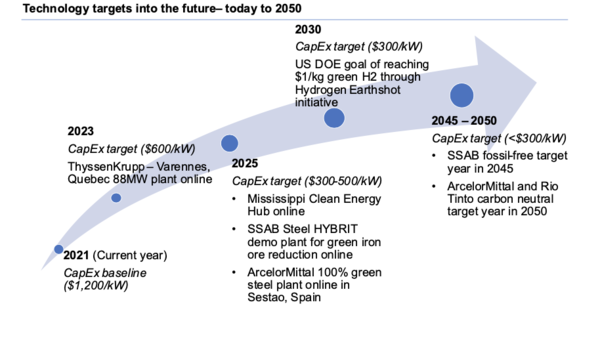
In order to prevent catastrophic and irreversible climate change, the world must decarbonize all sectors – and two of the dirtiest sectors are our power grid and industrial sector. To decarbonize industry and solve the intermittency issue of solar and wind renewables, the world needs cheap green hydrogen. Green hydrogen would displace fossil fuels in the industrial sector and be consumed in chemical reactions in making steel, ammonia and other industrial products. It is also a great alternative to battery storage for grid-scale long duration storage to complement renewables generation. Our strategy is to drop the CapEx ($/kW) of electrolyzer plants to <$600, half of today’s costs, and increase the efficiency (kWh/kg H2 produced) to enable cheap and abundant green hydrogen.
